1894
Correlation-based temporal similarity mapping of DSC-MRI data in patients with asymptomatic unilateral high-grade carotid stenosis1Applied Sciences and Mechatronics, University of Applied Sciences Munich, Munich, Germany, 2Yale University, New Haven, CT, United States, 3Neuroradiology, Technical University of Munich, Munich, Germany, 4Clinic for Neurology, Technical University of Munich, Munich, Germany
Synopsis
High-grade internal carotid artery stenosis is a widespread cause of ischemic stroke. A recent study proposed an iterative correlation-based image analysis method allowing quick identification of regions with perfusion deficits in dynamic susceptibility contrast magnetic resonance imaging. Here, we evaluate whether correlation-based methods can successfully detect perfusion delay in brain tissue in patients with asymptomatic carotid artery stenosis. In addition, we employed a subtraction method to segment regions of delayed perfusion. Volumes segmented by the subtraction method showed good spatial correspondence with dynamic susceptibility contrast-based time-to-peak maps.
Purpose
High-grade
internal carotid artery stenosis (ICAS) is a common cause of ischemic stroke.1 Recently, a method was
proposed to quickly identify cerebral regions with perfusion deficits in stroke
using a standardized iterative correlation process for analysis of dynamic
susceptibility contrast (DSC) perfusion data.2 Based on these findings we examined
whether correlation-based analysis methods can be applied to readily detect
regions with delayed perfusion in asymptomatic patients with extracranial
carotid stenosis. In addition to the previously proposed iterative correlation method,
four alternative procedures were examined in terms of usability and performance.Methods
Twenty-seven patients with unilateral ICAS (>70% according to NASCET criteria) or occlusion underwent DSC imaging (single-shot GE-EPI, 2x2x3.5mm3, TE=30ms, TR=1516ms, α=60°, 80 repetitions, 15-20ml Gd-DOTA after a pre-bolus) on a Philips 3T Ingenia MR-Scanner3. Data of seven subjects were excluded because of severe movement and signal fluctuations, leaving 20 patients (71.2±6.4y, 15 males) for analysis.
DSC data were analyzed using SPM124 and custom Matlab programs5,6. Pearson correlation coefficients (CCs) based on different reference time courses (TCs) were calculated for all voxels. An iterative method (M1) was implemented using the mean TC of all brain voxels (grey (GM) and white matter (WM)) as the initial reference. As proposed by Song et al.2, Pearson correlation analysis was performed six times, always using the mean TC from all voxels with correlation coefficient CC>0.6 as new reference. The other three correlation methods used TCs with short time-to-peaks (TTPs) as references. Method 2 (M2) employed the TC with minimum TTP in GM. Since this selection severely suffered from noise, an additional mask consisting of all CCs<-0.4 was applied before determining a new M2 reference TC. Method 3 (M3) used the mean TCs of voxels with TTPs<0.1% of the maximum TTP in GM and method 4 (M4) used an automatically detected arterial input function (AIF)7. The subtraction method (M5) used the TTP of the reference TC determined for M3 subtracting it from the TTP of each voxel.
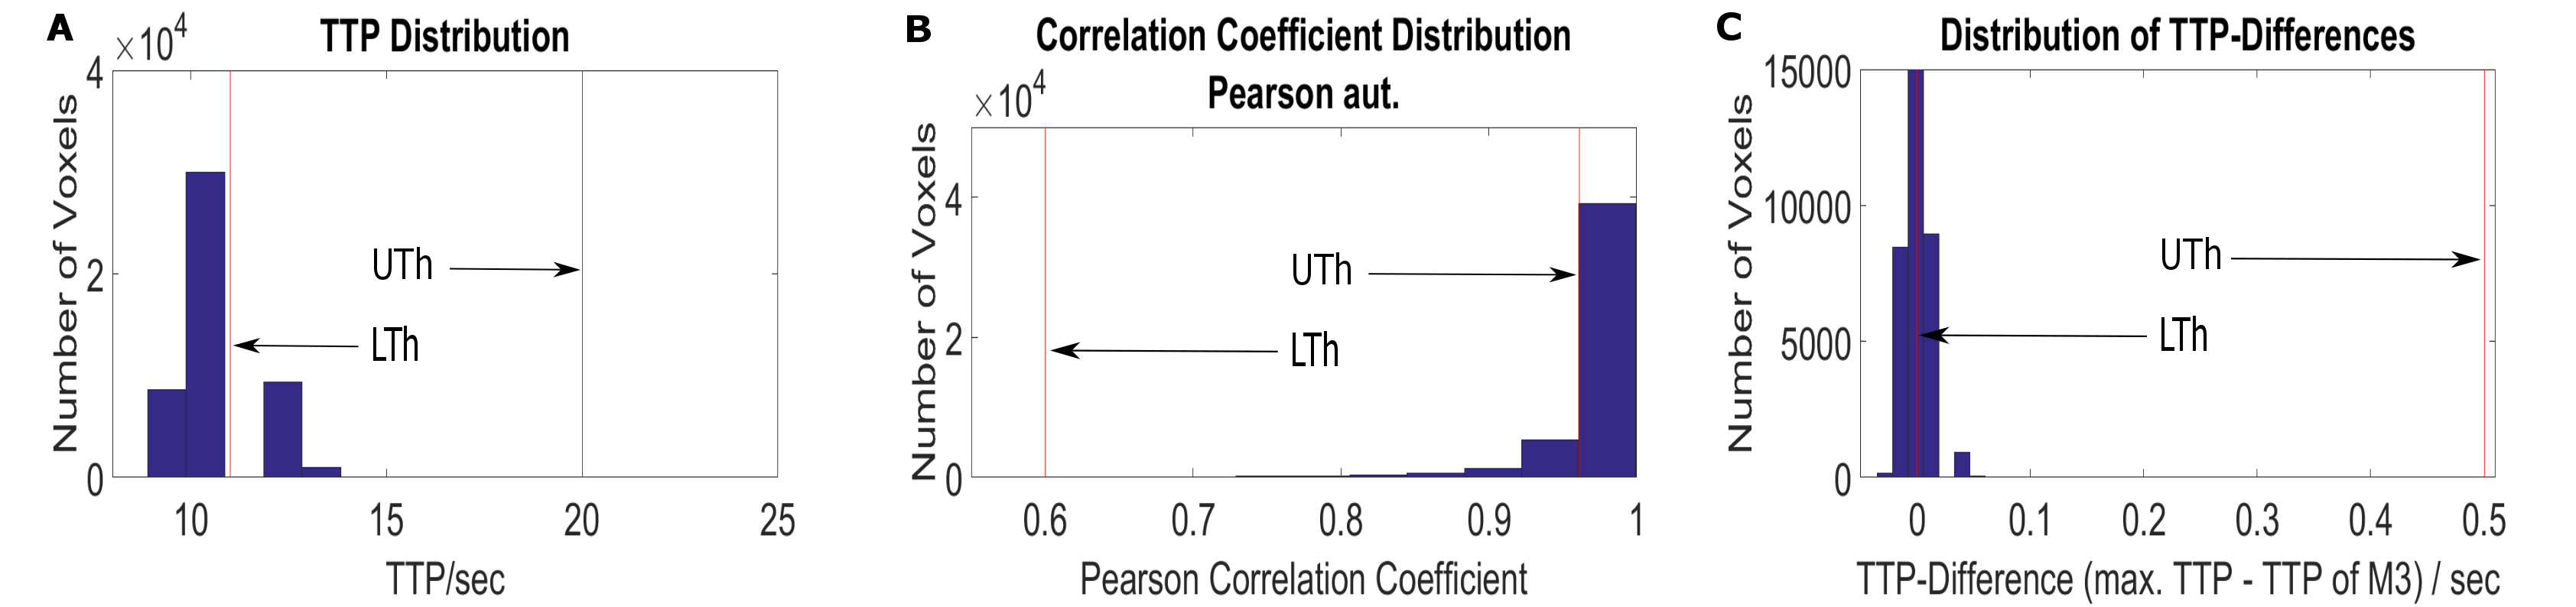
Performance of the investigated methods was examined by identifying regions with prolonged TTP for each subject and by comparing them to volumes with reduced CCs identified for M1-M5. To measure and compare the respective volumes, appropriate thresholds were applied to the TTP, CC and subtraction maps (see Fig.1).
Results
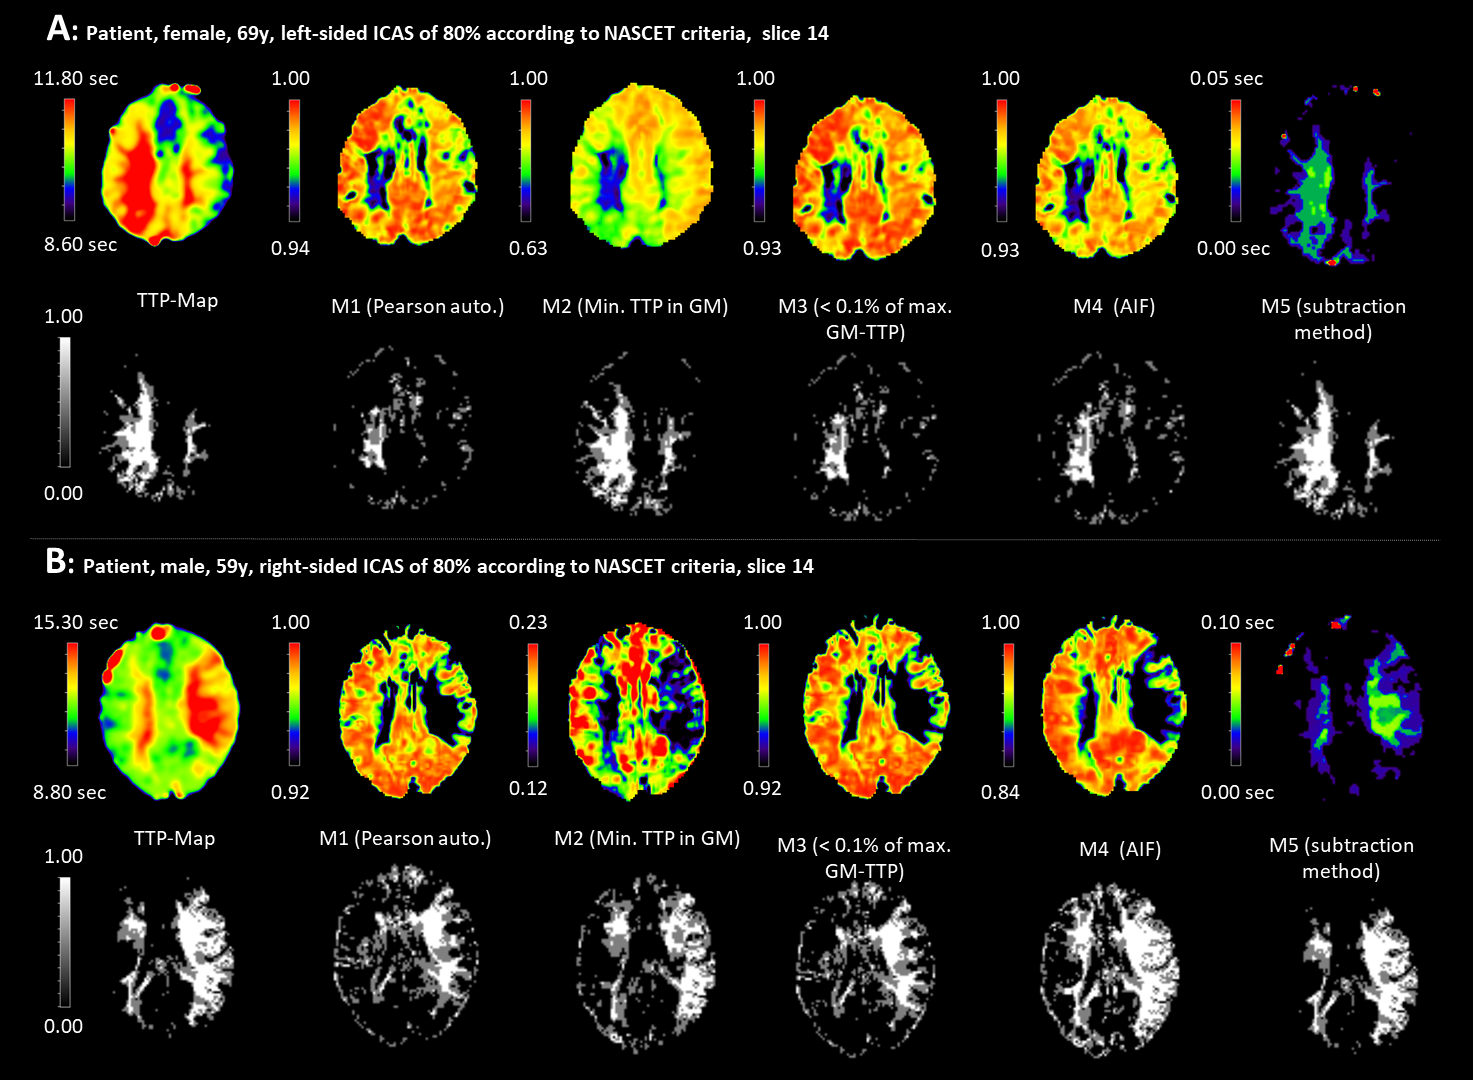
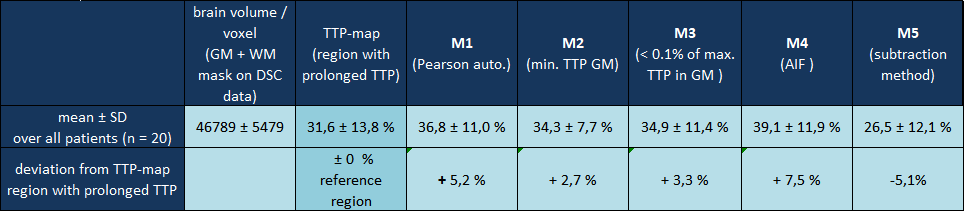
Figure 2 shows examples of two patients (A, B) in which correlation and subtraction analysis revealed areas with low CCs corresponding reasonably well to areas with prolonged TTP. Visual rating (rater MW) with regard to spatial congruency revealed that M1 and M3 showed good or acceptable results in all patients, M2 in 75%, M4 in 95%, and M5 in 90% of all patients. However, low CC values of M1 also detected regions with short TTPs in addition to prolonged TTPs. M2 completely failed or yielded poor CC-maps in one or four patients, respectively. AIF-detection employed for M4 reliably found good quality TCs with shortest TTP in all patients. Consequently, low-CC volumes obtained from M4-based CC-maps tended to be larger than the reference region with prolonged TTP (Table 1). Overall, thresholding the CC-maps for analyzing the methods’ performance was difficult in some patients because of poor image quality or the lack of distinct regions with prolonged TTP, resulting in nearly uniform CC-values approaching 1.0. Overall, the largest lesion regions were identified by M4 (+7.5%), the smallest by M5 (-5.1%)(Table 1).Discussion
All methods except M2 successfully identified regions with prolonged TTP in ≥90% of all patients. However, the iterative method (M1) showed precision deficits because low CCs could also mean short TTPs, whereas correlation with the AIF (M4) tended to identify regions that were larger than the TTP-based reference region (Table 1). Due to its high sensitivity to noise, M2 appears not suitable for broader use, producing poor results in 25% of all patients. Even though the subtraction method (M5) failed in two patients with only slightly prolonged TTPs, it revealed excellent congruence with the visually identified TTP regions in 18 patients. Moreover, it is by far the fastest method with a processing time of 18±5sec compared to 686±12sec (M1), 235±13sec (M2), 130±11sec (M3), 119±4sec (M4) [Lenovo ThinkPad X201 with Intel® Core™ i5 CPU, 8GB RAM, 64 bit Windows 10].Conclusion
Correlation-based analysis of DSC-data yielded promising results in asymptomatic ICAS patients. In contrast to recently reported results in stroke patients,2 the observed effects are more subtle and sensitive to deficits in data quality. Nevertheless, with further methodological improvements, the technique may provide a quick clinical assessment of perfusion status in the future.Acknowledgements
No acknowledgement found.References
1. Petty GW, Brown RD, Whisnant JP, Sicks JD, O Fallon WM, Wiebers DO. Ischemic Stroke Subtypes, A Population-Based Study of Incidence and Risk Factors. Stroke 1999;30:2513–6.
2. Song S, Bokkers RPH, Luby M, et al. Temporal similarity perfusion mapping: A standardized and model-free method for detecting perfusion deficits in stroke. PLoS ONE 2017;12:e0185552.
3. Philips: Philips Healthcare, Hamburg, Germany.
4. SPM12: Statistical Parametric Mapping software (SPM12) Version 6225. Available from: www.fil.ion.ucl.ac.uk/spm.
5. Matlab: MATLAB and Statistics Toolbox Release 2016a, The MathWorks, Inc., Natick, Massachusetts, United States.
6. Kluge 2016: Kluge A, Lukas M, Preibisch C et al. Analysis of three leakage-correction methods for DSC-based measurement of relative cerebral blood volume with respect to heterogeneity in human gliomas. MRI 34(4) (2016): 410-421.
7. Hedderich D, Kluge A, Pyka T, Zimmer C, Kirschke J, Wiestler B, Preibisch CInfluence of leakage correction on DSC-based CBV values acquired without and with prebolus in human high-grade glioma. Proc. Intl. Soc. Mag. Reson. Med. 25. (2017).
8. Vinci software, Max-Planck-Institut für neurologische Forschung, Cologne, Germany: http://www.nf.mpg.de/vinci3/. Assessed 09.Nov 2015.
Figures