1889
Simultaneous depiction of arterial and venous vasculature at high spatial resolution with 3D spoiled gradient multi-echo acquisition at 7T1IRCCS Stella Maris, Pisa, Italy, 2Imago 7 Research Center, IRCCS Stella Maris, Pisa, Italy, 3University of California San Francisco, San Francisco, CA, United States, 4Azienda Ospedaliero-Universitaria Pisana, Pisa, Italy, 5University of Pisa, Pisa, Italy
Synopsis
The simultaneous depiction of both arterial and venous vasculature has recently been demonstrated by using multi-echo sequences. We quantitatively and qualitatively assessed the simultaneous representation of intracranial arteries and veins at a higher resolution than previously reported using a customized 3D spoiled gradient multi-echo sequence at 7T. Such custom sequence had an overall better capability of depicting the arterial vasculature compared to conventional time-of-flight (TOF) arteriography. On the contrary, veins were in general better depicted by conventional susceptibility-weighted venography, however the custom multi-echo sequence provided superior quality images of the superficial veins.
Introduction
The simultaneous depiction of arterial and venous vasculature has recently been demonstrated by using multi-echo sequences1—6. Here we assessed the representation of intracranial arteries and veins at a higher resolution than previously reported using a customized single-slab 3D spoiled gradient multi-echo sequence at 7T6, and compared it to conventional time-of-flight (TOF) arteriography and multi-echo susceptibility-weighted venography.Methods
Images were acquired with an MR950 7T system (GE Healthcare) equipped with a 32-ch receive head coil (Nova Medical). The same subject underwent the following sequences, all prescribed axially with the same coverage of 50mm along z, with (0.5mm)3 isotropic spatial resolution:
- meTOF: custom spoiled 3D gradient multi-echo sequence6, single slab, with TE=3.0ms, 11.0ms, 18.9ms, 26.9ms, TR / FA / FOV / ReceiverBW = 40ms / 25deg / 3ms / 192mm / ±41.7kHz; acquisition matrix 384x384, flow-compensated, ramp-excitation, ARC (Auto-calibrating recostruction for Cartesian sampling) acceleration factor=3; scan duration=8’04’’. Data from the first echo were used to produce arteriography images. The average of T2*-weighted images from echoes 2~4 were used to produce venography images.
- TOF: product 3D time-of-flight multiple-overlapping thin-slab acquisition with two slabs (12 overlapping locations), TR / FA / TE / FOV / ReceiverBW = 19ms / 15deg / 3ms / 192mm / ±31.2kHz; acquisition matrix 384x384, flow-compensated, ramp-excitation, fat-saturation, ASSET (Array coil Spatial Sensitivity Encoding) acceleration factor=3; scan duration=3’50’’.
- SWAN: product susceptibility-weighted 3D gradient multi-echo sequence with TE=5.8ms, 12.4ms, 19.0ms, 25.6ms, 32.2ms, 38.8ms, TR / FA / FOV / ReceiverBW = 44.1ms / 15deg / 192mm / ±41.7kHz; matrix size=384x384, flow compensated, ASSET factor=3; scan duration=5’21’’.
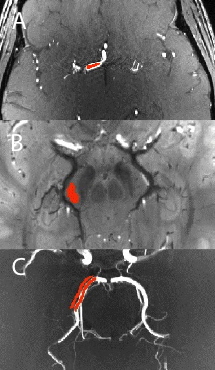
For arteriography, 17 ROIs were manually drawn in different segments of the cerebral arteires (medial, anterior and posterior segments), in the carotid siphon, and basilar artery (Fig.1A). For venography, 16 ROIs were drawn in the parenchyma adjacent to the rectal sinus and the perimesencephalic and internal cerebral veins: in white matter, corpus callosum and pons Varolii (Fig.1B). By using the data of two co-registered acquisitions of the same kind, SNR was measured in each ROI with the difference method7, in meTOF’s and TOF’s arteriograhies, as well as in meTOF’s and SWAN’s venographies.
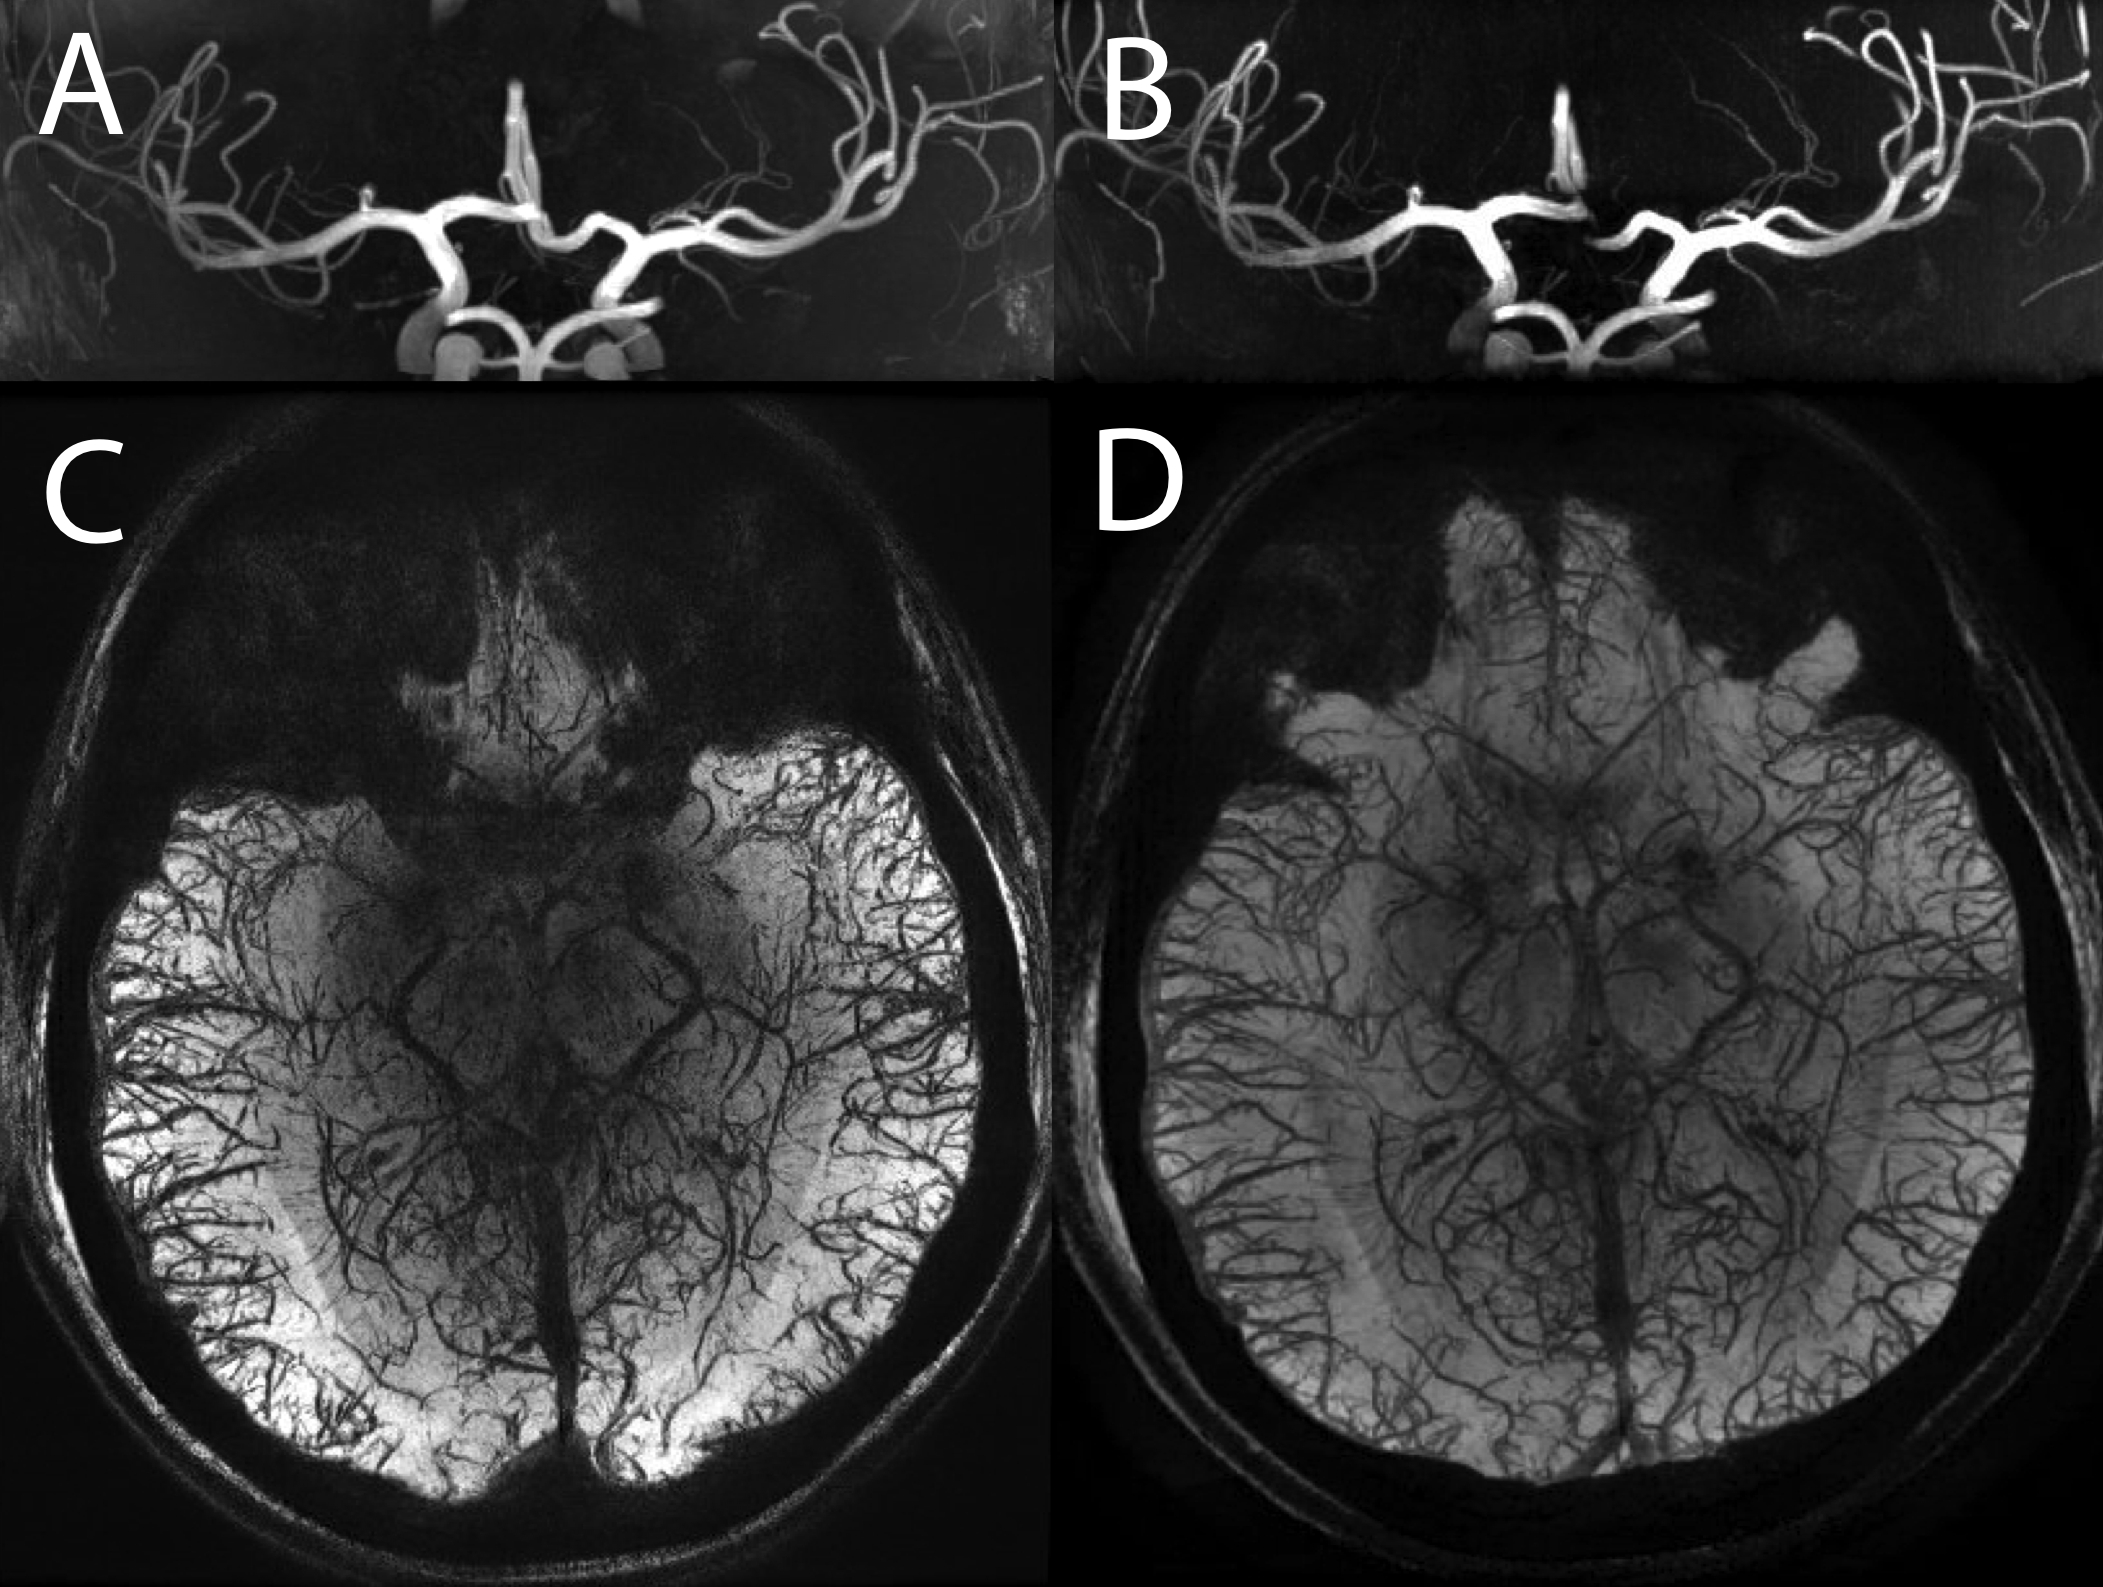
Maximum Intensity Projection (MIP) images were generated for arteriographies, while Minimum Intensity Projection (mIP) images were generated for venographies, all with thickness=8mm. 50 ROI pairs covered the vessels (either artery or vein) and the respective adjacent parenchyma (Fig.1C), and were used to compute Relative Contrast (RC)8.
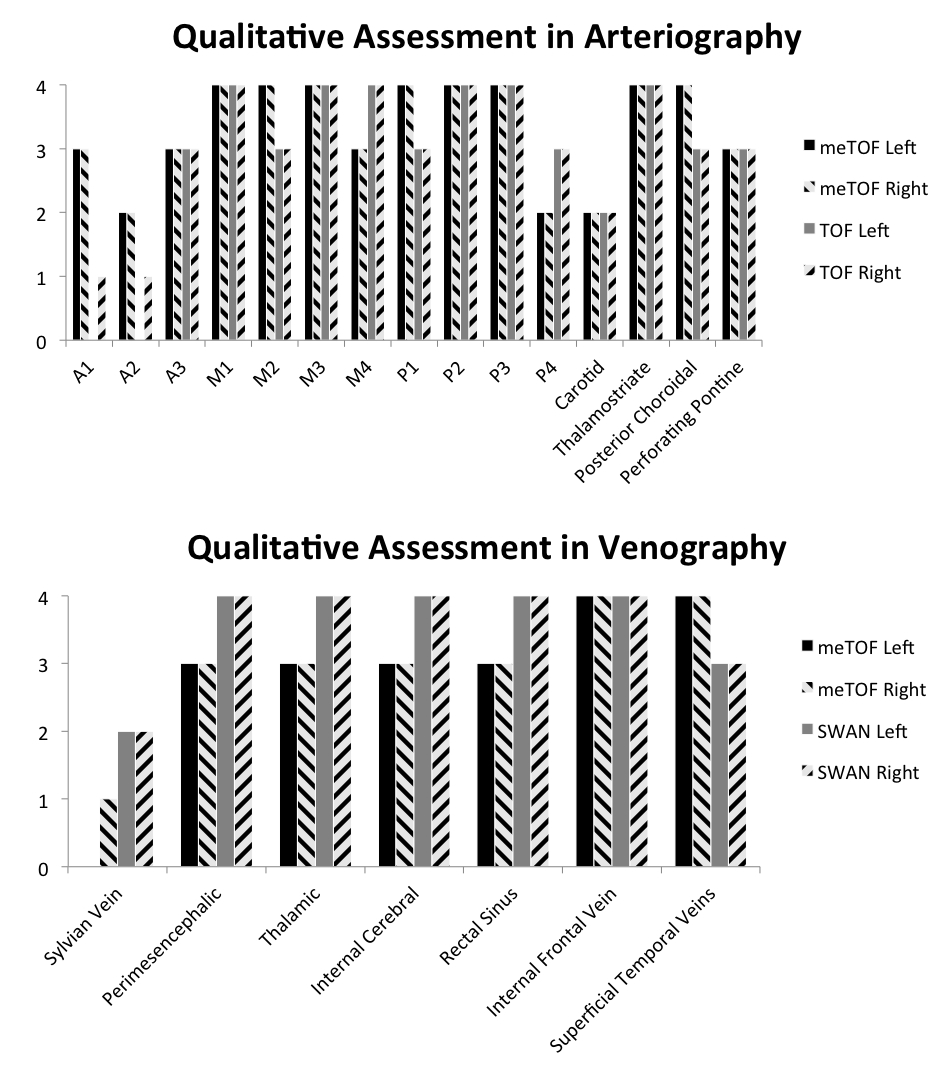
Additional sets of MIP and mIP images were generated with thickness = 30mm (Fig.2) and were used by an expert neuroradiologist to qualitatively evaluate the visualization of different vascular tracts with scores ranging between 0 and 4 (0 = no visualization of the tract; 4 excellent visualization).
Results
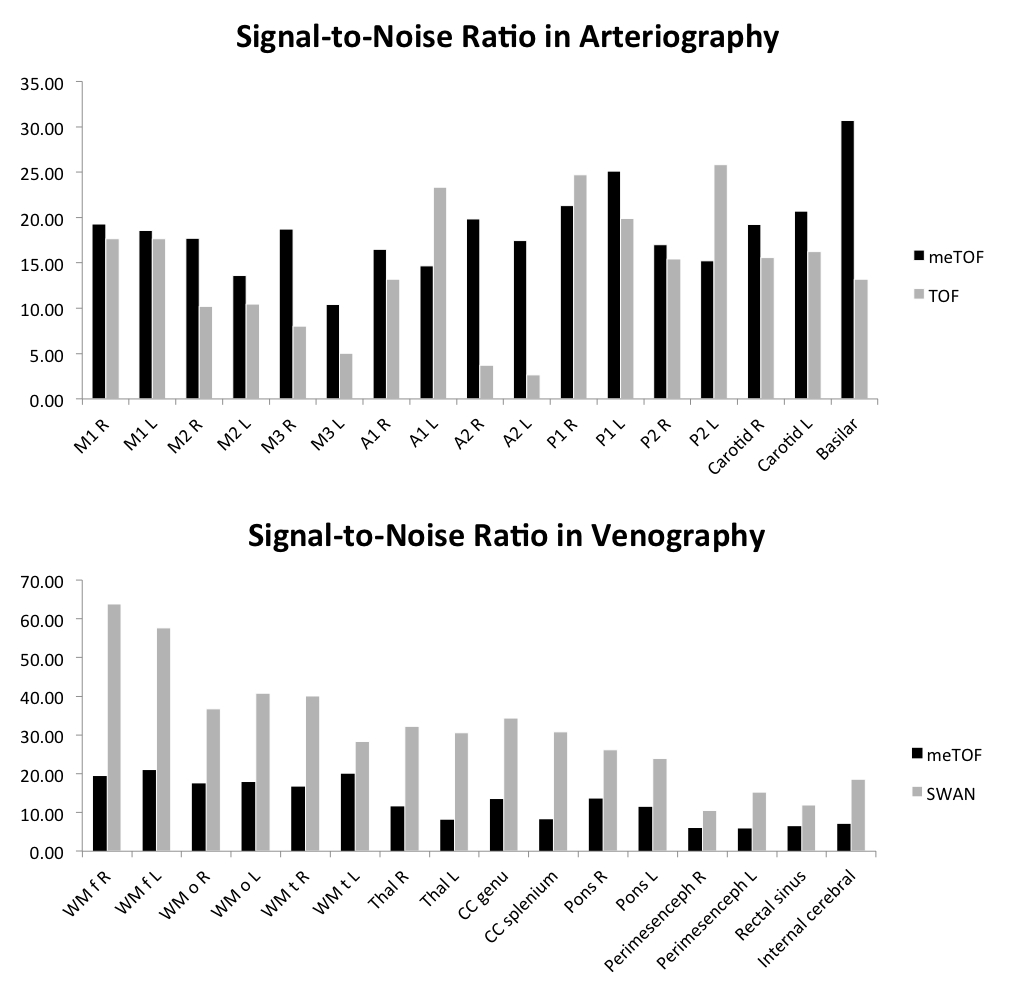
Quantitative SNR measurements are reported in Fig.3. The arteriography based on the custom meTOF sequence had an overall better SNR. The maximum difference was observed in the anterior cerebral artery. In venography, SNR was, on average, 2.5 times higher in SWAN than in the meTOF sequence.
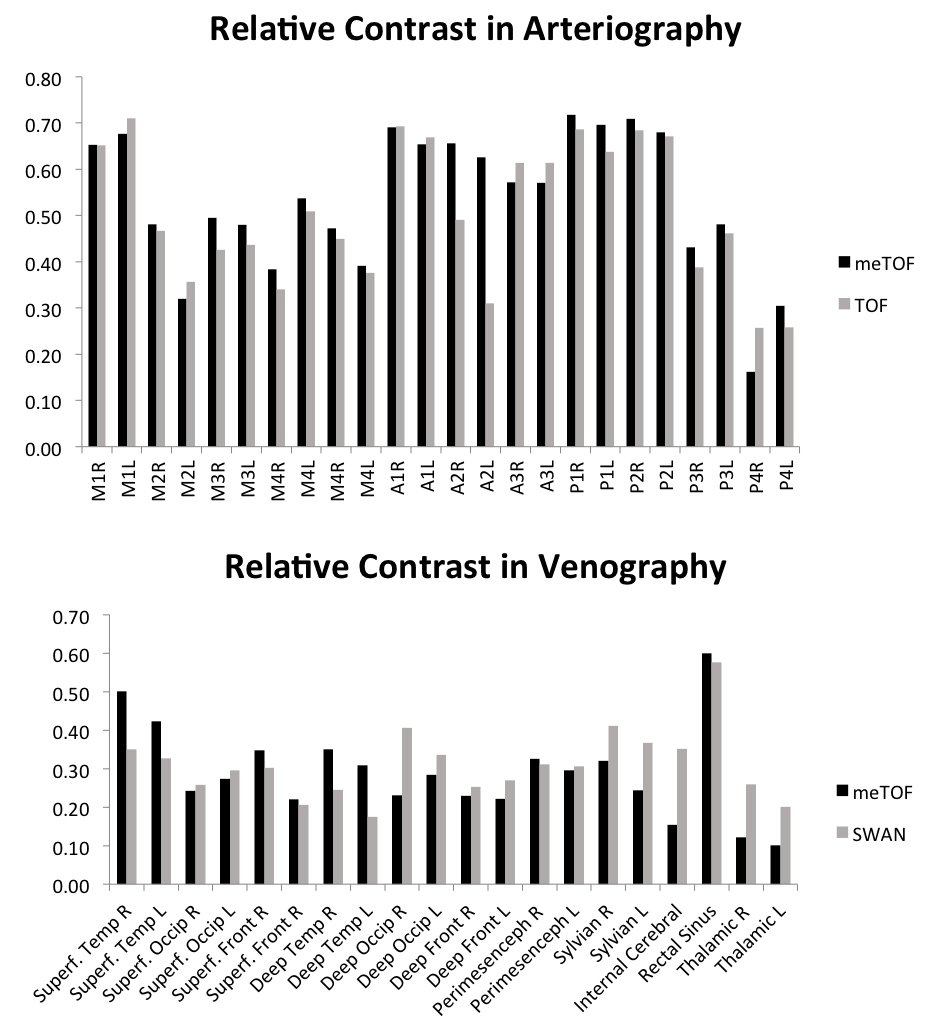
RC measures are shown in Fig.4. In arterial tracts RC was, on average, 7.4% higher in meTOF than in conventional TOF. The RC in meTOF was higher in particular in proximal tracts, while in distal arteries the RC was only 1.7% higher than in TOF. In venography, RC was 4.8% higher in SWAN than in meTOF, but this measure was biased by the measurements in deep veins, where RC in SWAN was 8.1% higher than in meTOF. On the contrary, meTOF’s venography had a 27.3% higher RC than SWAN when only superficial veins were considered.
The qualitative assessment scores are shown in Fig.5. Scores attributed to images acquired with different techniques varied depending on the tracts being examined.
Discussion and Conclusion
The custom multi-echo sequence6 had an overall better capability of depicting the arterial vasculature compared to the conventional TOF sequence, from both quantitative and qualitative standpoints, despite the use of one single slab and longer TR. On the contrary, veins were better depicted by SWAN, possibly due to the larger number of echoes being used; however the meTOF-based venography provided images with satisfactory quality and, for superficial veins, it was superior to conventional imaging. The simultaneous acquisition of co-registered arterial and venous vasculature at high resolution is therefore feasible and presents some advantages with respect to conventional approaches. It is also worth noting that while the conventional TOF acquisition at 7T approached the Specific Absorption Rate (SAR) time-average limit of 3.2W/kg imposed by International Electrotechnical Commission (standard IEC-60601-2-33), the custom multi-echo sequence used in this study6 runs below such limits (SAR was about half that of TOF). In conclusion, this technique could be a new valuable tool in clinical radiological settings for studying neurovascular pathologies.Acknowledgements
No acknowledgement found.References
- Du YP, Jin Z. Simultaneous acquisition of MR angiography and venography (MRAV). Magn Reson Med 2008;59:954–958.
- Du YPP, Jin ZY, Hu YZ, Tanabe J. Multi-echo acquisition of MR angiography and venography of the brain at 3 Tesla. J Magn Reson Imaging 2009;30:449–454.
- Deistung A, Dittrich E, Sedlacik J, Rauscher A, Reichenbach JR. ToF-SWI: Simultaneous time of flight and fully flow compensated susceptibility weighted imaging. J Magn Reson Imaging 2009;29:1478–1484.
- Park SH, Moon CH, Bae KT. Compatible dual-echo arteriovenography (CODEA) using an echo-specific k-space reordering scheme. Magn Reson Med 2009;61:767–774.
- Bae KT, Park SH, Moon CH, Kim JH, Kaya D, Zhao T. Dual-echo arteriovenography imaging with 7T MRI. J Magn Reson Imaging. 2010 Jan;31(1):255-61.
- Bian W, Banerjee S, Kelly DA, Hess CP, Larson PE, Chang SM, Nelson SJ, Lupo JM. Simultaneous imaging of radiation-induced cerebral microbleeds, arteries and veins, using a multiple gradient echo sequence at 7 Tesla. J Magn Reson Imaging. 2015 Aug;42(2):269–279.
- Dietrich O, Raya JG, Reeder SB, Reiser MF, Schoenberg SO. Measurement of signal-to-noise ratios in MR images: influence of multichannel coils, parallel imaging, and reconstruction filters. J Magn Reson Imaging. 2007 Aug;26(2):375-85.
- Van de Moortele P-F, Auerbach EJ, Olman C et al: T1 weighted brain images at 7 Tesla unbiased for Proton Density, T2* contrast and RF coil receive B1 sensitivity with simultaneous vessel visualization. NeuroImage 2009; 46:432–446
Figures