1888
Quantitative assessment of USPIO uptake in cerebral small vessel disease1Centre for Clinical Brain Sciences, University of Edinburgh, Edinburgh, United Kingdom, 2Centre for Cardiovascular Science, University of Edinburgh, Edinburgh, United Kingdom
Synopsis
A method for assessing cerebral blood volume and inflammation in small vessel disease was piloted, employing T1 relaxometry and USPIO contrast agent. 12 stable patients with a history of minor stroke were recruited and scanned pre- and post-contrast, and at 24-30 hours. R1 increased following USPIO administration and remained elevated at 24-30 hours; apparent cerebral blood volume did not change significantly in any tissue at 24-30 hours versus post-contrast (p > 0.20). Our work demonstrates the feasibility of T1 relaxometry for quantitative assessment of USPIO distribution but larger studies are required to determine whether detectable inflammatory uptake occurs.
Introduction
The pathophysiology of cerebral small vessel disease (cSVD) is poorly understood, but there is histopathological evidence of infiltration of inflammatory cells into the small vessel walls and perivascular tissues.1, 2 Ultrasmall superparamagnetic particles of iron oxide (USPIO) contrast agents that are taken up by inflammatory cells have been used to assess inflammation in the cardiovascular system3 and in ischaemic stroke lesions,4 and for steady-state cerebral blood volume measurement in tumours.5 In this study we aimed to pilot USPIO-based assessment of contrast in blood and other parenchymal locations in cSVD. In contrast to previous literature, we used a quantitative T1 relaxometry approach to distinguish between contrast in the blood pool and in other locations.Methods
12 patients were recruited with a history of non-disabling minor ischemic stroke occurring a minimum of 1 month previously. Participants were scanned on a 3T Siemens Magnetom Verio MRI scanner with a 12-channel receive-only head coil (Siemens Healthcare, Erlangen, Germany). Scans took place at baseline (“scan 1pre”), which was immediately followed by USPIO (Ferumoxytol; 4.0 mg/kg) infusion, and at 24-30 hours after USPIO infusion (“scan 2”). Eight of the patients were also scanned immediately after 1/3 of the USPIO dose had been administered (“scan 1post”). Structural imaging at baseline included T1w, T2w, T2*w and T2-FLAIR. R1 with compensation for flip angle inhomogeneity was measured using the DESPOT1-HIFI method6 (acquired resolution 0.94 x 1.25 x 2 mm) at each scan, consisting of two 3D inversion-recovery prepared spoiled gradient echo sequences (TR/TI/TE = [1190, 632]/[1000, 450]/2.3 ms, FA=5°) and three 3D spoiled gradient echo sequences (TR/TE = 5.7/2.5 ms, FA = [12, 5, 3]°). R1 maps were calculated using in-house Matlab (Natick, MA) software and structural images were segmented semi-automatically to obtain median R1 values in normal-appearing white matter (WM), white matter hyperintensities (WMH) and stroke lesions (SL). Small regions were manually segmented in the superior sagittal sinus to obtain blood R1. Apparent cerebral blood volume CBVapp was calculated post-infusion and at 24-30 hours as CBVapp = ΔR1,tissue/ΔR1,blood, where ΔR1 is the change in R1 relative to baseline. It was assumed that at scan 1post USPIO was restricted to the blood pool so that CBVapp reflects the true blood volume fraction; it was hypothesised that additional non-blood-pool uptake at 24-30 hours due to inflammation or other causes would result in increased CBVapp at scan 2.Results
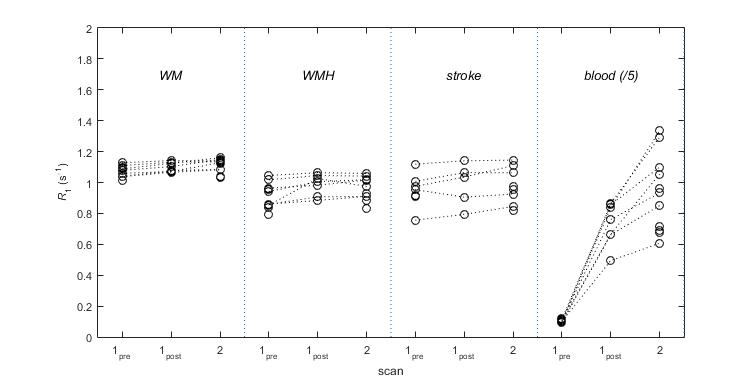
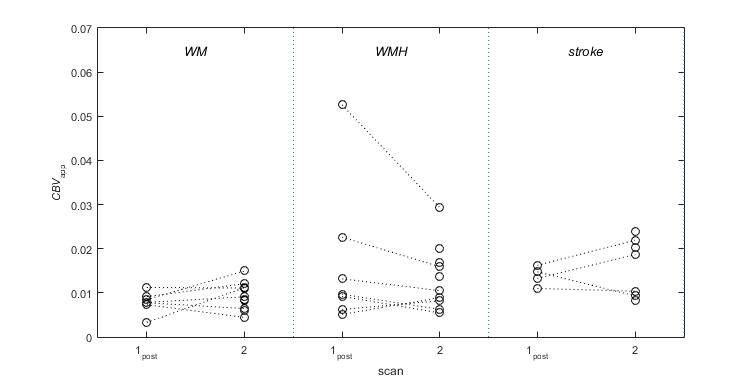
Data were obtained in all 12 patients (mean age 74.7 ± 6.3 years); data for one patient were excluded due to failure of the automatic tissue segmentation. R1 increased in all tissues (p < 0.05) except stroke lesions (p = 0.27), and in blood (p < 10-4) immediately after USPIO infusion and was elevated in all regions (p < 0.015) at 24-30 hours (Figure 1). CBVapp values (Figure 2) measured at scan 1post were higher in WMH (0.0169 ± 0.0155) versus WM (0.0079 ± 0.0022), though the difference was not statistically significant (p = 0.17); values in stroke lesions (0.0076 ± 0.0125) were similar to those in WM (p = 0.95). Mean CBVapp did not change significantly in any of the regions at 24-30 hours (p > 0.20).Discussion
Steady-state measurements using USPIO contrast combined with T1 relaxometry permit CBV estimation that is inherently less dependent on scanner temporal stability and requires less complex kinetic modelling compared with dynamic gadolinium-based approaches.7 The trend towards higher blood volume in WMH versus WM is somewhat counter-intuitive given the traditional assumption of cSVD as an ischemic disease; however, similar results have been reported in a comparable patient population using a T1w dynamic contrast-enhanced MRI approach.7 The present analysis does not support generalised inflammatory USPIO uptake in the brain in chronic quiescent cSVD but is limited by the statistical power of this pilot study; larger samples, additional analysis of recent subcortical infarcts and other specific tissues, and analysis of R2* changes are required. Finally, it is likely that some of the variance in our data is caused by small, non-linear mis-registrations between the tissue masks and parameter maps across the time points; further work will be undertaken to refine the co-registration and segmentation pipelines to increase the precision of ΔR1 measurements.Conclusion
This pilot study demonstrates the feasibility of combining USPIO administration with T1 relaxometry for quantitative assessment of cerebral blood volume and for detecting potential non-blood-pool signal contributions in cSVD. Further refinement of the method and larger studies are required to determine whether inflammatory uptake occurs at 24-30 hours.Acknowledgements
This work was funded by the Wellcome Trust-University of Edinburgh Institutional Strategic Support Fund. Support was also received from: NHS Lothian Research and Development Office (MJT), the Scottish Imaging Network: A Platform for Scientific Excellence (“SINAPSE”, funded by the Scottish Funding Council and the Chief Scientist Office of Scotland; GB, radiography staff), The Stroke Association Garfield Weston Foundation Senior Lectureship (FD), NHS Research fellowship (FD) and the Medical Research Council (FD). We thank K. Shuler and the radiography staff for providing expert research support, and Dr Craig Buckley and Dr Radhouene Neji (Siemens Healthcare) for helpful discussions.References
1. Bailey EL, Smith C, Sudlow CL, Wardlaw JM. Pathology of lacunar ischemic stroke in humans--a systematic review. Brain Pathol 2012; 22(5): 583-91.
2. Gouw AA, Seewann A, van der Flier WM, Barkhof F, Rozemuller AM, Scheltens P et al. Heterogeneity of small vessel disease: a systematic review of MRI and histopathology correlations. J Neurol Neurosurg Psychiatry 2011; 82(2): 126-35.
3. Alam SR, Stirrat C, Richards J, Mirsadraee S, Semple SI, Tse G et al. Vascular and plaque imaging with ultrasmall superparamagnetic particles of iron oxide. J Cardiovasc Magn Reson 2015; 17: 83.
4. Saleh A, Schroeter M, Jonkmanns C, Hartung HP, Modder U, Jander S. In vivo MRI of brain inflammation in human ischaemic stroke. Brain 2004; 127(Pt 7): 1670-7.
5. Varallyay CG, Nesbit E, Fu R, Gahramanov S, Moloney B, Earl E et al. High-resolution steady-state cerebral blood volume maps in patients with central nervous system neoplasms using ferumoxytol, a superparamagnetic iron oxide nanoparticle. J Cereb Blood Flow Metab 2013; 33(5): 780-6.
6. Deoni SC. High-resolution T1 mapping of the brain at 3T with driven equilibrium single pulse observation of T1 with high-speed incorporation of RF field inhomogeneities (DESPOT1-HIFI). J Magn Reson Imaging 2007; 26(4): 1106-11.
7. Heye AK, Thrippleton MJ, Armitage PA, Valdes Hernandez Mdel C, Makin SD, Glatz A et al. Tracer kinetic modelling for DCE-MRI quantification of subtle blood-brain barrier permeability. NeuroImage 2016; 125: 446-55.
Figures