1887
Feasibility of cerebral blood volume mapping by using velocity selective arterial spin labeling with 3D radial gradient echo acquisition1Department of Medical Physics, University of Wisconsin-Madison, Madison, WI, United States, 2Department of Radiology, University of Wisconsin-Madison, Madison, WI, United States
Synopsis
Theoretically, velocity selective arterial spin labeling (VS-ASL) can be utilized for obtaining cerebral blood volume (CBV). However, challenges such as large vessel contamination and readout dependent artifacts make it difficult to obtain quantitative values. This work investigates the feasibility of VS-ASL CBV mapping by using three-dimensional gradient echo radial acquisition. Measured CBV’s were found to be comparable to previous literature, however results highlight the potential resolution dependence of low SNR ASL based CBV mapping.
Purpose
A vast array of non-contrast arterial spin labeling (ASL) approaches have been proposed and are being used to measure cerebral blood flow (CBF). Unfortunately, achieving reliable non-contrast cerebral blood volume (CBV) without contrast has been highly challenging. Velocity selective arterial spin labeling (VS-ASL) is technique capable of tagging slow moving spins such as those in small vessel [1]. A recent study has shown the feasibility in using VS-ASL for cerebral blood volume mapping by using echo-planar imaging (EPI) acquisition [2]. While EPI provides high signal-to-noise ratio (SNR), accuracy in utilizing EPI readouts for flow encoded sequence could be degraded as the signal decays during the echo train. This is in addition to artifacts such as geometric distortion that make avoiding large vessels challenging. Therefore, the use and comparison to alternative sampling readout would be favorable. In this study, we aimed to determine the feasibility of cerebral blood volume mapping by using a 3D radial gradient echo with velocity selective preparation.Methods
VS-ASL pulse sequence:
Figure 1 demonstrates the pulse sequence diagram used in this study. A series of 90° saturation pulses followed by adiabatic inversion pulse are used for background signal suppression. Timing was chosen for CSF nulling at tagging time with inversion time (TI) = 2.47 s and recovery time (Trecovery) = 1.53 s based on Bloch simulation. An eddy current and B1 insensitive VS module was inserted before acquisition, performed by a symmetric adiabatic BIR-8 preparation module [3] with modification for eliminating subtraction errors from diffusion-weighted signals. After a 20-ms post-labeling delay (PLD), images were then acquired with a Look-Locker 3D gradient echo radial readout with sampling time (Tacq) = 0.5 s.
Image acquisition of normal volunteer:
Imaging was performed at 3T (Discovery MR750w, GE medical system) with a 32-channel head coil. VS gradients were set to be with velocity cutoff (Vc) = 0.5 mm/s. Gradients were derated to Gmax = 15 mT/m, Slew= 60 T/m/s with a 4 ms delay after to reduce eddy current errors. VS-ASL was then acquired with 3D radial gradient echo imaging (pulse train length = 40; flip angle = 8°; 4 echoes per acquisition averaged; 5000 projections; field of view = 240 x 240 x 160 mm3; reconstructed resolution = 1.875 x 1.875 x 1.875 mm3, Scan time = 19:40).
Labeling and control pulses were interleaved to minimize errors from bulk motion. Reference image for compensating coil sensitivity and scaling equilibrium magnetization of blood was then acquired followed by a 4-s delay for T1 recovery.
Image reconstruction and analysis:
Images were retrospectively reconstructed at varying spatial resolutions using a gaussian smoothing kernel was applied in k-space. A set of ratio map was calculated from dividing signal difference to its reference image. These ratio maps were then converted to estimate CBV the expected ratio of blood to background signal from Bloch simulation. CBV values in gray matter (GM) and white matter (WM) were extracted from manually drawn regions-of-interests (ROIs) for further estimation.
Results
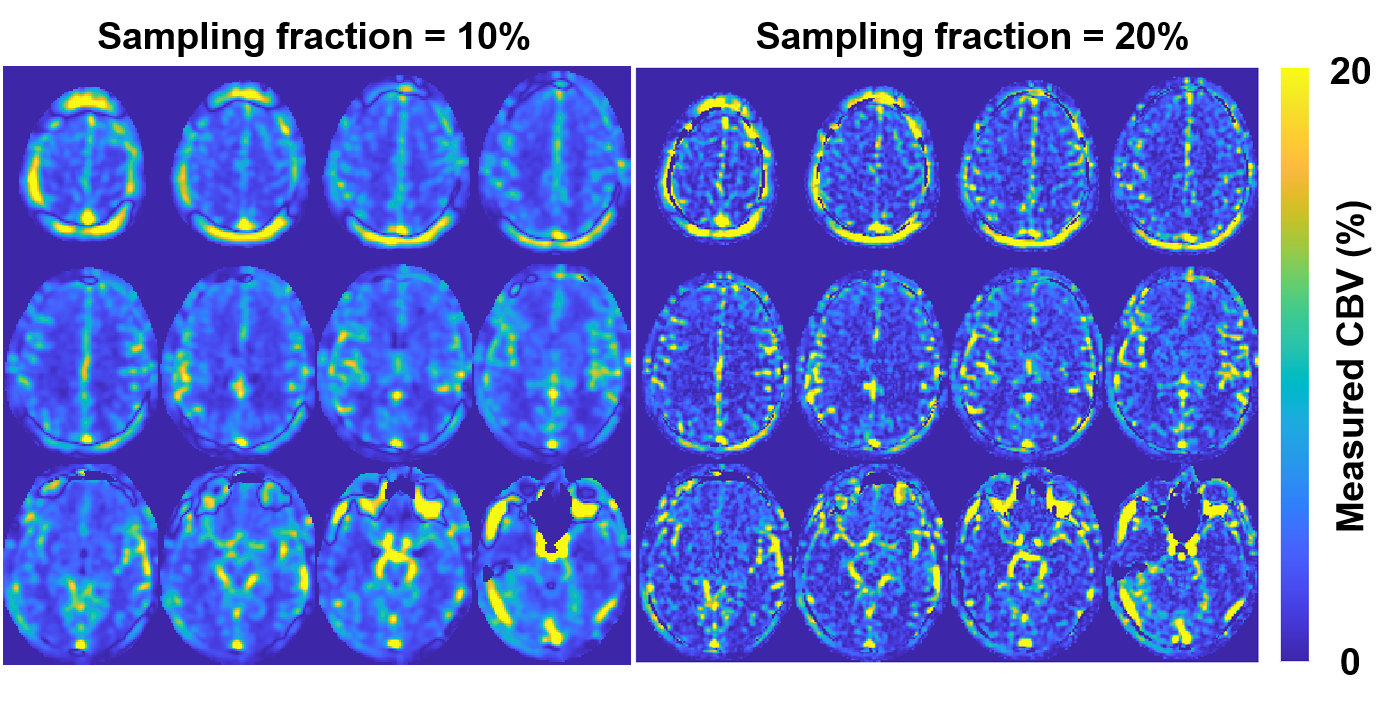
The CBV map from a normal volunteer are shown on Figure 2. The CBV values were found with a mean value of 3.7% and 1.8% for GM and WM, respectively. The quantitative results aligned with results from a previous study on dynamic susceptibility contrast (DSC) MRI [4]. Deep gray matter and white matter could be visualized with sufficient, although low, SNR and contrast.
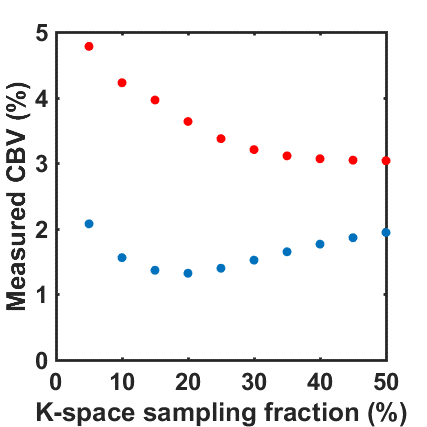
Figure 3 denotes the CBV values from images reconstructed with varying degree in blurring. The resultant GM CBV’s increased dramatically with k-space smoothing, which might be caused by partial volume effect from large vessels. On the other hand, WM CBV’s were found to be slightly decreased with k-space smoothing, but the values increased at a relatively low effective resolution.
Discussion and conclusions
This study suggests that 3D VS-ASL radial acquisition is feasible for obtaining CBV map. However, some limitations exist. First, 3D radial gradient echo imaging offers benefits of insensitive to flow velocity and data inconsistencies from motion. However, requires long acquisition time for achieving sufficient SNR. Second, ASL CBV measurement were found to be dependent on resolution, an optimized sampling resolution is desirable for CBV mapping in achieving proper SNR but minimizing partial volume effect. Therefore, we conclude that uncertainties in quantitative CBV measurement remained an issue and requires further investigation.Acknowledgements
No acknowledgement found.References
- Wong EC, et al. Velocity selective arterial spin labeling. Magn Reson Med 2006;55:1334–1341.
- Liu D, et al. Quantitative measurement of cerebral blood volume using velocity-selective pulse trains. Magn Reson Med 2017;77: 92-101.
- Guo J, et al. An optimized design to reduce Eddy current sensitivity in velocity-selective arterial spin labeling using symmetric BIR-8 pulses. Magn Reson Med 2015;73:1085-1094.
- Bjørnerud A, et al. A fully automated method for quantitative cerebral hemodynamic analysis using DSC-MRI. J Cereb Blood Flow Metab 2010;30:1066–1078.
Figures