1886
Evaluation of cerebral perfusion changes using arterial spin labeling after carotid endarterectomy1Peking University Third Hospital, Peking, China
Synopsis
Carotid endarterectomy (CEA) is a common surgical method for patients with significant carotid stenosis. The evaluation of perioperative cerebral perfusion is extremely important to evaluate the efficacy of CEA. It can provide information of both the etiology of stroke due to carotid stenosis and cerebral hemodynamic changes after CEA.[1] Arterial spin labeling (ASL) is a magnetic resonance imaging (MRI) technique that uses the protons of arterial blood water molecules as endogenous tracers to evaluate cerebral blood flow (CBF) noninvasively and repeatedly.[2] Territorial ASL (t-ASL), a modified ASL technique, allows independently labeling a single brain-feeding artery to visualize its cerebral blood perfusion territory. [3] Therefore, we supposed that ASL techniques have ability to provide more information for the evaluation of cerebral perfusion changes pre- and post- CEA.
Purpose
To evaluate the ability of ASL techniques including 3D arterial spin labeling (3D ASL) and territorial arterial spin labeling(t-ASL) to evaluate the perioperative cerebral perfusion before and after CEA.Methods and Materials
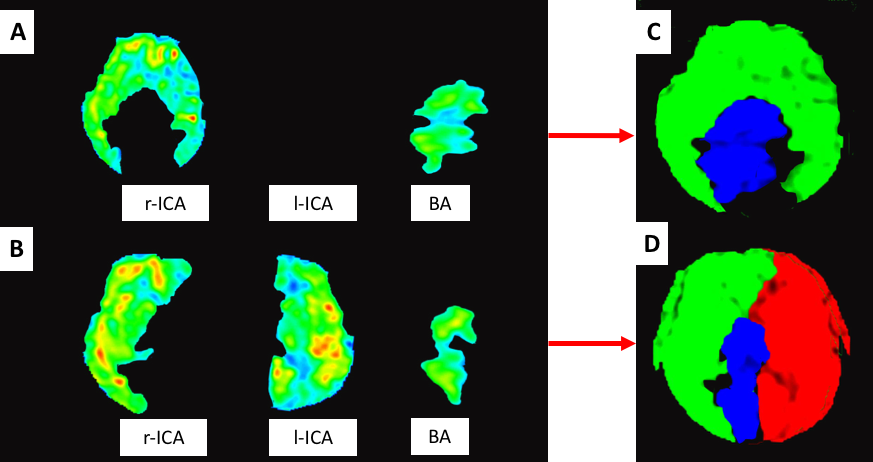
1.Fifteen patients diagnosed as carotid artery stenosis and scheduled for CEA were recruited (mean age 66.00±4.19y, 11males, 4 females). 2. MR imaging was performed with a 3.0T MR system about 1 week before and after CEA respectively. 3.Cerebral perfusion territory maps were obtained by labeling bilateral internal carotid arteries and basilar artery using a kind of territorial-ASL(super-selective ASL). These images were then combined into 3-colored territorial CBF maps [Figure 1]. The post-labeling delay of both 3D ASL and t-ASL before and after CEA is 2000 ms. 4. CBF values were measured respectively in the same position of affected side and the other side before and after surgery. 5. To assess the changes in CBF after CEA(ΔCBF), we calculated the following difference: ΔCBF=CBFpostCEA - CBFpreCEA.Results
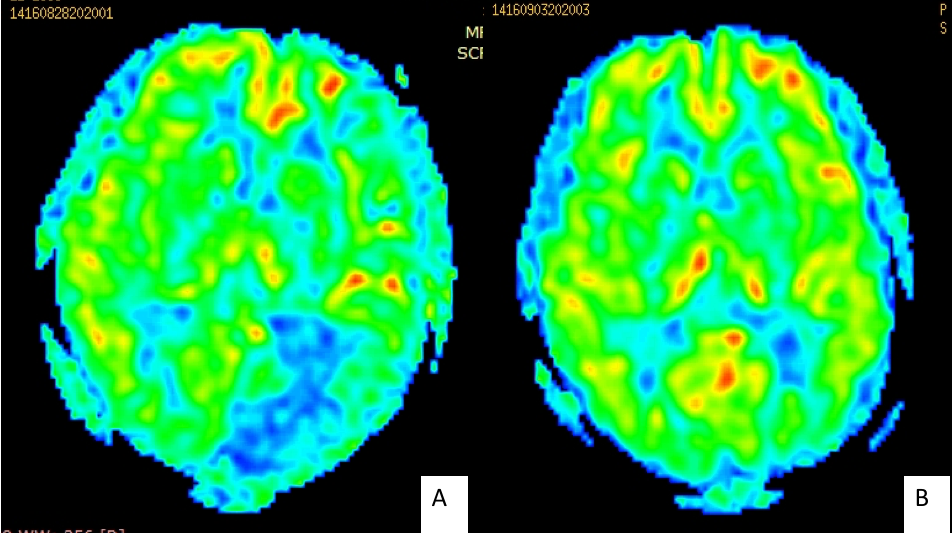
1. The CBF values of both the affected sides and contralateral sides were increased after CEA [Figure 2]. Before: affected side: 38.70±12.77mL/100 g/min, the other side: 42.28±11.59mL/100 g/min. After: affected side:53.08±11.59mL/100g/min, the other side: 52.64±11.17mL/100 g/min. There were significant differences of CBF values between twice scanning (affected side:P=0.011; the other side: P=0.018). 2. The contribution to perfusion in the hemisphere via the collateral circulation is reduced after CEA.Conclusions
1.CBF values detected by 3D ASL increased after CEA. Patients with greater perfusion deficits prior to CEA have greater improvement in perfusion after CEA. 2. tASL has potential to demonstrate the relative role of collateral pathways before sugery and redistribution of blood flow after surgery. Therefore, as noninvasive tools, ASL techniques have the ability to both quantitatively and qualitatively evaluate the hemodynamic status before and after CEA.Acknowledgements
NoReferences
1. Hosoda K. The Significance of Cerebral Hemodynamics Imaging in Carotid Endarterectomy: A Brief Review. Neurol Med Chir (Tokyo) 2015; 55:782–788.
2. Akash P. Kansagra, Eric C. Wong. Quantitative assessment of mixed cerebral vascular territory supply with vessel encoded arterial spin labeling MRI. Stoke 2008; 39:2980-2985.
3. Yamamoto D, Hosoda K, Uchihashi Y, Kohmura E. Perioperative Changes in Cerebral Perfusion Territories Assessed by Arterial Spin Labeling Magnetic Resonance Imaging Are Associated with Postoperative Increases in Cerebral Blood Flow in Patients with Carotid Stenosis. World Neurosurg 2017; 102:477-486.
Figures