1885
Automatic carotid vessel wall assessment based on a combined analysis of TOF-MR angiography and MSD T2-weighted MRI sequences1Cardiovascular Research and Development, Fraunhofer MEVIS, Berlin, Germany, 2Institute for Computational and Imaging Science in Cardiovascular Medicine, Charité - Universitaetsmedizin Berlin, Berlin, Germany, 3Dept. of Radiology Medical Physics, University Medical Center Freiburg, Freiburg, Germany, 4Neurology and Clinical Neurophysiology, University Medical Center Freiburg, Freiburg, Germany, 5Cardiovascular Research and Development, Fraunhofer MEVIS, Bremen, Germany
Synopsis
The quantitative analysis of vessel wall thickness in the carotid bifurcation region based on blackblood MR imaging is a difficult problem because of partial volume effects, strong variations in surrounding tissue contrast, and flow artifacts, which frequently appear in the carotid bulbus. The abstract presents an automatic vessel wall thickness quantification approach based on a segmentation that integrates the information from a TOF-MRA sequence and a MSD-T2-weighted variable flip angle 3D MRI sequence without changing the image data.
The method is validated using a crossection-wise comparison with contours corrected by 6 different observers on 60 vessel crossections.
The results show a good overall agreement. Major deviations between observers and automatic segmentation occur in regions with strong artefact.
Introduction
The quantitative analysis of vessel wall thickness in the carotid bifurcation region based on blackblood MR imaging is a difficult problem because of partial volume effects, strong variations in surrounding tissue contrast, and flow artifacts, which can appear in the carotid bulbus. There exist different approaches for enhancing the imaging techniques1,2, but recently published segmentation approaches still suggest the combination of different sequences in the segmentation task to achieve robust results3,4. However, the image registration applied to this end changes the input data and thereby the quantitative results.
The purpose of this work is to achieve a robust automatic quantification of vessel wall thickness based on a segmentation approach that integrates the information from a TOF-MRA sequence and a MSD-T2-weighted MRI sequence on without changing the image data. The vessel wall detection uses an intensity-profile analysis guided by the vessel centerline.
Method
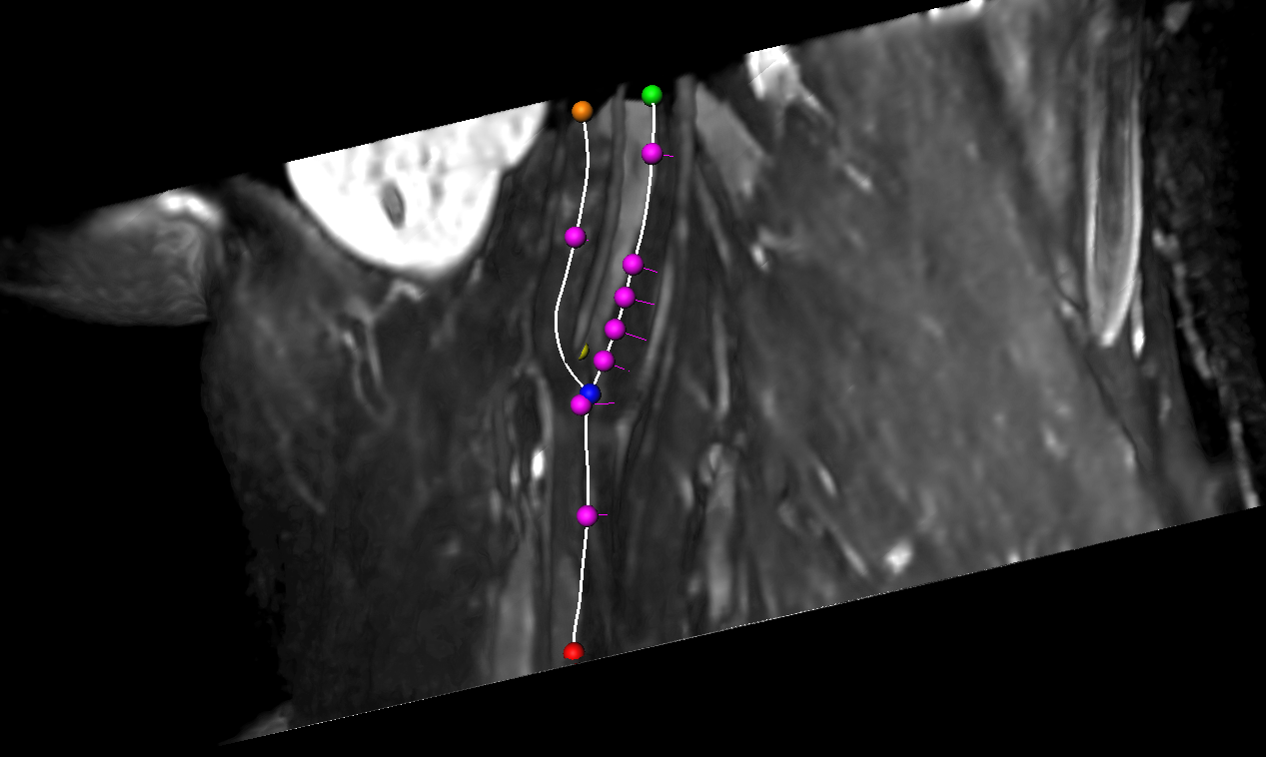
The vessel wall detection starts with the semi-automatic lumen centerline using a shortest path algorithm in a cost image with user-defined markers. Along the course of the centerline cross section diameters are calculated4. Via the flow diverter location the positions of crossections in TOF and MSD-T2-weighted sequences can be co-registered. The vessel wall analysis in the blackblood sequence inspects gradient profiles $$$I_{i,r}$$$ and $$$G_{i,r}$$$ along rays $$$i$$$, where $$$r$$$ is the radial distance from the centerline. For each point the cost $$$c_{i,r}$$$ of belonging to the lumen contour is
$$c_{i,r}= {min}_{s}\left(α \frac{G_{i,r}}{r}+\beta(r-s)^2+\gamma(r-r_e)^2-c_{i-1,s}\right)$$
where $$$s$$$ is the radius on ray $$$i-1$$$, $$$r_e$$$ is the radius estimation from the TOF image, and $$$\alpha,\beta,\gamma$$$ control the influence of the data term, the contour smoothness and the preliminary radius estimate. For the vessel wall, the minimization scheme is similar with a negative gradient. To incorporate 3D information the radius is a weighted average of its neighbours along the vessel.
Validation
Data: Datasets from eight subjects were acquired with a Siemens Prisma 3T scanner. The 3D TOF MRI datasets have a voxel size of 0.3125x0.3125x0.6mm3, black blood image volumes were acquired with a T2-weighted variable flip angle turbo spin echo 3D sequence with motion sensitized driven equilibrium with a voxel size of 0.3x0.3x0.6mm3.
Validation: To assess the accuracy of the automatic vessel wall extraction, in all datasets crossections have been placed at characteristic locations around the carotid bifurcation as shown in Figure 1. The result of the automatic segmentation as described in Section 2 was presented to six observers on a subset of 60 crossections. Every observer assessed 30 crossections, so that for all 60 planes corrections from three observers are available. For the lumen contour as well as the outer vessel contour agreement was calculated using Dice coefficient an maximal minimal contour point distance.
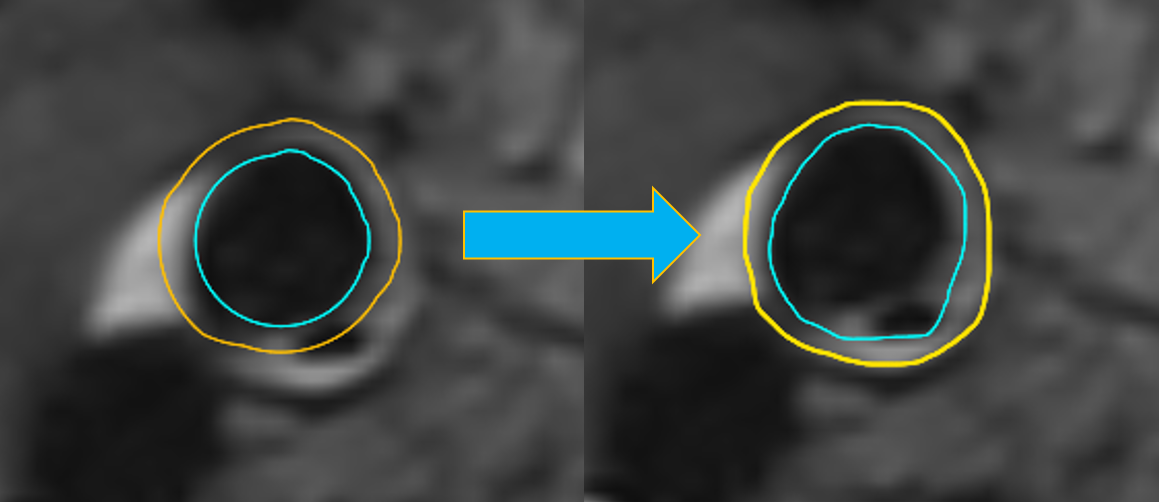
Results: The average Dice coefficient was 0.95 with a standard deviation of 0.14 for the lumen and 0.97 ($$$\pm$$$0.05) for the wall contour. The Hausdorff distance was 0.35mm ($$$\pm$$$ 0.51) and 0.55mm ($$$\pm$$$ 0.59) which is below the voxel dimensions. The least agreement was achieved for cross-section 4 of the right carotid artery of volume 1 (see Fig. 4).
Discussion and Conclusions
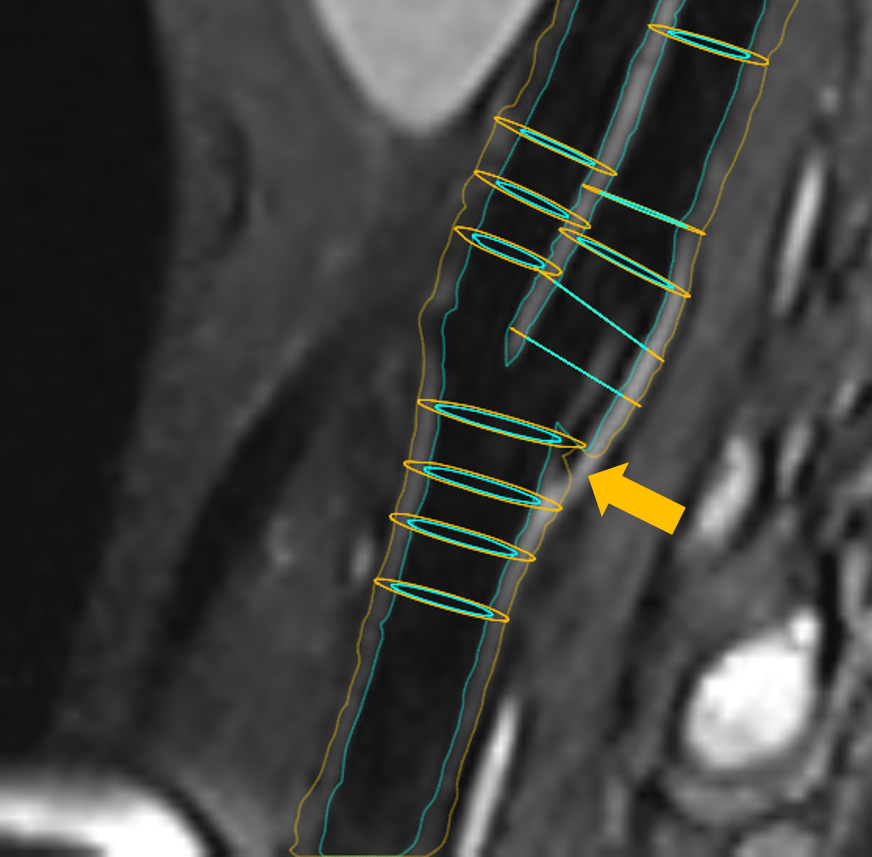
Dice coefficient and contour distance indicated a good performance for almost all inspected crossections. Outliers occured in cases where artefacts were misinterpreted by the algorithm as displayed in Figure 2 and 4. In future work we will compare the performance of the algorithm on different MR sequences with additional artifact suppression strategies. Furthermore, we will address the validation of the quantification on patient data.
Acknowledgements
We would like to thank our collegues from the Institute for Imaging Science and Computational Modelling in Cardiovascular Medicine for their support with validation of the segmentation.References
- Wang J, Yarnykh VL, Hatsukami T, Chu B, Balu N, Yuan C. Improved suppression of plaque-mimicking artifacts in black-blood carotid atherosclerosis imaging using a multislice motion-sensitized driven-equilibrium (MSDE) turbo spin-echo (TSE) sequence. Magn Reson Med. 2007 Nov;58(5):973-81. PubMed PMID: 17969103.
- Li L, Chai JT, Biasiolli L, Robson MD, Choudhury RP, Handa AI, Near J, Jezzard P. Black-blood multicontrast imaging of carotid arteries with DANTE-prepared 2D and 3D MR imaging. Radiology. 2014 Nov;273(2):560-9.
- Gao S, van 't Klooster R, Kitslaar PH, Coolen BF, van den Berg AM, Smits LP, Shahzad R, Shamonin DP, de Koning PJH, Nederveen AJ, van der Geest RJ. Learning-based automated segmentation of the carotid artery vessel wall in dual-sequence MRI using subdivision surface fitting. Med Phys. 2017 Oct;44(10):5244-5259
- Arias-Lorza AM, Petersen J, van Engelen A, Selwaness M, van der Lugt A, Niessen WJ, de Bruijne M. Carotid Artery Wall Segmentation in Multispectral MRI by Coupled Optimal Surface Graph Cuts. IEEE Trans Med Imaging. 2016 Mar;35(3):901-11
- Kaufhold L, ..., Hennemuth A. Image-based assessment of uncertainty in carotid lumen quantification. SPIE Medical Imaging 2018, to appear
Figures