1884
Clinical application of QSM sequence in cerebral microbleeds of patients with essential hypertension1Department of Radiology, Affiliated Hospital of Inner Mongolia Medical University, Hohhot, China, 2GE Healthcare, China, Beijing, China
Synopsis
QSM sequence can quantitativeaccess tissue magnetic susceptibility, and applied to understand the distribution of iron content in the cerebral microbleeds. In the study, 3.0T MRI was applied to investigate intracerebral micro-hemorrhage in 33 patients with essential hypertension. QSM sequence was also adminstrated to quantitatively analyze the magnetic susceptibility of CMBs in hypertensive patients. The resultes indicated a significant difference between the magnetic susceptibility of the lesions in the basal ganglia and that of the lesions in the subcortical and infratentorial regions, respectively. Moreover, there was a positive correlation observed between the lesion area and the susceptibility value in each region.
Purpose
To measure the rate of magnetic susceptibility using MRI with QSM sequence and to explore its clinical application value on investigating the micro-hemorrhagic focus in patients with essential hypertension.Introduction
Hypertension is an independent risk factor for cerebral microbleeds (CMBs). CMBs itself will not induce clinical symptoms, however, it is occasionally associated with the occurrence of hypertensive intracerebral hemorrhage. Focal deposition of iron ions in CMBs may lead to damages on vascular walls. Plenty of previous studies have demonstrated that tissue magnetic susceptibility quantitatively reflects the concentration of iron in tissues. QSM sequence has been applied to measure the magnetic susceptibility of micro-hemorrhagic lesions in the brain and provided a feasible method for understanding the content of iron in the brain. Thus, the current study aimed to investigate its application on patients with hypertension.Material and Methods
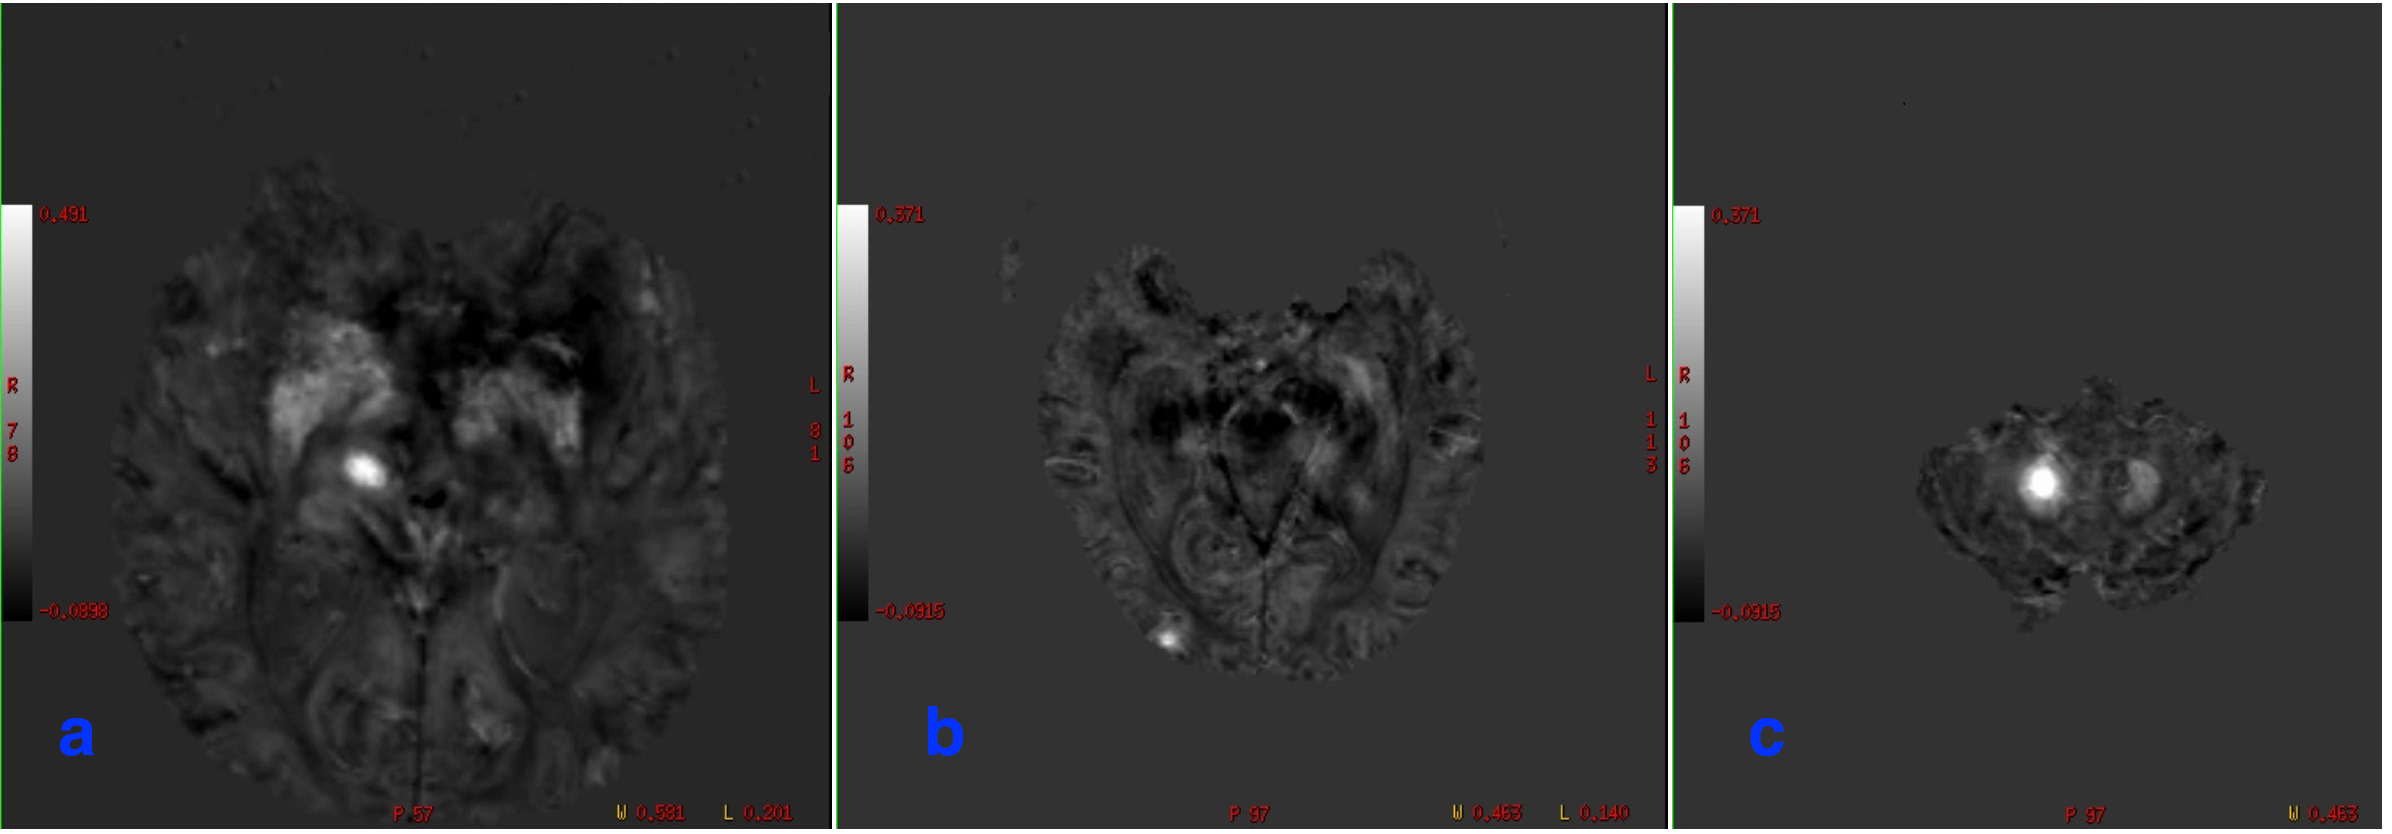
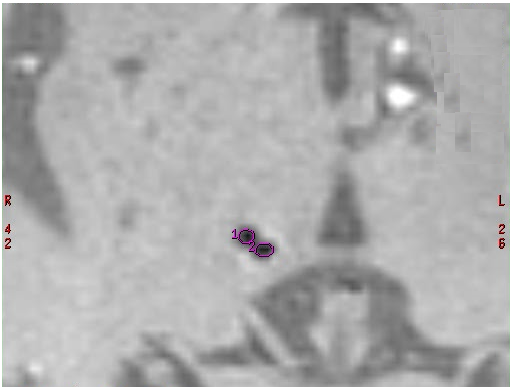
33 essential hypertension (EH) patients with CMBs underwent MR acquision with 3D multi-gradient-echo sequence on a 3.0T magnetic resonance system(MR750, GE, Milwaukee, WI, USA), and then caculated the QSM by QSM-fuctionTool software installed on AW4.6 workstation(GE, Milwaukee, WI, USA). The cerebral region was divided into three regions as cortical – subcortical(Figure 1.a), basal ganglia – thalamic(Figure 1.b), and below the tentorium(Figure 1.c). The spatial distribution of susceptibility of CMBs was measured for each cerebral region. The relationship between CMBs susceptibility value and lesion area was analyzed on the amplitude QSM(Figure 2).Results
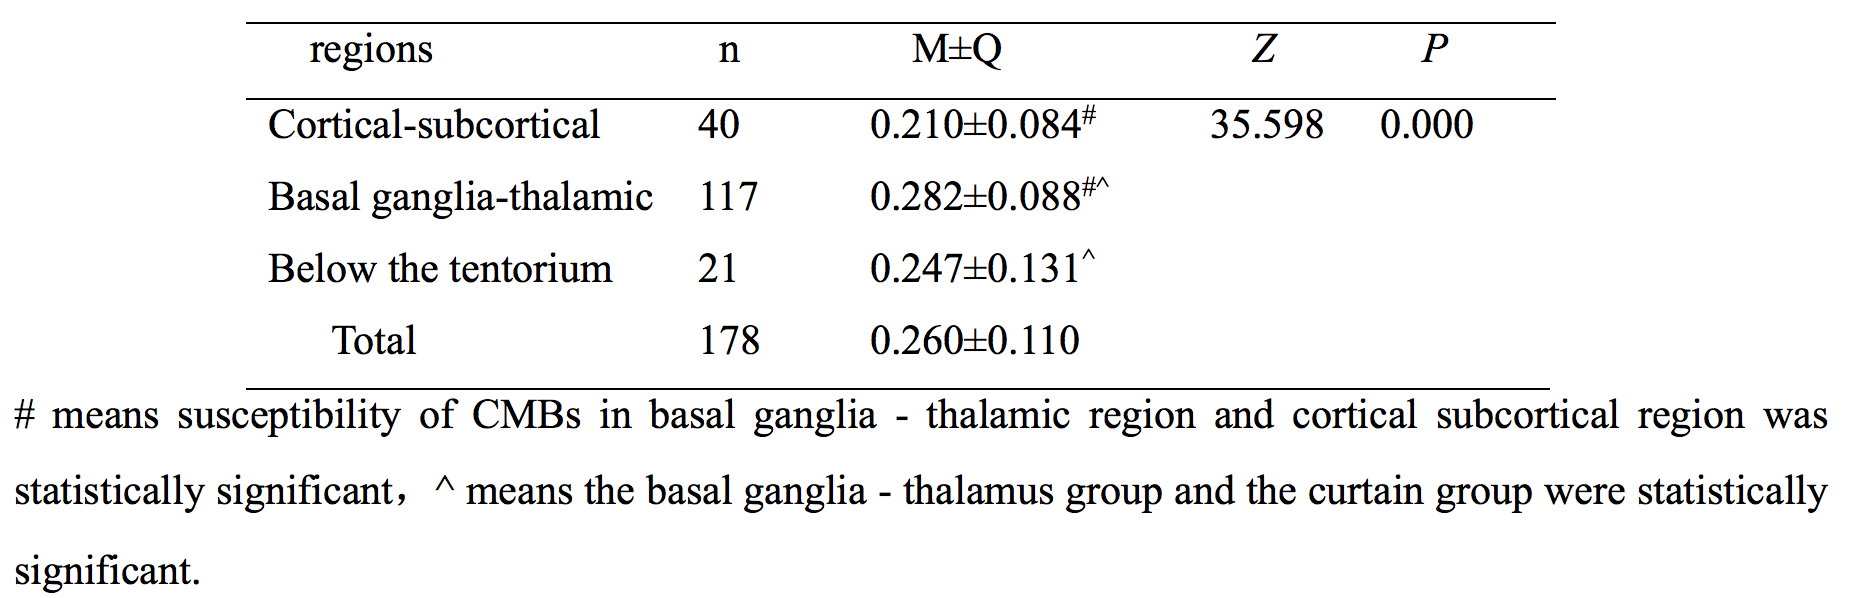
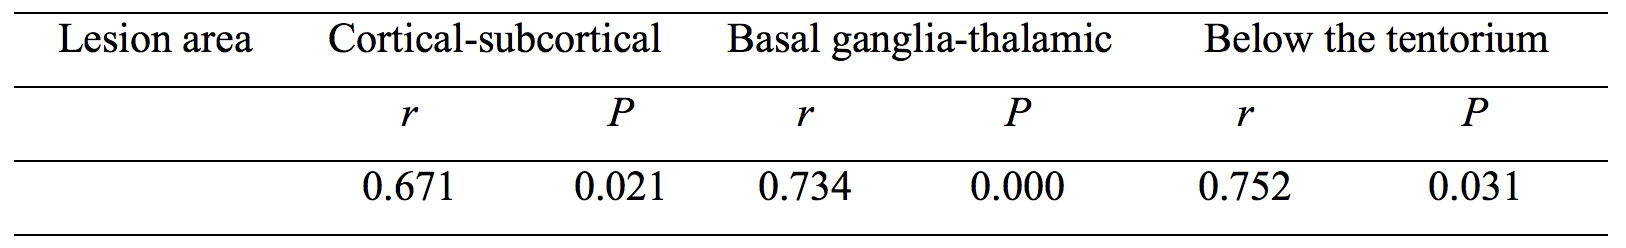
Results The magnetic susceptibility values of CMBs in the basal ganglia-thalamic regions were statistically different from those in the cortex-subcortex (P <0.05) and the infratentorial regions (P <0.05), respectively. There was no observed significant difference in magnetic susceptibility between the lower and inferior regions (Table 1). Moreover, a positive correlation was detected between the area of CMBs lesions and the corresponding susceptibility values at each site (Table 2).Conclusion
QSM sequence can quantitatively reflect tissue magnetic susceptibility. The distribution of magnetic susceptibility of CMBs demonstrated regularity to some extent in the brain of patients with essential hypertension, whichprovided noninvasive imaging data for further understanding the evolution of CMBs.Acknowledgements
No acknowledgement found.References
[1]Yates P A, Villemagne V L, Ellis K A, et al. Cerebral Microbleeds: A Review of Clinical, Genetic, and Neuroimaging Associations[J].Front Neurol,2014,6(4):205.
[2]Jeon S-B, Kang D-W, Cho A-H, Lee E-M, Choi CG, Kwon SU, et al. Initial microbleeds at MR imaging can predict recurrent intracerebral hemorrhage. J Neurol (2007) 254:508–12.
[3]Meike W. Vernooij. Cerebral microbleeds: do they really predict macrobleeding?Int J Stroke. 2012 Oct;7(7):565-6.
[4]Poels MM, Vernooij MW, Ikram MA, Hofman A, Krestin GP, van der Lugt A, Breteler MM. Prevalence and risk factors of cerebral microbleeds: an update of the Rotterdam Scan Study. Stroke. 2010;41:S103–S106.
[5] Cordonnier C, Potter GM, Jackson CA, Doubal F, Keir S, Sudlow CL, Wardlaw JM, AlShahi Salman R: Improving interrater agreement about brain microbleeds: development of the Brain Observer MicroBleed Scale (BOMBS). Stroke 2009;40:94–99.
Figures