1878
Ultra-High resolution SWI at 3T1Center of neuroscience and rregenerative medicine, Henry Jackson Foundation, Bethesda, MD, United States, 2Department of Radiology, National institute of Health, Bethesda, MD, United States
Synopsis
Susceptibility weighted imaging (SWI) uses phase and magnitude data to increase the conspicuity of sources such as blood vessels and hemorrhages. Typical resolution used in clinical SWI are approximately 0.5-1 mm in-plane and 1-2 mm through plane. Higher resolution has been achieved using 7.0 T MRI, but such units have limited availability. In this work, we generated ultra-high resolution (400 µm isotropic) SWI at 3.0 T using registration and averaging.
Introduction:
Susceptibility weighted imaging (SWI) uses phase and magnitude data to increase the conspicuity of sources such as blood vessels and hemorrhages. Typical resolution used in clinical SWI (at fields up to 3.0 T) are approximately 0.5-1 mm in-plane and 1-2 mm through plane1. Higher resolution has been achieved using 7.0 T MRI, but such units have limited availability. In this work, we generated ultra high resolution (400 µm isotropic) SWI at 3.0 T. To do so, we imaged for up to 40 minutes using multiple, noisy 3D multishot (segmented) echo planar imaging (EPI) sequences with high acceleration, and combined the images in post-processing.Methods:
Subjects: Ten volunteers were scanned on a 3.0 tesla Philips Achieva (software version r 5.3.0.0) using a 32-channel head coil under an IRB approved protocol.
MRI method: Sagittal 3D multishot (segmented) EPI2. 120 sec volume acquisition time, volume repeated 20 times for total scan time 40 minutes.
Contrast parameters: TR=60, TE=29, FA=180, BW= 253 Hz. Acceleration factors: ETL=15. 3x SENSE in phase, 3xSENSE in slice
Geometric parameters: 256mm FOV, 640×640 matrix, 0.4 mm slice thickness (461 slices) for an acquired isotropic 400 µm resolution. Total slices were 463, resulting in an acquisition time of 120 seconds.
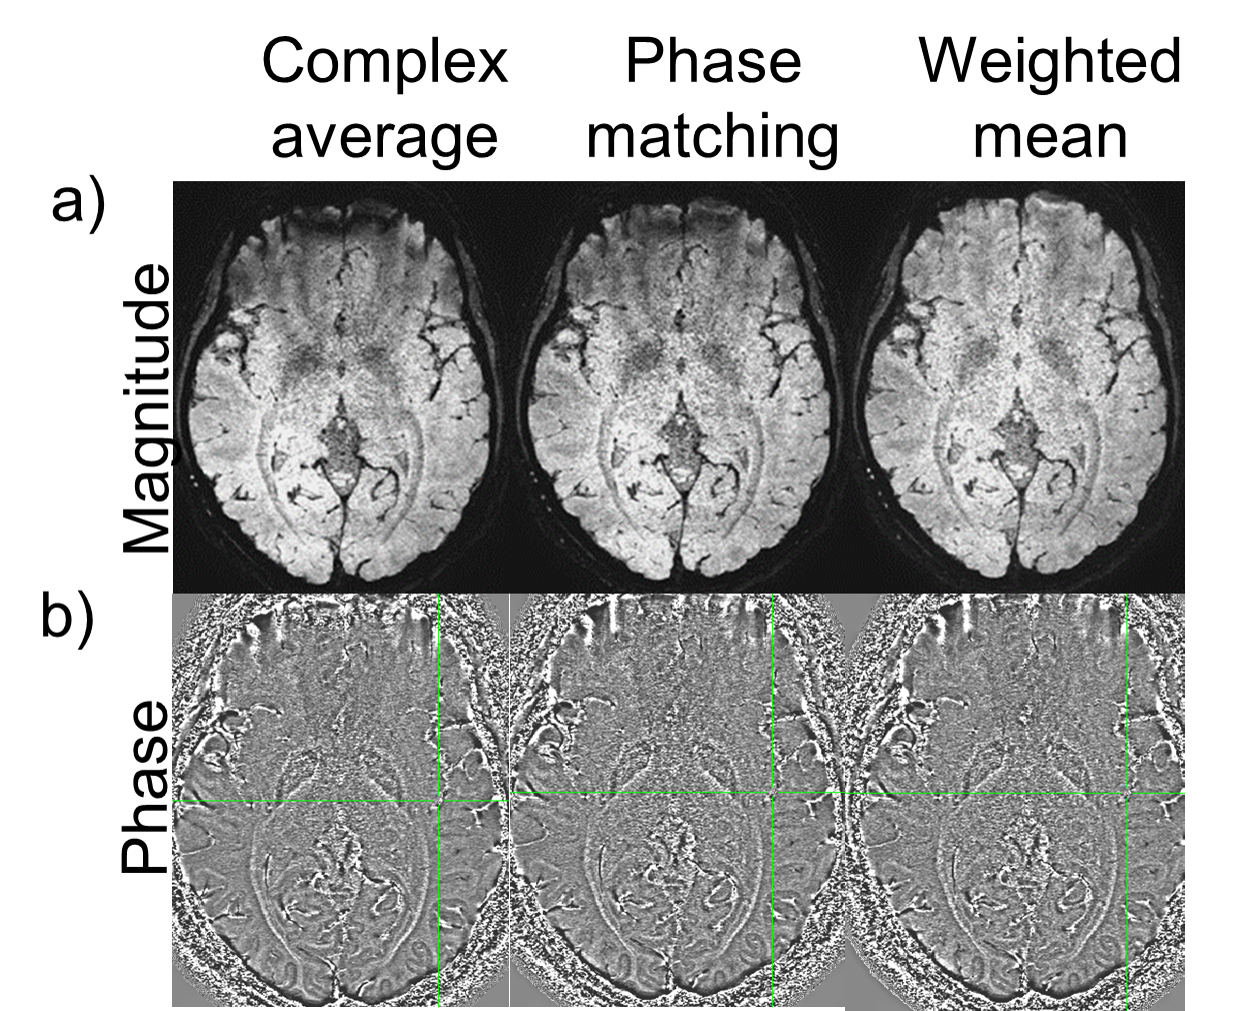
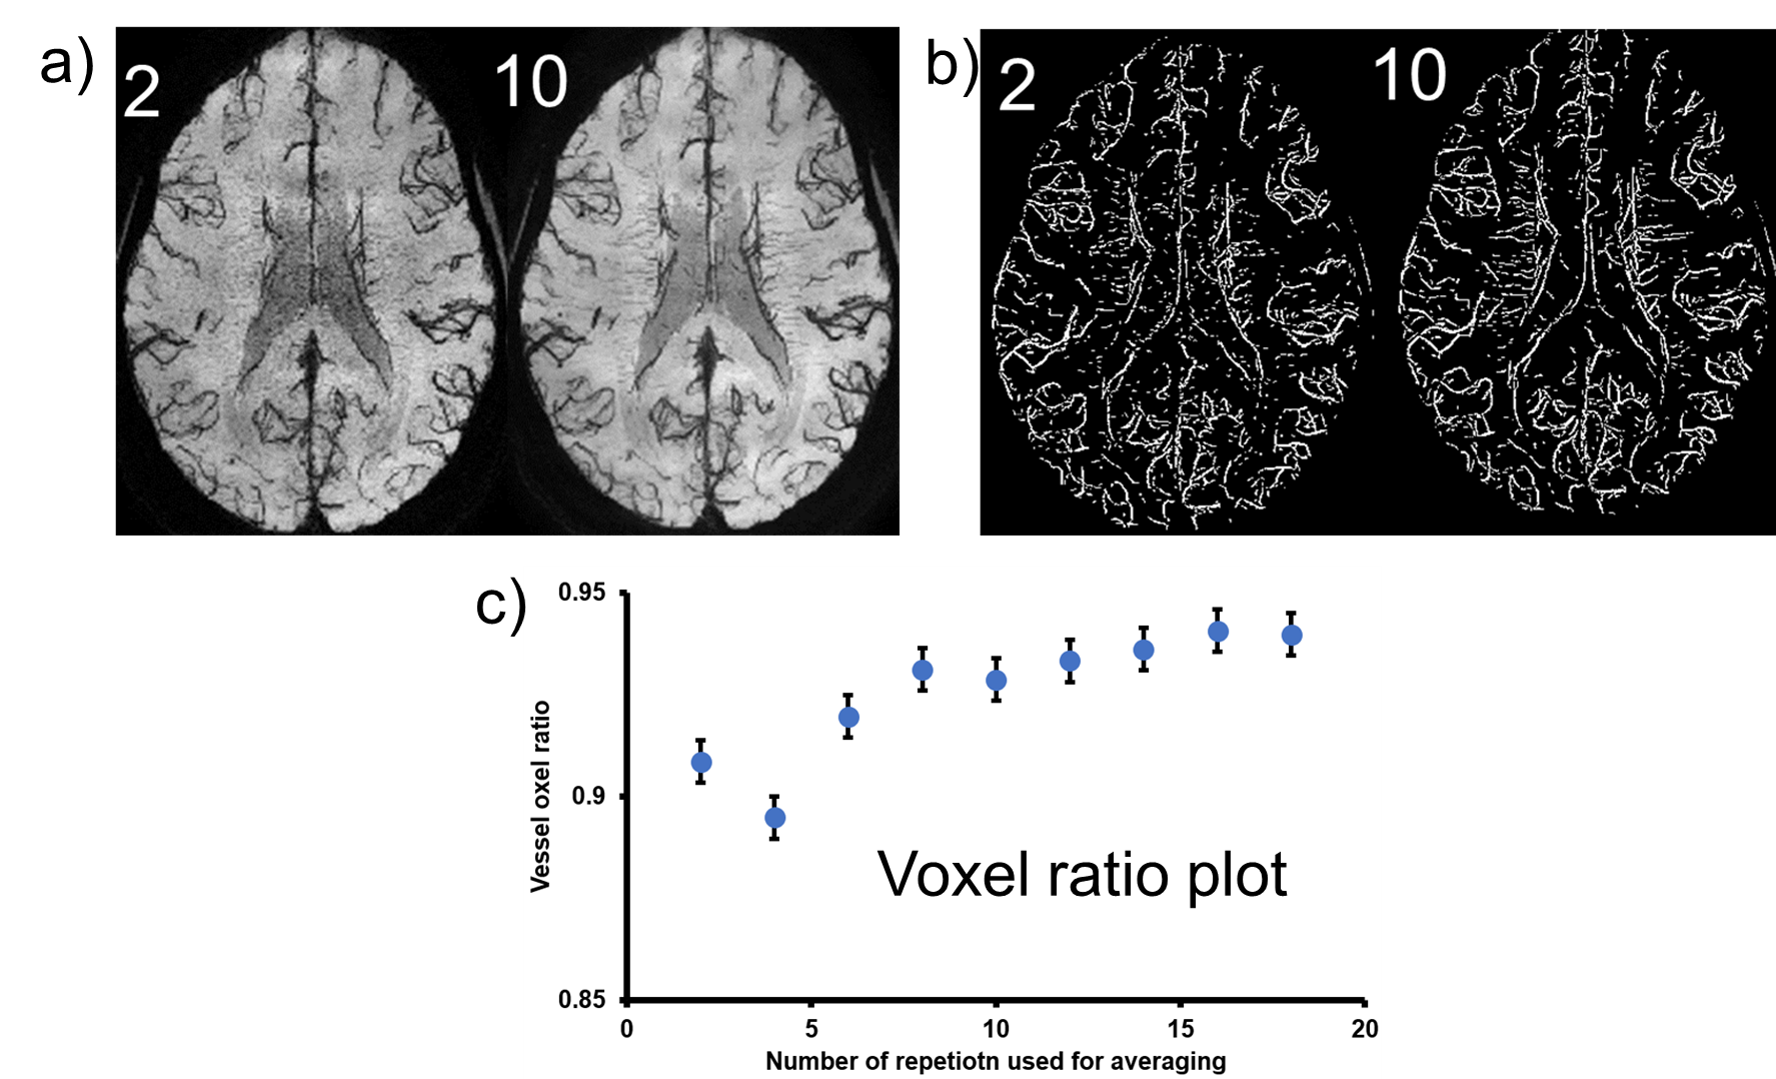
Analysis: To combine the multiple acquisitions, the magnitude images were co-registered to the first volume (FSL FLIRT)3, and the transform was applied to the real and imaginary data. The repeat scans were combined using 3 different methods described below. To evaluate the number of repetitions required to obtain reasonable image quality, we varied the total repetitions used in the combination from 2 to 20, with an increment of 2. Magnitude and Phase combination techniques 4,5: i) complex domain average: real and imaginary parts were averaged, and then magnitude and phase was generated from this average data. ii) Phase matching: phase was calculated from a reference region in the first volume and the phase from the same region in subsequent repetitions were matched to the reference phase. Magnitude and phase was calculated from averaged complex data. iii) Weighted mean: for the magnitude component, the sum of squares of the magnitude from each repeat scan resulted in an average magnitude. For each repetition, a reference phase was subtracted from the phase images such that the phase at center of the image is zero. Then, the phase images were combined using a weighted average, where weights depended on the magnitude of each repetition. To assess vessel conspicuity, we generated a voxel count based on previous work by Coye6. A vessel voxel ratio was also calculated for each average, defined as the ratio of voxels within the average vessel mask, to the number of voxels in the vessel mask from all 20 image.
Results:
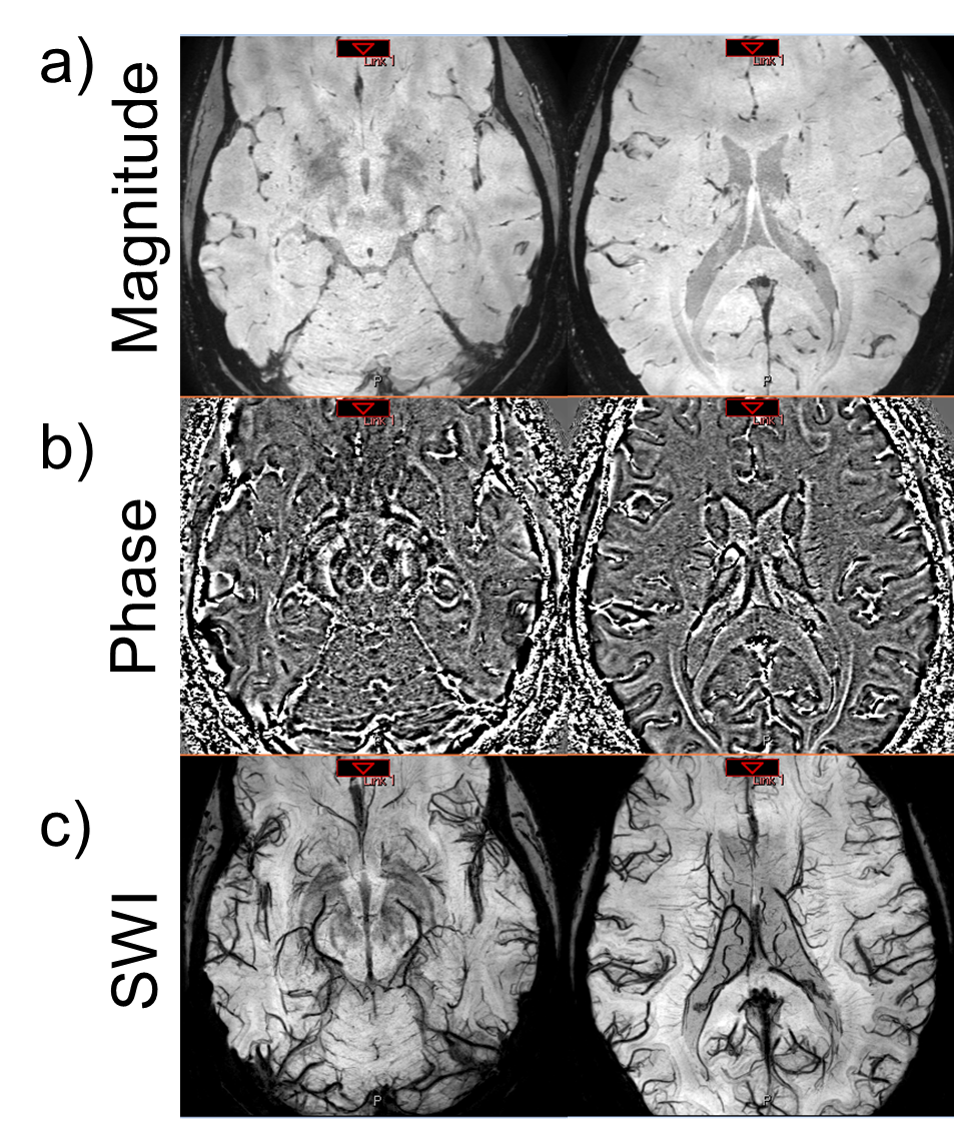
Figure 2 shows the results of a magnitude image generated from the 3 methods. When averaging was performed in the complex domain we observed an artifact in the area near sinuses in the generated magnitude. This artifact could be attributed to a compound effect of misalignment of rapidly changing phase wraps between repetitions. The artifact is not present using the weighted-mean combination. Figure 2 shows the magnitude, phase, and SWI generated by the weighted mean method. A 10mm minimum intensity projection (minIP) demonstrates the conspicuity of micro vasculature (Figure 2c). We evaluated the effect of the number of averages on the quality of SWI images (Figure 3). We also examined the changes in vessel voxel information. The minimum intensity projection (minIP) images of the magnitude averaged using 2 and 10 repetitions are shown in Figure 3a). As the number of images used for averaging increases, the visibility of vasculature also increases. The vessel masks generated are shown in Figure 3b) and Figure 3c) shows the plot of vessel voxel ratio vs number of repetitions used for averaging. In general, there is an increasing trend in the voxel ratio with increasing number of repetitions for averages that flattens out after 8 repetitions.
Discussion & conclusion:
In this article, we describe an approach for acquiring ultra-high resolution (400 µm isotropic) SWI images on widely available 3 tesla scanners. High quality, high SNR images were generated. Our results indicate that high quality images could be acquired by combining a series of low SNR scans in 16 minutes or less. A weighted-mean phase combination provided images with the fewest artifacts. Furthermore, by breaking up the long acquisition scan into short scans, we are effectively reducing the amount of motion artifact being induced during each scan and removing the need additional post processing steps to correct itAcknowledgements
This work was supported by the Center for Neurodegeneration and Regenerative Medicine(CNRM) within the auspices of the Department of Defense (DoD) and the Henry Jackson Foundation (HJF) grant number 307513‐5.01‐60855, and by the Intramural Research Program (IRP) of the Clinical Center of the National Institutes of Health (NIH).References
1) Nair, Jaykumar Raghavan, et al. "High-resolution susceptibility-weighted imaging at 3 T with a 32-channel head coil: technique and clinical applications." American Journal of Roentgenology 195.4 (2010): 1007-1014.
2) Sati, P., et al. "Rapid, high-resolution, whole-brain, susceptibility-based MRI of multiple sclerosis." Multiple Sclerosis Journal 20.11 (2014): 1464-1470.
3) Fischer, Bernd, and Jan Modersitzki. "FLIRT: a flexible image registration toolbox." International Workshop on Biomedical Image Registration. Springer, Berlin, Heidelberg, 2003.
4) Robinson, Simon Daniel, et al. "An illustrated comparison of processing methods for MR phase imaging and QSM: combining array coil signals and phase unwrapping." NMR in Biomedicine 30.4 (2017). 5) Hammond, Kathryn E., et al. "Development of a robust method for generating 7.0 T multichannel phase images of the brain with application to normal volunteers and patients with neurological diseases." Neuroimage 39.4 (2008): 1682-1692.
6) Coye, Tyler (2015). A Novel Retinal Blood Vessel Segmentation Algorithm for Fundus Images (http://www.mathworks.com/matlabcentral/fileexchange/50839), MATLAB Central File Exchange.[10/01/2017].
Figures