1877
QSM in stroke: Veins, Tissue and Cerebral Microbleeds1Biomedical Engineering, University of Alberta, Edmonton, AB, Canada, 2Medicine, University of Alberta, Edmonton, AB, Canada, 3Radiology & Diagnostic Imaging, University of Alberta, Edmonton, AB, Canada
Synopsis
We assessed microbleed burden and cerebral oxygenation in veins and tissue in stroke patients by means of Quantitative Susceptibility Mapping (QSM). Results showed significant susceptibility difference for
Introduction
Stroke is the second leading cause of death in the world1. Ischemic stroke accounts for about 80% of all cases1. Recently, Quantitative Susceptibility Mapping (QSM) has been used for examination of cerebral tissue and venous oxygenation2 and to study major veins in traumatic brain injury patients3 and patients with acute middle cerebral artery occlusion (a type of ischemic stroke)4. Although QSM measurements of severe ischemic stroke have been performed, a wider range of stroke severity has not been studied. QSM can give a quantitative measure of brain oxygenation and unlike other MR phase based methods5, is not dependent on the orientation of the blood vessels6. Similarly, cerebral microbleeds (CMBs), prevalent in cerebrovascular diseases, have been examined using QSM, and may enable better quantification of microbleed size and intensity than standard MRI methods such as T2*-weighted and Susceptibility Weighted Imaging (SWI)7-9.
Our purpose was to assess the full value of QSM in ischemic stroke patients, by evaluating tissue and draining veins from stroke and control hemispheres and assessing microbleeds in comparison to standard SWI.
Materials and methods
Patient study: MRI was performed on 45 ischemic stroke patients 30 days after symptom onset from June 2016-June 2017 including the following sequences: DWI, SWI and time-of-flight MR angiography. Seven subjects were chosen for this study based on the inclusion criteria: 1) unilateral stroke; 2) evident hyper/hypo intensities on DWI/ADC images; 3) lesion volume measured on DWI, greater than 8mL. In addition, 10 of the total patients had CMBs, which were also assessed with QSM.
Experiment: All images were acquired on a 3T Prisma Siemens system using the following protocol for three-dimensional SWI: TR/TE=28ms/20ms, flip angle=15°, voxel size=0.68×0.68×2 mm3, number of slices=72, bandwidth=100 Hz/pixel, matrix size=290 × 320.
Data processing and analysis: QSM images were obtained from the raw phase images, using PRELUDE for unwrapping, RESHARP for background field removal (kernel radius = 3mm, Tikhonov regularization parameter=0.001) followed by dipole inversion with Total Variation (TV) regularization (TV parameter =0.0005).
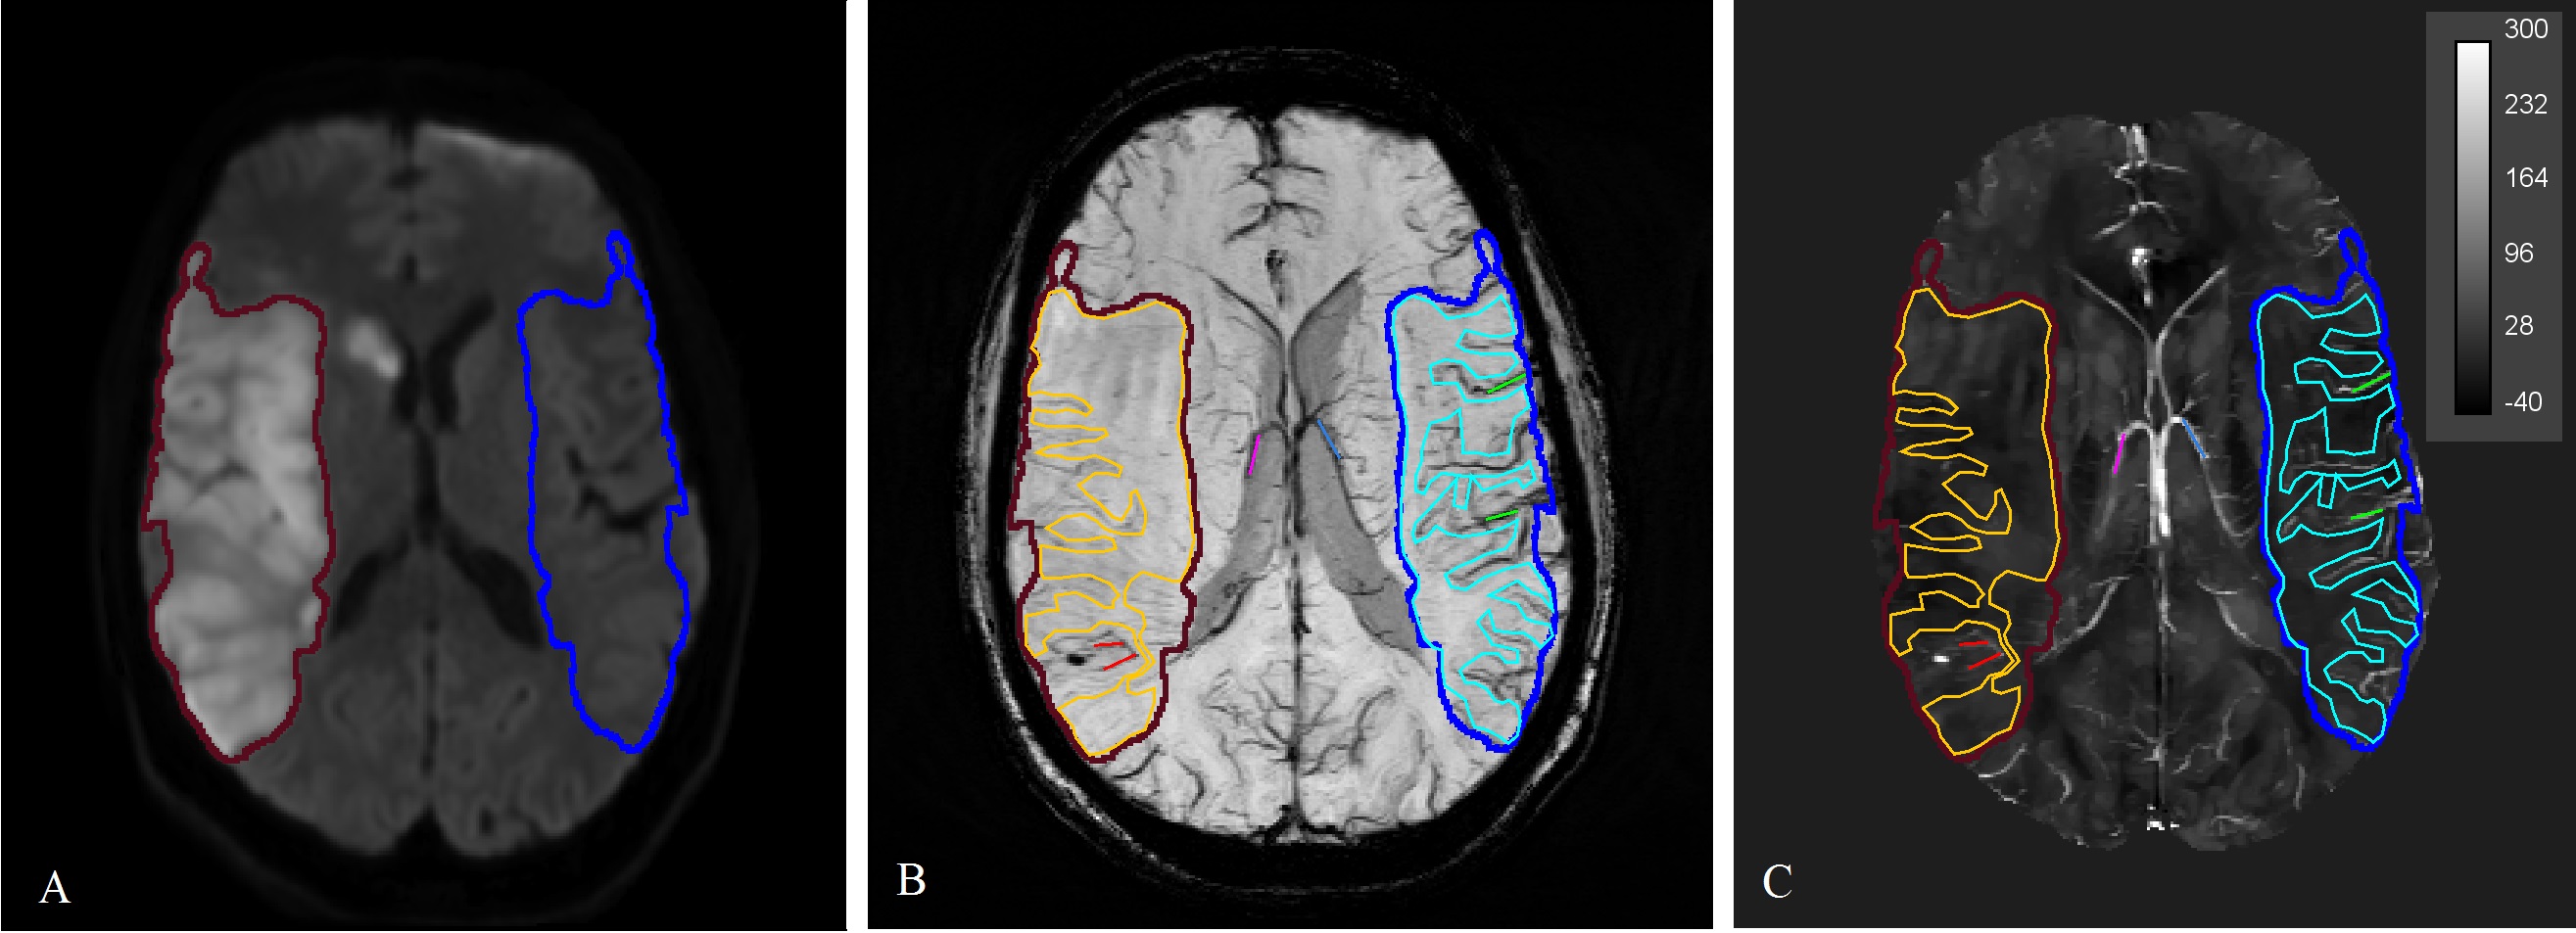
The vein susceptibility measurements were taken from the Maximum Intensity Projection (MIP) QSM over the slices that contained the infarct. For tissue, regions-of-interest (ROIs) were drawn on DWI images in the hemisphere of the infarction and in the contralateral hemisphere and were checked on minimum Intensity Projection (mIP)SWI images to ensure veins did not contribute to the ROI signal. The ROI for major draining veins and local veins within the infarct territory were drawn on SWI images in both hemispheres. Figure 1 shows the infarct on DWI and selected ROIs for tissue, local veins and major veins on QSM.
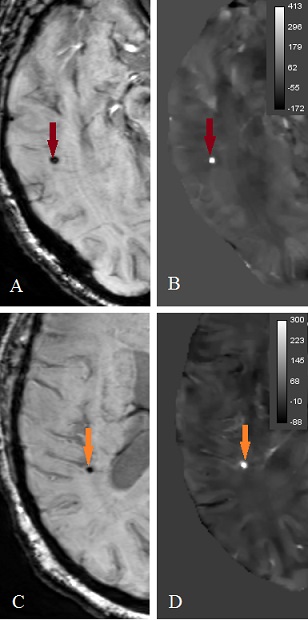
CMBs were defined to be small, oval, hypo-intense/hyper-intense lesions on SWI/QSM images (Figure 2) and their areas were segmented by computing the width at half maximum height along their greatest diameter on twice interpolated images.
Results
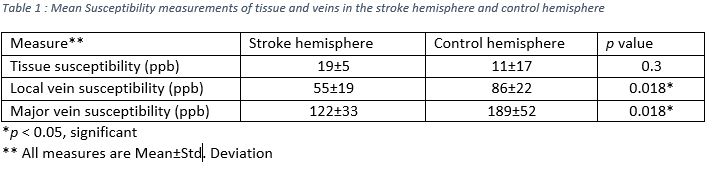
Tissue and veins: Results from all seven subjects for susceptibility measurements in tissue and vein, summarized in Table 1, show that the susceptibility and therefore blood deoxygenation was significantly higher in major veins draining from the contralateral side than that from the lesion territory. This difference was significant for local veins within the infarcted region compared to its contralateral region while there was no significant difference in tissue susceptibility between two hemispheres.
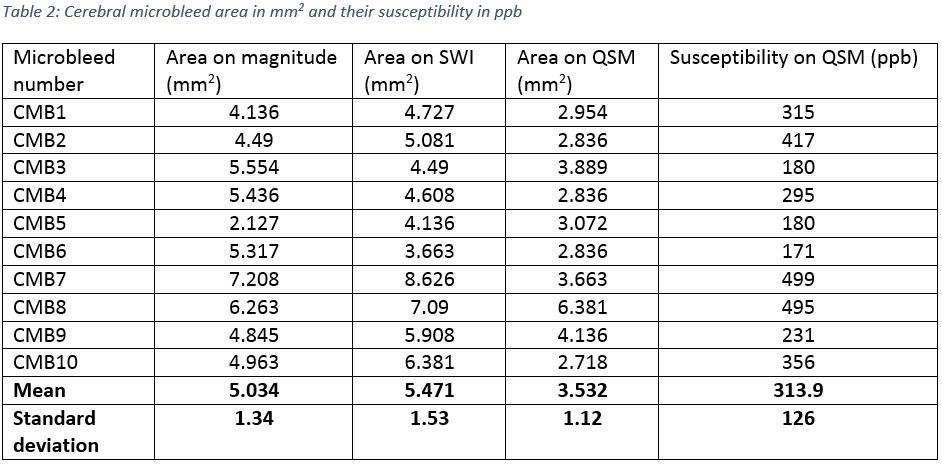
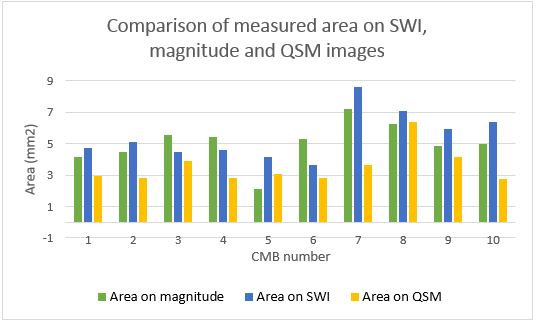
Microbleeds: As results for CMB assessment in Table 2 show, on QSM the size of CMBs were significantly smaller (Figure 3) in comparison to SWI (p < 0.001759) and magnitude images (p < 0.00640) and the range for mean QSM value for CMBs was found to be 313.9 ± 126 ppb.
Discussion
Lower relative susceptibility in local and major veins in the stroke hemisphere suggests decreased cerebral metabolism and this effect is more visible in veins than tissue.
QSM can differentiate between calcium and microbleeds10, and removes the blooming effect which is present on magnitude and SWI that might lead to inaccurate CMB size measurements. Susceptibility values suggest that QSM could be used to automatically distinguish CMBs from small veins (susceptibility in range of 108±56ppb11) by thresholding, and it is easy to differentiate between large veins and CMBs due to vein continuity.
Conclusion
Significant susceptibility differences were found in veins within the infarct and major draining veins compared to contralateral veins, indicating QSM may enable study cerebral venous oxygenation in ischemic stroke. Furthermore, QSM is a useful tool to assess CMB burden, by providing a reliable estimation of CMB size and strong positive susceptibility differences from other brain tissue.Acknowledgements
No acknowledgement found.References
- Davis SM, Donnan GA. Secondary prevention after ischemic stroke or transient ischemic attack. New England Journal of Medicine. 2012;366(20):1914-22.
- Fan AP. Development, testing, and application of quantitative oxygenation imaging from magnetic susceptibility by MRI. Diss. Massachusetts Institute of Technology, 2014.
- Haacke EM, Tang J, et al. Susceptibility mapping as a means to visualize veins and quantify oxygen saturation. Journal of Magnetic Resonance Imaging. 2010;32(3):663-76.
- Luo Y, et al. Increased susceptibility of asymmetrically prominent cortical veins correlates with misery perfusion in patients with occlusion of the middle cerebral artery. European radiology. 2017;27(6):2381-90.
- Fernández‐Seara MA, et al. MR susceptometry for measuring global brain oxygen extraction. Magnetic resonance in medicine. 2006;55(5):967-73.
- Chai C, et al. Decreased susceptibility of major veins in mild traumatic brain injury is correlated with post-concussive symptoms: A quantitative susceptibility mapping study. NeuroImage: Clinical. 2017.
- Greenberg SM, et al. Cerebral microbleeds: a guide to detection and interpretation. The Lancet Neurology. 2009;8(2):165-74.
- Buch S, et al. Determination of detection sensitivity for cerebral microbleeds using susceptibility‐weighted imaging. NMR in biomedicine. 2017;30(4).
- Liu T, et al. Cerebral microbleeds: burden assessment by using quantitative susceptibility mapping. Radiology. 2012;262(1):269-78.
- Klohs J, et al. Detection of cerebral microbleeds with quantitative susceptibility mapping in the ArcAbeta mouse model of cerebral amyloidosis. Journal of Cerebral Blood Flow & Metabolism. 2011;31(12):2282-92.
- Liu J, et al. Susceptibility weighted imaging and mapping of micro-hemorrhages and major deep veins after traumatic brain injury. Journal of neurotrauma. 2016;33(1):10-21.
Figures