1875
Comparison of PET and MRI estimation of cerebral perfusion using multi parametric PET-MR in a non-human primate model of stroke1Univ Lyon, CarMeN Laboratory, INSERM, INRA, INSA Lyon, Université Claude Bernard Lyon 1, Lyon, France, 2Siemens Healthcare SAS, Saint-Denis, France, 3CREATIS, CNRS UMR 5220, INSERM U1206, Université Lyon 1, INSA Lyon, Université Jean Monnet Saint-Etienne, Lyon, France, 4CERMEP - Imagerie du vivant, Lyon, France, 5Cynbiose SAS, Marcy-L'Etoile, France, 6Department of Neurology, Hospices Civils de Lyon, Lyon, France
Synopsis
Reliable estimation of cerebral blood flow (CBF) is crucial for a precise diagnosis of acute ischemia. PET using [15O]H2O remains the reference method to assess CBF but it can also be assessed using MRI. Several post-processing algorithms of perfusion MRI can be used to derive MRI-CBF values. CBF was simultaneously assessed with PET and MRI in a Macaca fascicularis model of stroke using a Siemens PET-MRI hybrid scanner. Four MRI post processing algorithms (sSVD, cSVD, oSVD and Bayesian) were compared against PET estimation of CBF. Bayesian algorithm seems to derive the most reliable estimation of CBF.
Introduction
Restauration of blood flow to an ischemic organ is essential to prevent irreversible tissue injury. To this end, reliable estimation of cerebral blood flow is crucial for a precise diagnosis and patient therapy. Recent introduction of PET-MRI hybrid technology allows the simultaneous acquisition of PET and MRI data. Multi-parametric PET-MRI can be used to quantitatively evaluate physiological parameters, and to identify different areas within the ischemic territory. PET with [15O]H2O is the reference method to quantitatively assess cerebral perfusion. MRI cerebral perfusion can also be evaluated using DSC-MRI (dynamic susceptibility contrast MRI) with an injection of a paramagnetic contrast agent.Methods
Longitudinal cerebral perfusion assessment using a hybrid PET-MRI scanner Biograph mMR (Siemens Healthcare, Erlangen, Germany) was performed in a minimally invasive endovascular non-human primate (NHP – Macaca fascicularis) model of stroke under continuous veterinarian monitoring. The study was approved by the ethic committee of the institution (APAFIS#8901-2016032116237108) and strictly followed the European guidelines for animal experiment. In this model, a transient occlusion of the middle cerebral artery (MCA) was performed. Imaging data were acquired before ischemia (“baseline” imaging session) and after recanalization of the ischemic area (“post-reperfusion” imaging session). In this pilot phase, two animals were scanned at baseline session (NHP#1 and NHP#2) and one animal at post reperfusion session (NHP#1). PET data were corrected from attenuation using CT images. Kinetic modeling of the [15O]H2O PET was performed to compute CBF parametric maps. An image derived input function (IDIF) using a region of interest (ROI) placed in the aortic arch was used for the kinetic modeling. DSC-MRI data were processed using the software Olea Sphere® (Olea Medical, La Ciotat, France) and 4 post-processing algorithms were compared. DSC-MRI requires the measurement of the arterial input function (AIF) and the deconvolution of the tissue concentration time curve. One of the most accepted deconvolution methods is the use of singular value decomposition (SVD) and three variants of SVD were used (sSVD, cSVD, oSVD). A recently developed method, based on a probabilistic approach, the Bayesian algorithm were also used to compute MRI based parametric maps of blood flow, MRI-CBF. An automatic (based on clustering of arterial voxels) or manual selection of the AIF was also used to derive the MRI-CBF maps. Brain regions of interests (ROIs) consisting in 6-mm circles were manually placed over the cortex, basal ganglia, and white matter areas in both the affected and unaffected hemispheres, using the T1-weighted scans (72 ROIs for NHP#1 and 83 ROIs for NHP#2). For each ROI, PET- and MRI-CBF values were obtained. The regional CBF values MRI-CBF obtained with the DSC-MRI and the four post-processing algorithms, were compared by linear correlation with the PET-CBF, and Bland-Altman plots to characterize similarities and differences between methods. NHP#1 and NHP#2 ROIs data were pooled together. To reduce intersubject variability, PET- and MRI-CBF data were normalized, each ROI data was expressed as percentage of the mean of all ROIs for each NHP.Results
NHP#1 lesions observed on the diffusion-weighted imaging (DWI) at the post-reperfusion imaging session, and corresponding PET- and MRI-CBF maps are represented on Figure 1. Coefficient of correlation R2 obtained in the regression plots are represented in Table 1. The two MRI post processing methods that give the best correlation with PET-CBF data are outlined in red. A good correlation between MRI methods is obtained. By comparison to the reference methods PET-CBF, automatic and manual AIF with the Bayesian algorithm showed the best correlation. The plots of these two regressions shown in Figure 2. Presence of low and high values of CBF at the post reperfusion imaging session improves linear link between PET and MRI-CBF values, and reduce dispersion. The slopes of the correlations show either an overestimation or underestimation of the MRI-CBF against the reference method PET-CBF. These observations are confirmed by the Bland-Altman plots shown in Figure 3. In this case, automatic selection of the AIF gives higher bias in both baseline and post reperfusion imaging sessions, compared to manual selection of the AIF that gives a bias inferior to 10%.Discussion
Correlation with the automatic AIF and Bayesian method versus PET-CBF is close to the one obtained with manual AIF (R2=0,50 versus R2=0,47) but when looking at absolute values, manual AIF gives the closest estimation of MRI-CBF compared to PET-CBF. A larger sample is needed to confirm the value of the Bayesian algorithm for longitudinal studies of CBF and CBV.Acknowledgements
The authors would like to thank Siemens Healthcare for providing the prototype sequence used in this work.References
No reference found.Figures
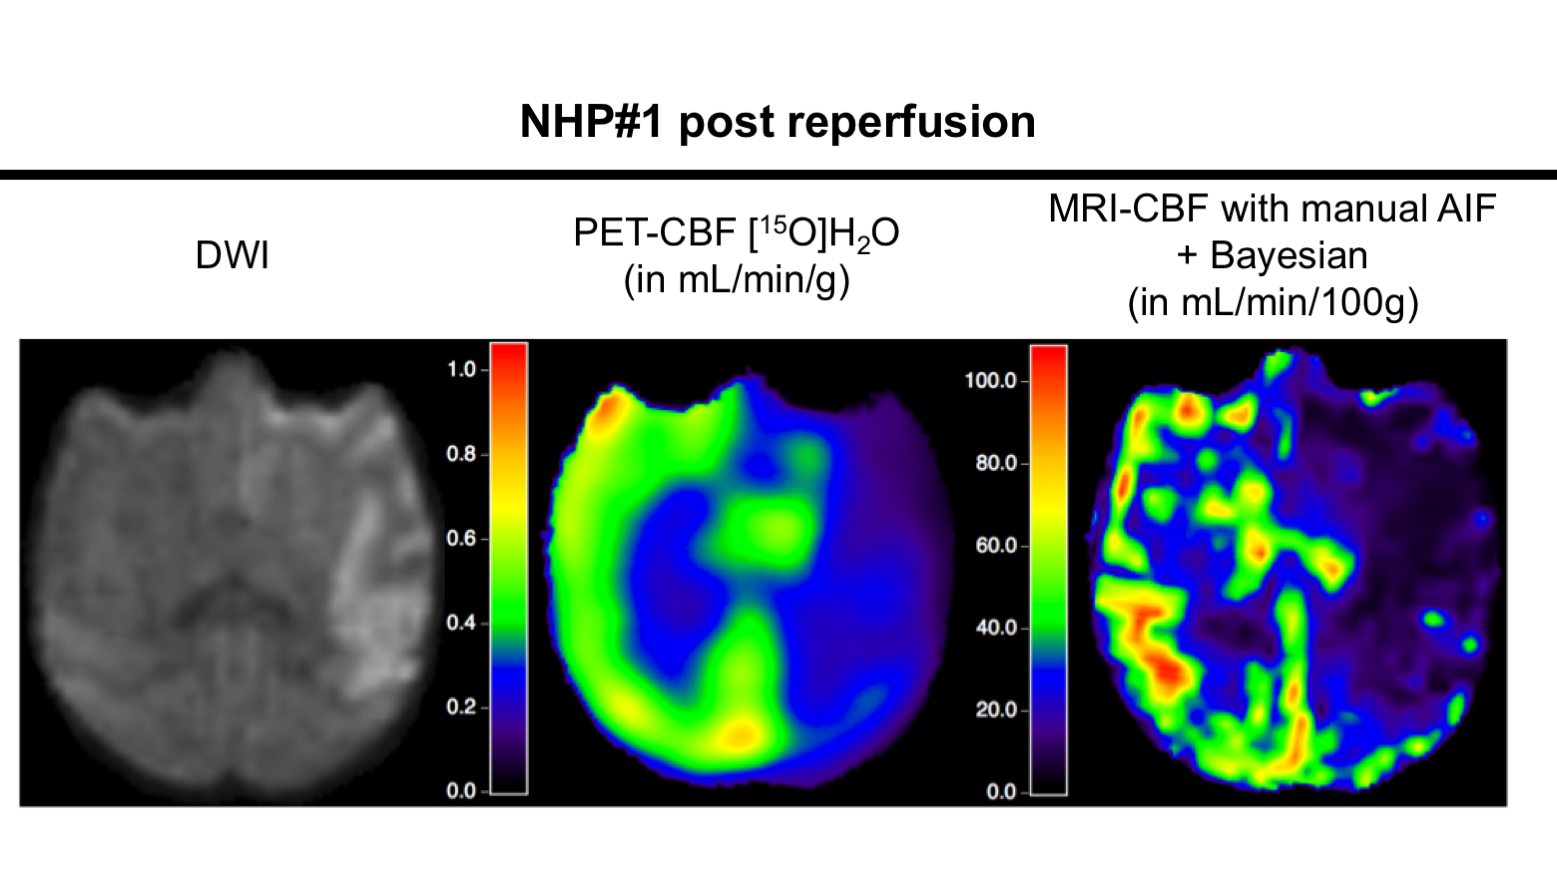
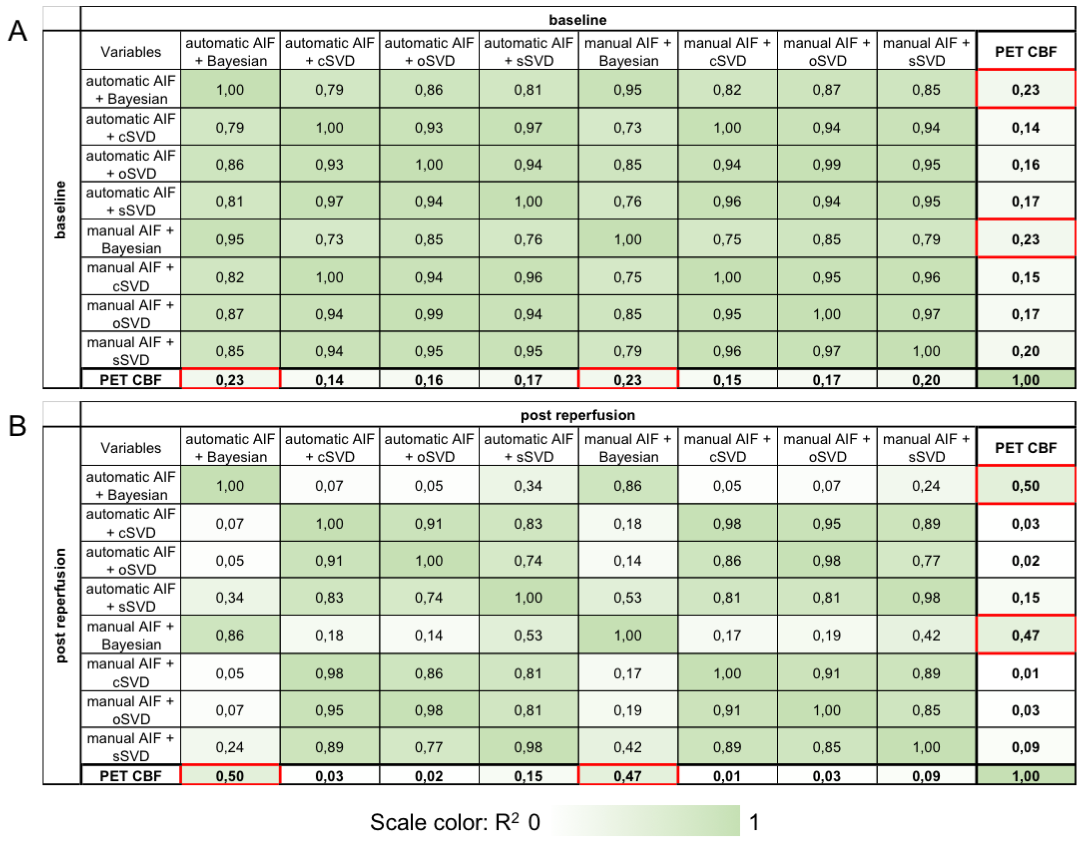
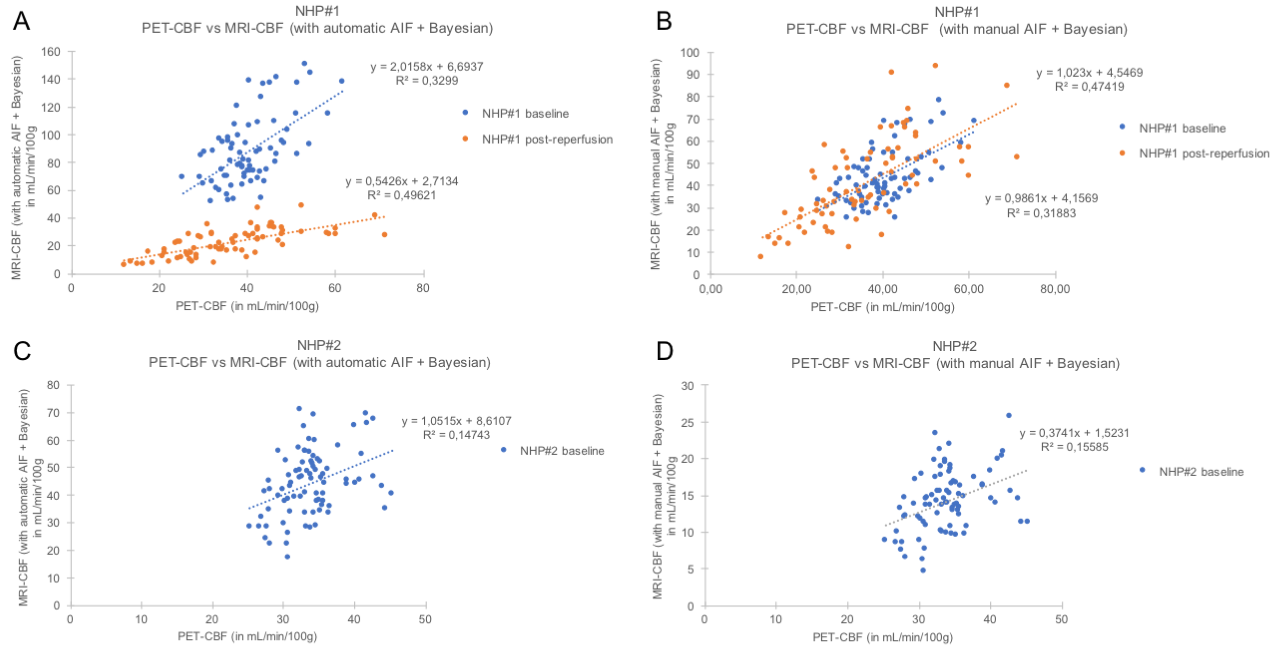
Figure 2:
A and B: NHP#1 correlations between PET-CBF and MRI-CBF with automatic AIF + Bayesian (A) or manual AIF + Bayesian (B) at baseline and post reperfusion imaging session.
C and D: NHP#2 correlations between PET-CBF and MRI-CBF with automatic AIF + Bayesian (C) or manual AIF + Bayesian (D) at baseline imaging session.
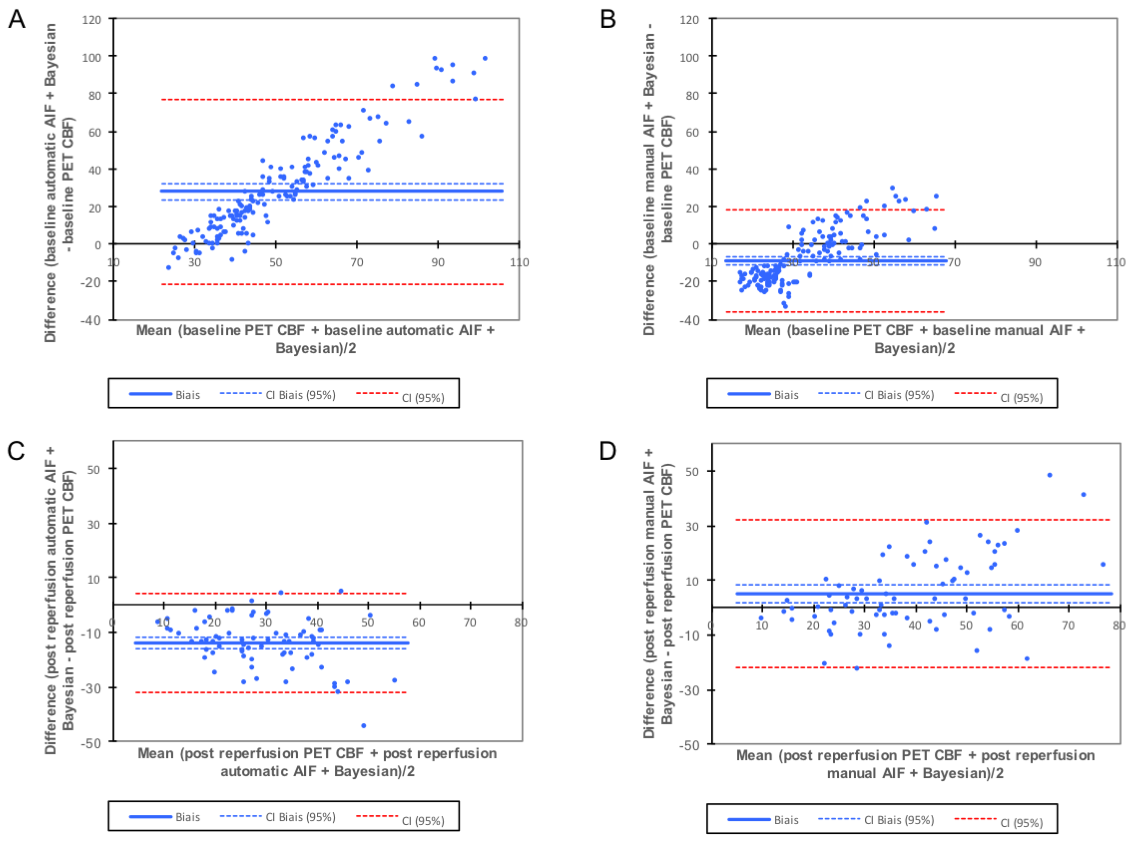
Figure 3:
A and B: Bland-Altman plots at baseline imaging session in NHP#1 and NHP#2 (n=155 ROIs) with automatic AIF and Bayesian method (A) or manual AIF and Bayesian method (B).
C and D: Bland-Altman plots at post reperfusion imaging session in NHP#1 (n=72 ROIs) with automatic AIF and Bayesian method (C) or manual AIF and Bayesian method (D).