1868
Magnetic resonance angiography and venography was not useful for correcting underestimated susceptibility measurements of sub-voxel objects on quantitative susceptibility maps1Department of Psychiatry and Behavioral Neurosciences, Wayne State University School of Medicine, Detroit, MI, United States, 2Center for Functional and Metabolic Mapping, Robarts' Research Institute, Western University, London, ON, Canada, 3Department of Radiology, Wayne State University, Detroit, MI, United States, 4Department of Biomedical Engineering, Wayne State University, Detroit, MI, United States
Synopsis
We investigated two magnetic resonance angiography and venography (MRAV) methods for use in correcting quantitative susceptibility mapping (QSM) estimates in sub-voxel veins. An MRAV generated from an interleaved rephased/dephased gradient echo sequence (without contrast agent) suffered from low SNR in veins, whereas the contrast-enhanced T1-MRAV caused the vessels to appear larger than those in the pre-contrast images. Neither method offered a reliable correction of partial-volumed susceptibility measurements.
Introduction
Susceptibility measurements from quantitative susceptibility mapping (QSM) can be used to estimate venous oxygenation in the brain. However, quantitative magnetic resonance imaging (MRI) often suffers from resolution-related problems for sub-voxel structures, like veins and microbleeds. Sub-voxel objects have underestimated susceptibility and overestimated oxygen saturation. There are some methods to correct for partial volume in larger objects1, 2, but as yet there are no published methods for correcting this for sub-voxel objects. We attempted to solve this by correcting the measured susceptibility (χmeasured) by using the blood volume fraction (fvein) in a two-compartment model, such that
χmeasured=χvein*fvein Equation 1
Given a matched susceptibility map and MRAV, in which image intensity correlates with fvein, χvein can be found. However, this correction did not prove as simple as expected.
Methods
Data were collected on a 3T Siemens VERIO scanner. MRAVs were generated using: 1) a 3D SWI sequence with an interleaved rephased/dephased sequence using the STrategically Acquired of Gradient Echo (STAGE) protocol3-5 for nine healthy subjects, scanned with varying echo times, durations for the dephasing bipolar gradients, and resolutions; and 2) subtracting T1 MPRAGE data from before and after administration of a gadolinium-based contrast agent for 7 participants. The volume fraction for the vein was calculated by normalizing the venous signal to the intensity of the superior sagittal sinus (SSS). QSM data were generated using SWIM from either the 17.5 ms from the rephased STAGE data or from a separate single-echo SWI of TE=12.5 ms6. Finally, simulations were performed using the analytical model of an infinite cylinder for phase7 and uniform intensity value representing the magnitude component to test the relationships between fvein, STAGE-MRAV intensity ratio, and QSM ratio (χmeasured/χvein).Results
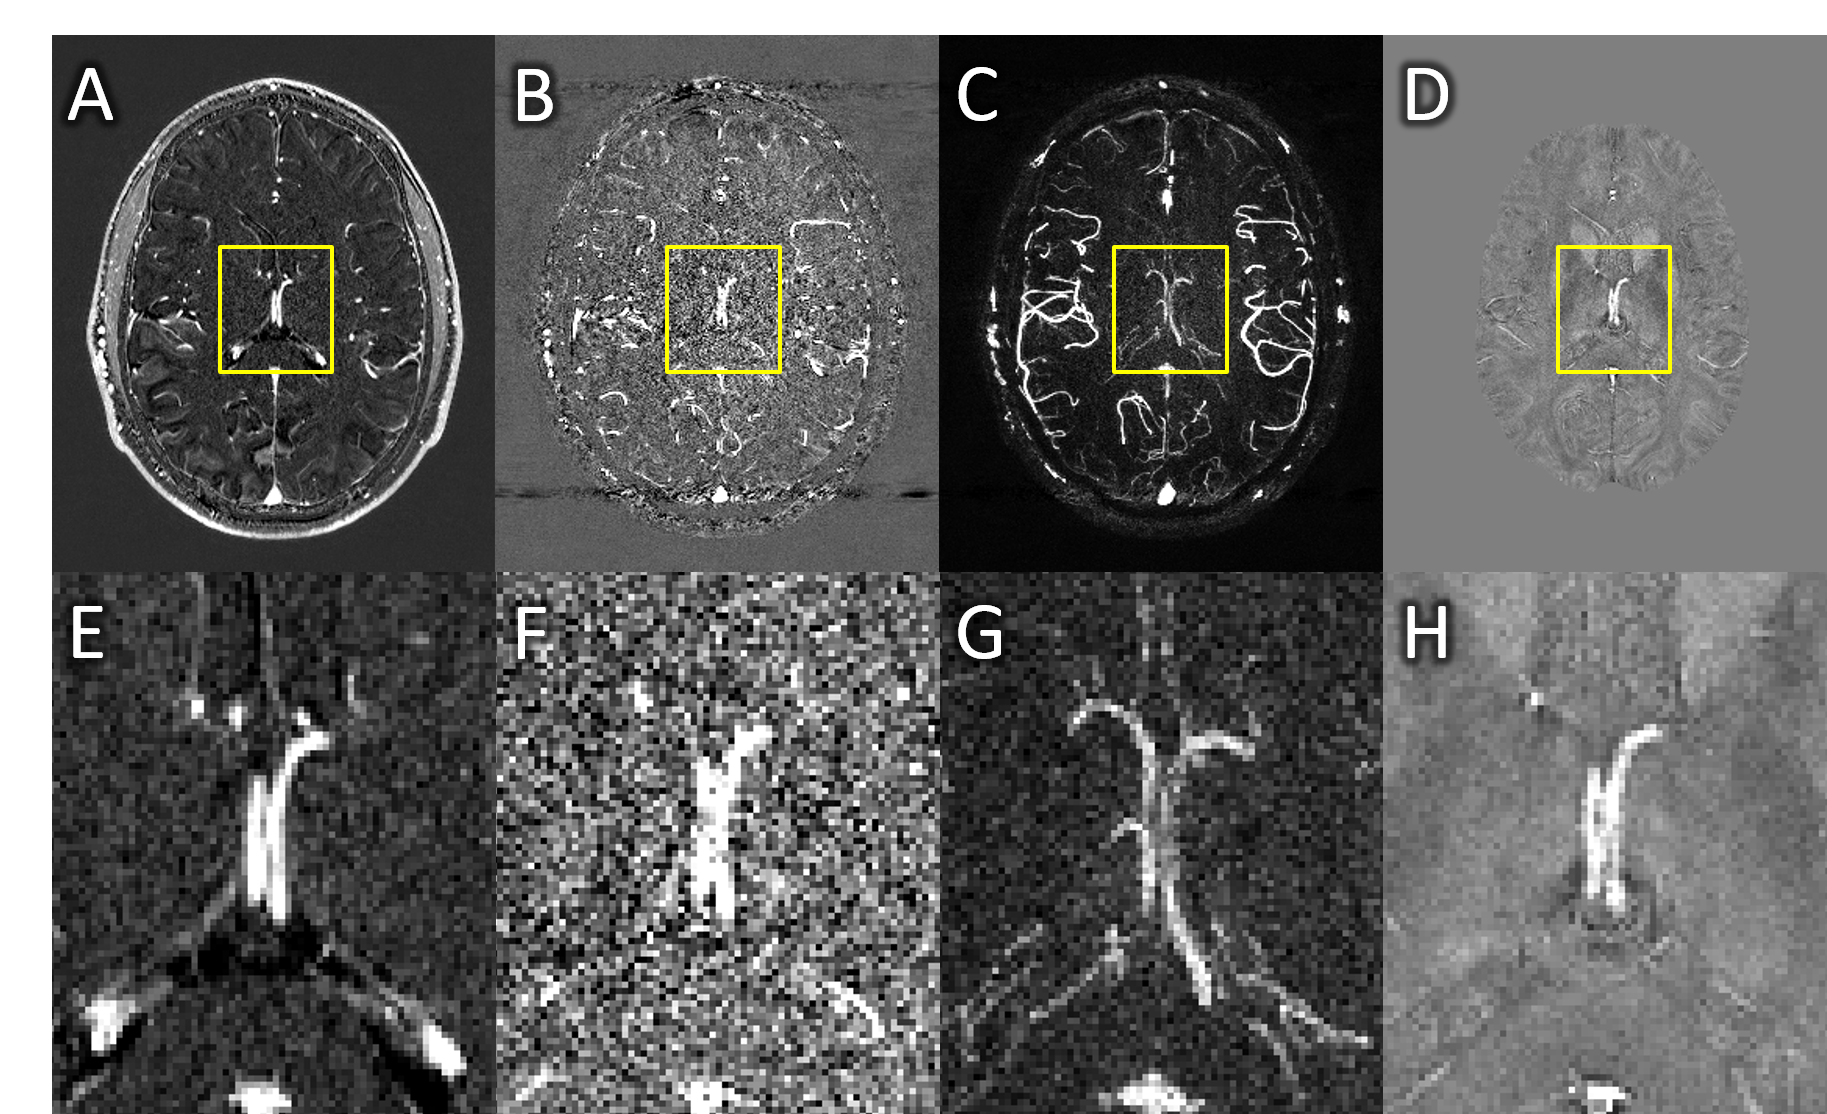
The internal cerebral veins appeared larger on CE-MRAVs (10 voxels across, Figure 1A and 1E), than on QSM data (9 voxels across, Figure 1D and 1H), which ruled out a voxel-wise correction. This apparent difference was present across most veins. An ROI-based correction was attempted in the septal and thalamostriate veins but gave corrected susceptibility values far higher than expected, between 600-800 ppb instead 400-500 ppb8, with high variability between very slightly differing ROIs.
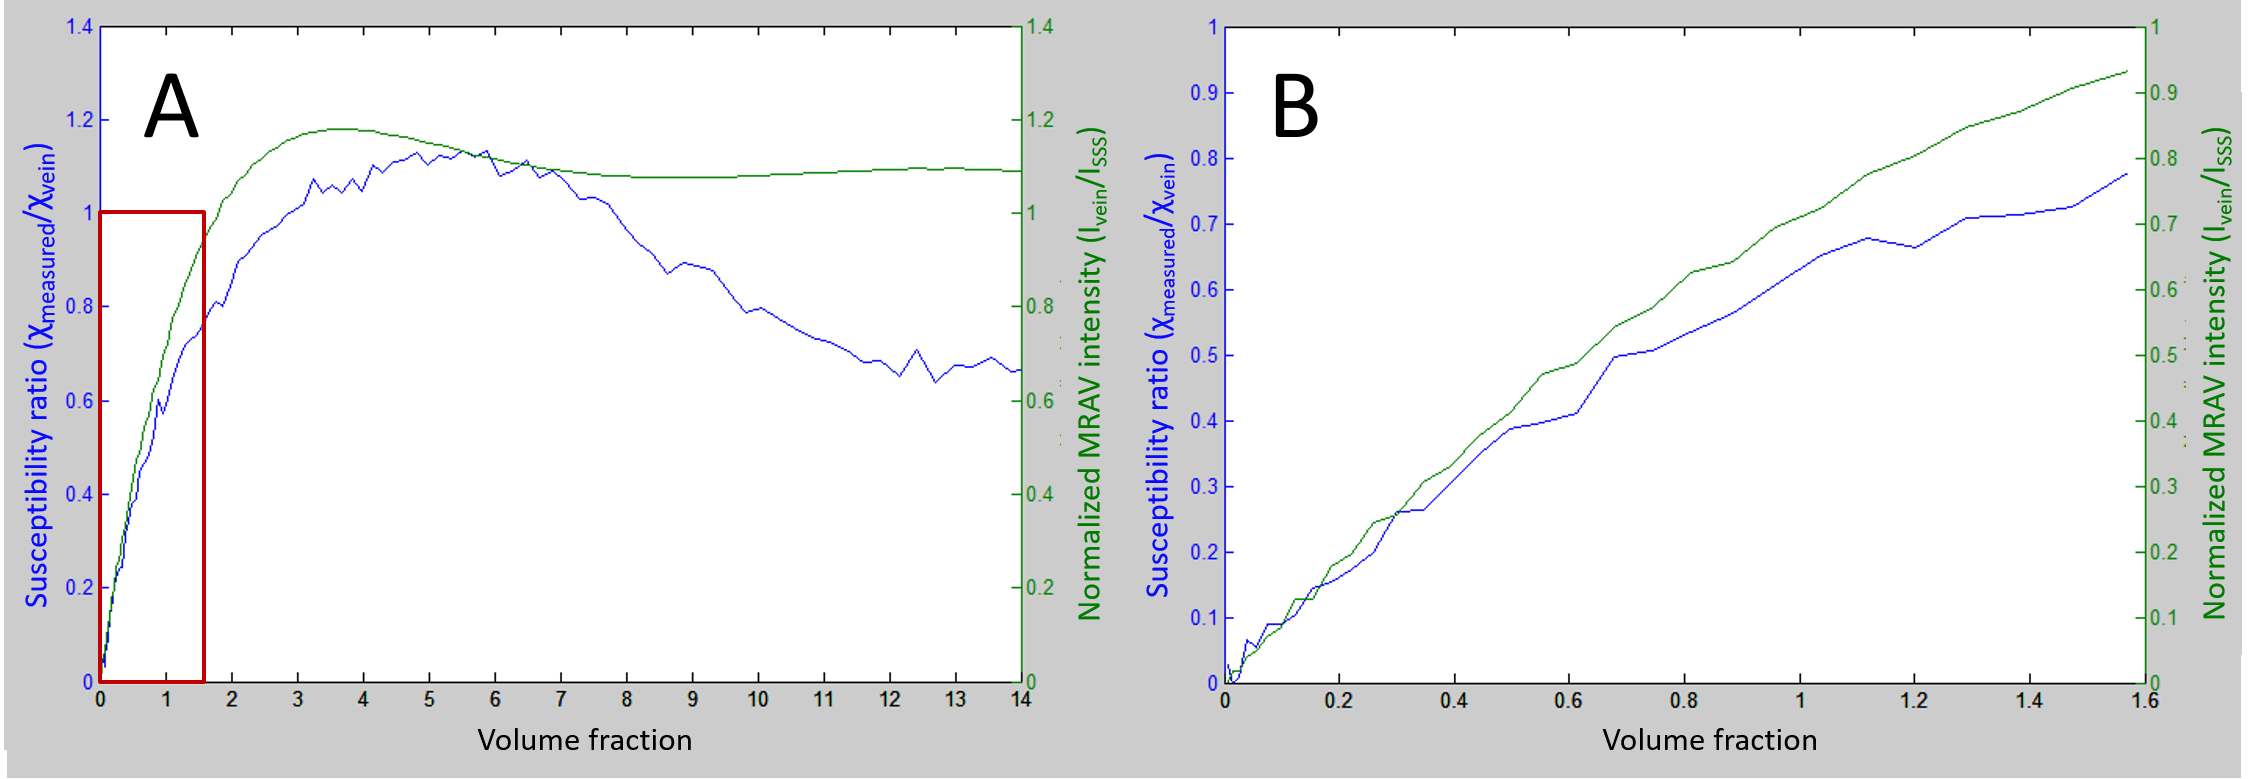
STAGE-MRAVs required a dephasing gradient duration of greater than 3.5 ms in order to fully dephase blood, with lower gradient durations producing an underestimate of f. However, this required a TE of 17.5 ms. Given a T2* of venous blood around 21 ms at 3T9, this led to significant signal loss in veins, impairing SNR and quantification of fvein. The MRAV did better for arteries and may be practical for estimating fartery (Figure 1B, F and C, G), but did not yield reliable values for fvein or improve our estimates of χvein. The simulations revealed a non-linear relationship between fvein and MRAV intensity ratio or χmeasured/χvein (Figure 2) which was not identical for MRAV and QSM. Given that the relationships between fvein and the MRAV intensity ratio or χmeasured/χvein are both fairly linear in the sub-voxel range, equations fitting this data could be used to convert from MRAV intensity ratio to a corrected χvein given an unflawed MRAV.
Discussion
Neighboring voxels within a vessel should have the same oxygen content and susceptibility, so fvoxel should be the primary determinant of variation in χmeasured. The MRAV maps should be subject to the same partial voluming with fvoxel as the primary determinant of intensity as well, meaning that the changes on these two maps should be correlated; voxels brighter on one should be brighter on the other. However, this did not hold true in our data, indicating that neither method would be able to produce a reliable correction based on Equation 1. This discrepancy may be due to the non-uniform levels of partial volume effects, in-flow effects, or reconstruction differences in QSM and RF field variations. For a smaller object, fewer voxels are available for analysis, hence the assumption fails more drastically for voxels that possess higher levels of noise.Conclusion
This experiment tested the possibility of estimating the partial volume-related underestimation of susceptibility. Neither version of MRAV was able to predict fvein and provide a reasonable estimate of the susceptibility. Future attempts will need to deal with multiple weaknesses of this concept from resolution, SNR and reconstruction issues.Acknowledgements
The first author is supported under NIH F30 grant HD084144 (PI NMW). This project was supported by DoD grant W81XWH-11-1-0493 (PI: EMH), an International Society for Magnetic Resonance in Medicine Seed Grant (PI: ZK), and NIH R21 grant NS090153 (PI: ZK).References
- Ward, PGD, AP Fan, P Raniga, et al. Improved quantification of cerebral vein oxygenation using partial volume correction. Frontiers in Neuroscience, 2017;11(89).
- Ward, PGD, AP Fan, P Raniga, et al., Partial volume correction of quantitative susceptibility maps for oxygen extraction fraction measurements, in International Society for Magnetic Resonance in Medicine. 2016.
- Chen, Y, S Liu, Y Wang, et al. Strategically acquired gradient Echo (STAGE) imaging, part I: Creating enhanced T1 contrast and standardized susceptibility weighted imaging and quantitative susceptibility mapping. Magnetic Resonance Imaging, 2017.
- Wang, Y, Y Chen, D Wu, et al. Strategically acquired gradient Echo (STAGE) imaging, part II: Correcting for RF inhomogeneities in estimating T1 and proton density. Magnetic Resonance Imaging, 2017.
- Chen, Y, S Liu, Y Kang, et al. An interleaved sequence for simultaneous MRA, SWI and QSM. in International Society for Magnetic Resonance Imaging in Medicine 25th Annual Meeting & Exhibition. 2017. Honolulu, Hawaii, USA.
- Tang, J, S Liu, J Neelavalli, et al. Improving susceptibility mapping using a threshold-based K-space/image domain iterative reconstruction approach. Magn Reson Med, 2013;69(5):1396-407.
- Haacke, EM, RW Brown, MR Thompson, et al., Magnetic Resonance Imaging: Physical Principles and Sequence Design. 1999, Canada: John Wiley & Sons, Inc. 914.
- Haacke, EM, J Tang, J Neelavalli, et al. Susceptibility mapping as a means to visualize veins and quantify oxygen saturation. J Magn Reson Imaging, 2010;32(3):663-76.
- Zhao, JM, CS Clingman, MJ Narvainen, et al. Oxygenation and hematocrit dependence of transverse relaxation rates of blood at 3T. Magn Reson Med, 2007;58(3):592-7.
Figures