1867
Comparison between quantitative magnetization transfer imaging and ratio of T1w/T2w approach in myelin mapping1Bernard and Irene Schwartz Center for Biomedical Imaging, Department of Radiology, New York University School of Medicine, New York, NY, United States, 2Department of Radiology, University of Wisconsin at Madison, Madison, WI, United States
Synopsis
Myelination is one of the essential indicators of brain maturation, and various abnormalities in myelin content have been found for different psychiatric disorders. However, reliable imaging techniques for human in vivo myelin measurement are still under intensive research, thus the degree and significance of myelin deficits for specific pathology remain indeterminate. The current study compared myelin mapping proposed as part of the Human Connectome Protocol using the ratio of T1 and T2 weighted image intensity to quantitative magnetization transfer mapping (qMT). The relationship between myelin content estimated by these two methodologies in various brain regions is discussed.
Introduction
Myelin formation is one of the most essential aspects in postnatal brain maturation. Findings regarding the role of myelin content in neural pathway remodeling and basic cognitive functions [1] in recent years have brought the need for myelin quantification into spotlight. However, non-invasive in vivo measurement of myelination is still an open problem, and most of the myelin hypotheses for psychiatric disorders nowadays are mainly extended from animal model and histological studies. The current study employed two existing in vivo approaches of myelin estimation: quantitative magnetization transfer mapping (qMT) [2,3,4] and the ratio of T1- (T1w) and T2- (T2w) weighted image intensity value T1w/T2w [5], which was proposed as part of the Human Connectome Protocol pipelines [6]. Given the wide use of the Human Connectome Protocol and related T1w/T2w myelin mapping, it is important to assess the relationship of this approach to model-based quantitative approaches.Methods
Eleven healthy volunteers (mean age ± standard deviation: 24.5 ± 3.2 years, 6 males/5 females) participated in the study. All participants were scanned on Siemens Prisma 3T scanner. For qMT mapping, a three-dimensional gradient echo MT-weighted sequence was acquired with a voxel size of 1.5x1.5x1.5 mm and approximately full brain coverage. One MT-weighted (TR = 29 ms; FA = 10°) and two variable flip angle datasets (TR = 21ms; FA = 4° and 25°) were collected. Off resonance saturation was achieved by applying a Gaussian pulse with effective saturation FA = 560°, pulse duration = 12.3 ms, and offset frequency = 4 kHz. The images were used to calculate macromolecular proton fraction (MPF) as previously described [4]. For T1w/T2w myelin estimation, high resolution (voxel size = 0.8x0.8x0.8mm) three-dimensional T1w MPRAGE sequence and T2w sequence were acquired using the Human Connectome Protocol. The T1w images were also used for brain segmentation in FreeSurfer. For the sake of comparison, we did not perform surface-based analyses of the T1w/T2w data as suggested in the literature [5]. Instead, a regions of interest (ROI) analysis was conducted using the same FreeSurfer atlas in the qMT approach. Correlation analysis was performed for the myelin estimation data from the two approaches in several critical anatomical regions, including the frontal, parietal, occipital, and occipital-temporal cortex, hippocampus, putamen, thalamus, corpus callosum, and overall cerebral white matter.Results
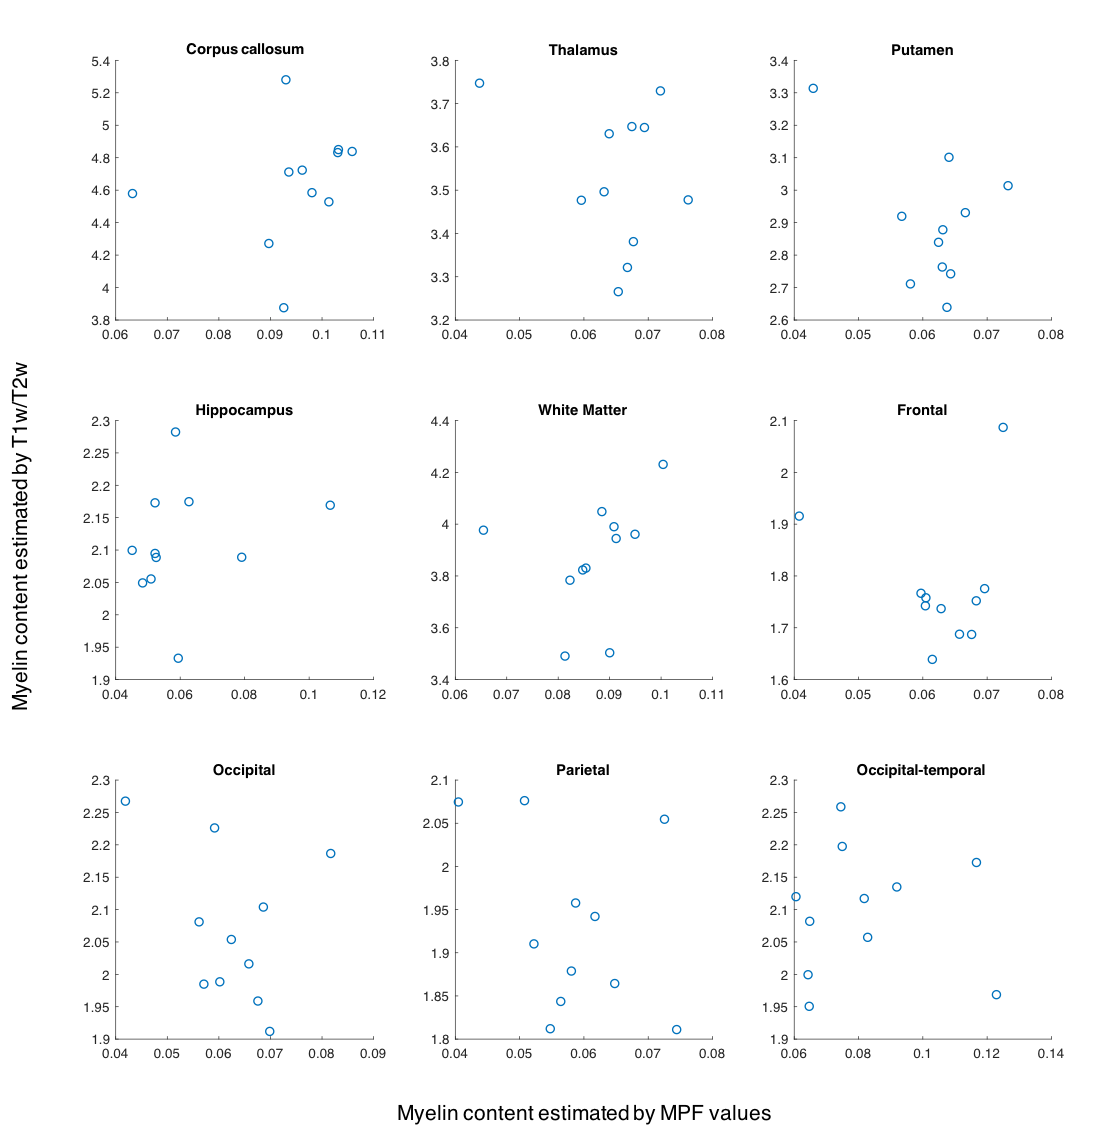
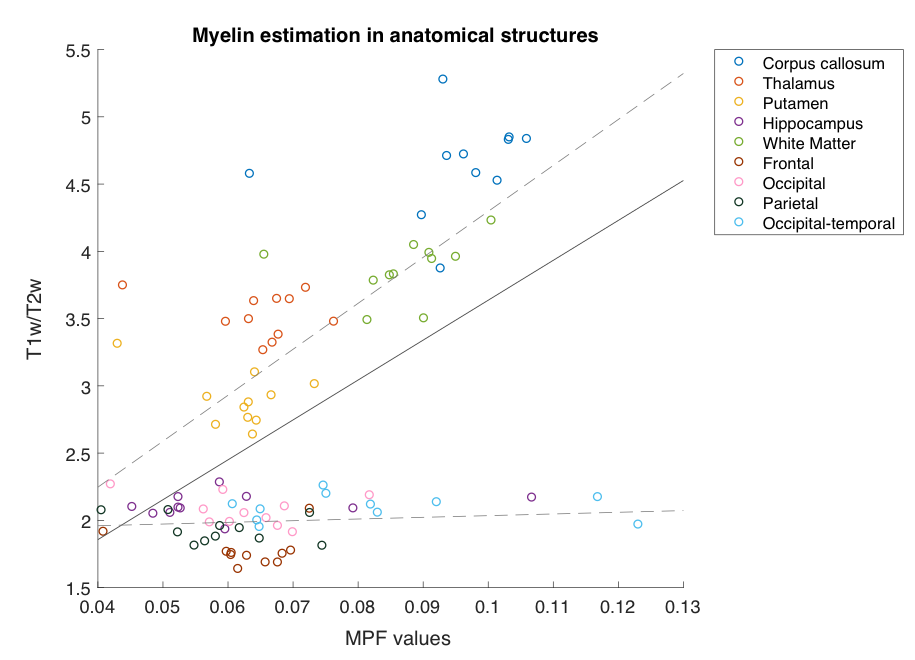
No significant correlation was found between the myelin estimation results from the two approaches in any of the specific regions examined (Figure 1). However, the pooled data points did show a positive relationship (r=.523, p<.01) between estimated myelin content from qMT and T1w/T2w (Figure 2). In particular, the correlation is stronger in the white matter (i.e., corpus callosum and overall white matter) and regions known to have white matter connections within their extent (i.e., thalamus, putamen, and hippocampus) (r=.689, p<.01). In comparison, results in the cortical grey matter regions were less related (r=.123, p=.37).Discussion
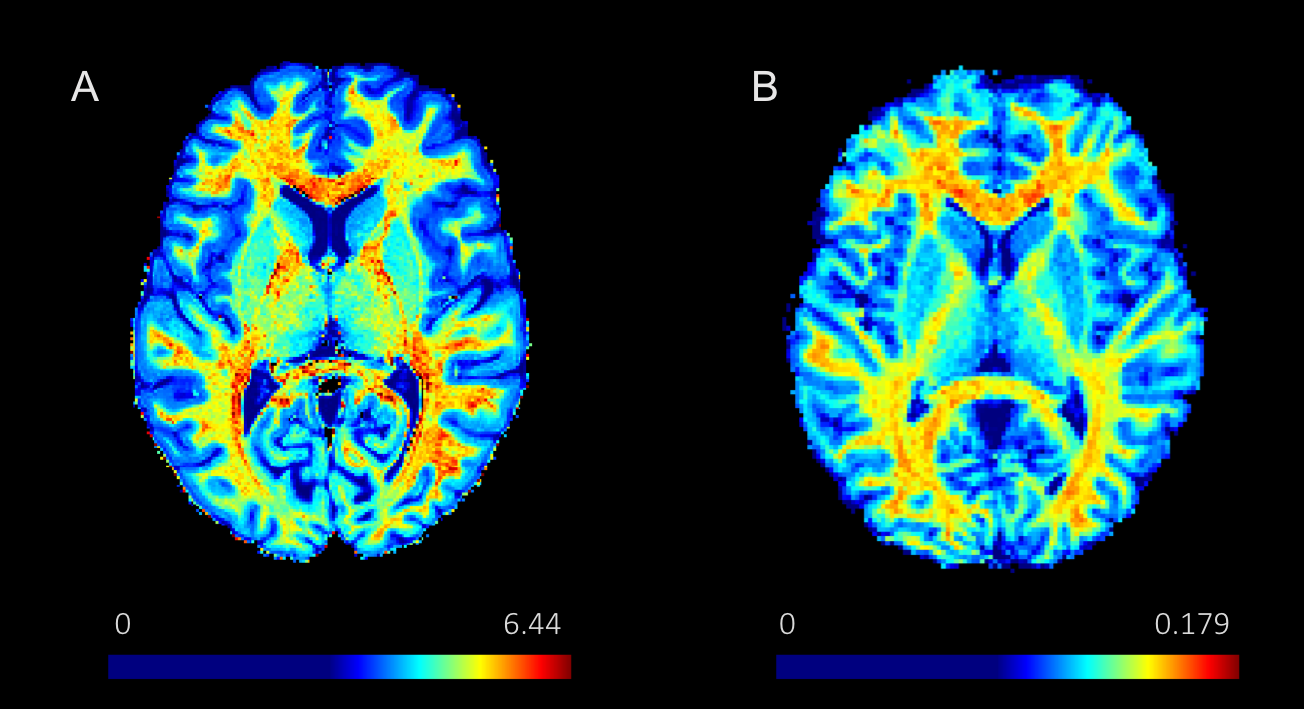
Correlation analyses revealed that both approaches of myelin estimation seemed to be qualitatively accurate about the distribution of myelin content throughout the brain (Figures 2 and 3). In particular, myelin content in white matter especially the corpus callosum was reliably higher than that in grey matter regions, while grey matter structures such as thalamus, putamen, and hippocampus that are known to contain strong axonal projections showed more myelin content than others. This trend in myelin density is in correspondence with previous findings from histological study [7]. However, at specific region level, the myelin estimation from two methods did not correlate as well as expected. This may probably be due to the potential inconsistency in the intensive scale of the images in the T1w/T2w approach and its potential sensitivity to iron [8]. We note that recent works have established a good correlation of qMT results with histology-based myelin estimates [7,9]. In addition, qMT offers an absolute quantification of the myelin content in the brain, whereas the T1w/T2w provides only a qualitative assessment.Conclusion
Both qMT and T1w/T2w approaches seem to correctly reflect overall myelin distribution in the brain. However, at region level the relationship between the two methods is poor, which indicates that care needs to be exercised when applying T1w/T2w mapping in assessing myelination at structure level. Further correlation with histological data will be important in establishing the accuracy of imaging based methods in different brain regions.Acknowledgements
This study was funded by National Institute of Mental Health.References
1. Fields, R. D. (2008). White matter in learning, cognition and psychiatric disorders. Trends in neurosciences, 31(7), 361-370.
2. Yarnykh, V. L. (2012). Fast macromolecular proton fraction mapping from a single off‐resonance magnetization transfer measurement. Magnetic resonance in medicine, 68(1), 166-178.
3. Mossahebi, P., Yarnykh, V. L., & Samsonov, A. (2014). Analysis and correction of biases in cross‐relaxation MRI due to biexponential longitudinal relaxation. Magnetic resonance in medicine, 71(2), 830-838.
4. Samsonov, A. A., Mossahebi, P., Anderson, A., Velikina, J. V., Johnson, K. M., Johnson, S. C., Fleming, J. O., & Field, A. S. (2014). High Resolution, Motion Corrected Mapping of Macromolecular Proton Fraction (MPF). Clinically Acceptable Time Using 3D Undersampled Radials. In Proc of ISMRM (p. 3337).
5. Glasser, M. F., & Van Essen, D. C. (2011). Mapping human cortical areas in vivo based on myelin content as revealed by T1-and T2-weighted MRI. Journal of Neuroscience, 31(32), 11597-11616.
6. Glasser, M. F., Sotiropoulos, S. N., Wilson, J. A., Coalson, T. S., Fischl, B., Andersson, J. L., . . . Consortium, W. U.-M. H. (2013). The minimal preprocessing pipelines for the Human Connectome Project. Neuroimage, 80, 105-124.
7. Khodanovich, M. Y., Sorokina, I. V., Glazacheva, V. Y., Akulov, A. E., Nemirovich-Danchenko, N. M., Romashchenko, A. V., . . . Yarnykh, V. L. (2017). Histological validation of fast macromolecular proton fraction mapping as a quantitative myelin imaging method in the cuprizone demyelination model. Scientific Reports, 7, 46686.
8. Ganzetti, M., Wenderoth, N., & Mantini, D. (2014). Whole brain myelin mapping using T1- and T2-weighted MR imaging data. Frontier in Human Neuroscience, 8, 671.
9. Underhill, H. R., Rostomily, R. C., Mikheev, A. M., Yuan, C., & Yarnykh, V. L. (2011). Fast bound pool fraction imaging of the in vivo rat brain: association with myelin content and validation in the C6 glioma model. Neuroimage, 54(3), 2052-2065.
Figures