1866
A Comparison of R1 and Magnetization Transfer Saturation for Mapping Intracortical Myelin1National Institute of Neurological Disorders and Stroke, National Institutes of Health, Bethesda, MD, United States, 2Psychology, Neuroscience and Behaviour, McMaster University, Hamilton, ON, Canada
Synopsis
Contrasts based on T1 and R1 (1/T1), including T1/T2-weighted hybrid contrast, have been proposed to map intracortical myelin in the mammalian brain. However, iron in the cortex may obscure changes in myelin investigated by T1-based contrast since T1 is also sensitive to myelin. Here we explore magnetization transfer contrast for mapping ICM, as it may be more specific for myelin. We compare R1 maps measured by MP2RAGE with MTsat measured by MT-FLASH in two marmosets, a species of small non-human primate. Although MTsat shows a similar pattern as R1 in some regions of the cortex, MTsat suffers from signal inhomogeneity issues and care is needed to correct these in future measurement protocols to properly compare R1 and MTsat contrasts.
Introduction
Past studies have used T1-weighted (T1W), R1, or T1W /T2-weighted contrast to map intracortical myelin (ICM) in humans and animals. While this contrast has been shown to be well spatially correlated with ICM distributions1, T1 and R1 are also sensitive to iron (Fe)2. Fe colocalizes with myelin in the cortex3, such that changes in Fe in aging or disease could obscure changes in myelin when investigated with T1W or R1-based mapping. In this study, we thus explored imaging the cortex with magnetization transfer saturation (MTsat)4, as it is potentially more specific for mapping myelin.
Methods
Two male marmoset monkeys aged two and six years old were imaged on a horizontal 7T/30cm MRI (Bruker-Biospin Corp., Billerica, USA) with a 15cm gradient coil (Resonance Research Inc., Billerica, USA), a custom-built 11cm volume coil for transmission, and a custom-built 8-ch phased array for reception. Monkeys were imaged with an MP2RAGE sequence5 (Matrix=114x112x96, Resolution=0.253 mm3, TE/Echo-TR/TR=3/23/6000 ms, Flip-angle1/Flip-angle2=12/5 degrees, Bandwidth=37.5KHz, TI/TI2=1200/4000 ms, One segment, GRAPPA=2) which yielded a predominantly T1W image, ST1W, and a predominantly proton density-weighted image, SPD. Monkeys were further imaged with a FLASH sequence with MT preparation (Matrix=114x112x96, Resolution=0.253 mm3, TE/TR=3/23 ms, Flip-angle=5 degrees, Bandwidth=37.5KHz, MT pulse offset=2500Hz, MT pulse duration=12ms, MT pulse amplitude=6.8μT), which yielded a third predominantly MT-weighted image, SMT. R1 maps were calculated from the ratio of ST1W/SPD and a look-up table of simulated signal values. MTsat (δ) maps were calculated from δ=(SPD/SMT-1)(α2/2+R1*TR), where α was the tip angle and TR the repetition time in both SPD and SMT. The R1 and MTsat maps from each animal were non-linearly registered into a common space using FSL’s FNIRT method6 and interpolated onto a middle depth surface in the cerebral cortex for visualization in the software Amira (Thermo Fisher Scientific, Waltham, USA).
Results
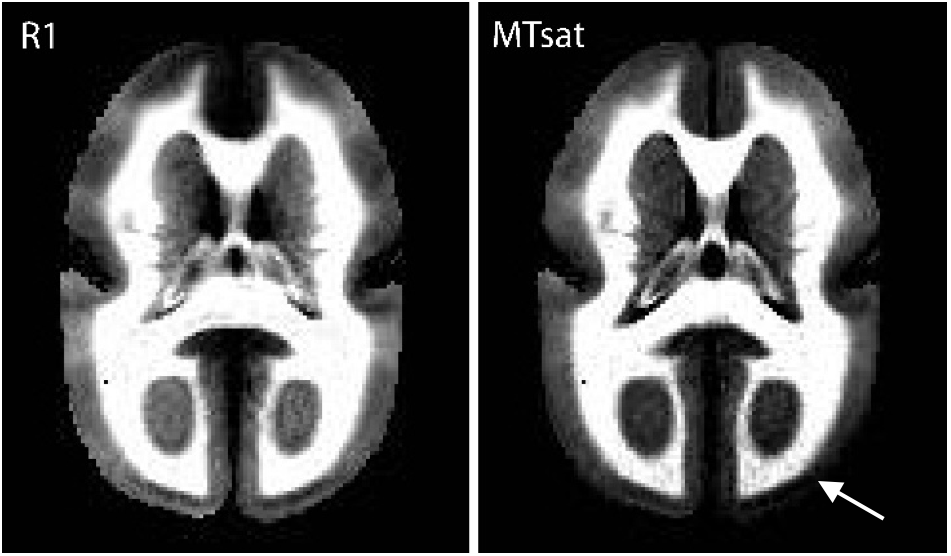
Matched slices from the average R1 and MTsat maps are shown in Figure 1. Both maps display intracortical contrast, although the contrast-to-noise ratio is visually better in the R1 map. This could be because both myelin and Fe are contributing to the contrast in the R1 map, or because of noise propagation in the MTsat map, whose calculation depends on the R1 map. The MTsat map also shows worse intensity homogeneity (e.g. at the white arrow in the occipital cortex).
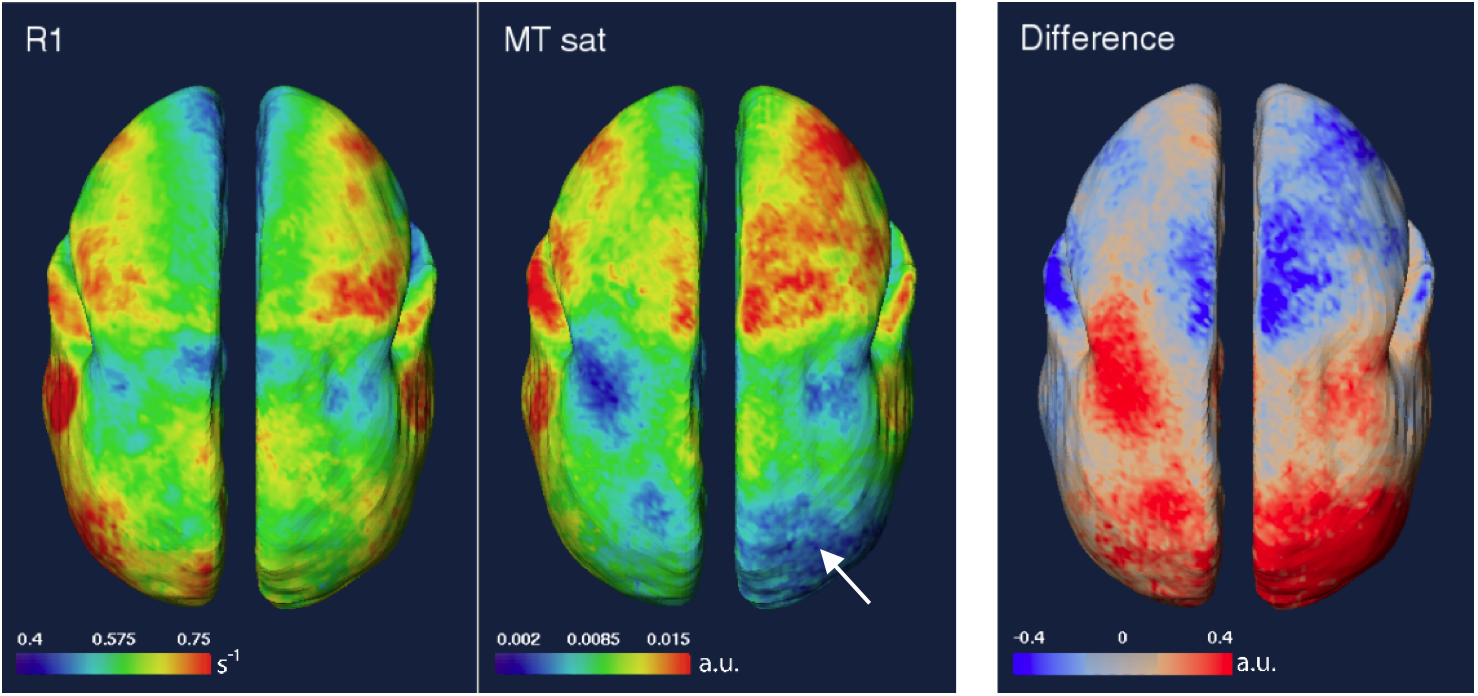
Figure 2 shows R1 and MTsat maps at a middle depth in the cortex and a map of the normalized difference. Aside from CNR differences, the primary difference is low-frequency hemispheric asymmetry in the MTsat map, which is lower in the R1 map. In some areas, however, the maps are in good agreement.
Conclusions
MTsat has the potential to be more specific for myelin in the cortex than R1. MTsat, however, appears to be more sensitive to signal inhomogeneities and corrections should be included in future measurement protocols.Acknowledgements
We thank Cirong Liu for animal preparations. We also thank Frank Ye for providing MP2RAGE sequence. This research was supported by the Intramural Research Program of the NINDS.References
- Bock NA, Kocharyan A, Liu JV, Silva AC. Visualizing the entire cortical myelination pattern in marmosets with magnetic resonance imaging. Journal of neuroscience methods. Dec 15 2009;185(1):15-22.
- Stuber C, Morawski M, Schafer A, et al. Myelin and iron concentration in the human brain: a quantitative study of MRI contrast. NeuroImage. Jun 2014;93 Pt 1:95-106
- Fukunaga M, Li TQ, van Gelderen P, et al. Layer-specific variation of iron content in cerebral cortex as a source of MRI contrast. Proceedings of the National Academy of Sciences of the United States of America. Feb 23 2010;107(8):3834-3839.
- Helms G, Dathe H, Kallenberg K, Dechent P. High-resolution maps of magnetization transfer with inherent correction for RF inhomogeneity and T1 relaxation obtained from 3D FLASH MRI. Magnetic resonance in medicine: official journal of the Society of Magnetic Resonance in Medicine / Society of Magnetic Resonance in Medicine. Dec 2008;60(6):1396-1407.
- Marques JP, Kober T, Krueger G, van der Zwaag W, Van de Moortele PF, Gruetter R. MP2RAGE, a self bias-field corrected sequence for improved segmentation and T1-mapping at high field. NeuroImage. Jan 15 2010;49(2):1271-1281.
- Jenkinson M, Beckmann CF, Behrens TE, Woolrich MW, Smith SM. Fsl. NeuroImage. Aug 15 2012;62(2):782-790.
Figures