1865
Pathological differentiation of multiple sclerosis lesions based on R2* at 3T: The influence of iron and myelin1UBC MRI Research Centre, University of British Columbia, Vancouver, BC, Canada, 2Department of Neurology, Medical University of Graz, Graz, Austria, 3Department of Physics and Astronomy, University of British Columbia, Vancouver, BC, Canada, 4Department of Pediatrics (Devision of Neurology), University of British Columbia, Vancouver, BC, Canada, 5Center for Brain Research, Medical University of Vienna, Vienna, Austria, 6Department of Biomedical Imaging and Image-Guided Therapy, Medical University of Vienna, Vienna, Austria, 7Institute of Neurology, Medical University of Vienna, Vienna, Austria, 8Institute of Neuropahtology, University Medical Center Goettingen, Goettingen, Germany, 9Child and Family Research Institute, University of British Columbia, Vancouver, BC, Canada
Synopsis
Magnetic-susceptibility sensitive MRI as measure for tissue damage in multiple sclerosis (MS) lesions has been controversial, since the relationship between the MR signal and the underlying pathology is not fully understood. Here we assessed R2* of different white matter MS lesion types and normal appearing white matter (NAWM) in relation to the underlying iron and myelin densities. We observed lower R2* in all MS lesion types compared to NAWM, driven by lower iron and myelin densities. Shadow plaques showed significant higher R2* values than other MS lesions, in line with the hypothesis of remyelination and supported by myelin histology.
Introduction
Extracting quantitative information from gradient-echo MR has been highlighted as a promising research field for the study of iron accumulation during aging1, but also in neurological disorders, such as multiple sclerosis (MS)2,3, where disease related changes in iron content and myelin occur. While R2* has been validated as a measure of iron concentration in deep gray matter4, the interpretation of R2* changes in white matter (WM) remains challenging. Due to the orientational dependency of R2* in WM5, validation studies can only estimate myelin, the major contributor to WM R2*, with large uncertainty. With new MS drugs that target remyelination, the sensitivity of advanced, quantitative MR metrics for myelin density such as R2* needs to be confirmed. Previous MS studies classified MS lesions based on their appearance of R2* and quantitative susceptibility maps (QSM), e.g. as 'shell/nodular' lesions or R2*/QSM positive or negative6, however, it remains unproven how these relate to pathological change. Here, we assessed R2* of different, pathologically classified WM MS lesions types in relation to the underlying histologically determined iron and myelin densities. We hypothesize that most lesions will exhibit iron loss and that differences between lesion types are primarily driven by changes in myelin.Methods
Five formalin fixed coronal brain tissue blocks and one whole brain of subjects with MS were obtained from the Department of Neuroimmunology and the Institute of Neurology at the Medical University of Vienna. All cases were scanned on a 3T Philips Achieva with an 8-channel head coil. The protocol was standardized to acquire multi-echo gradient-echo data at 0.55x0.55x0.55mm3 isotropic resolution, with 76 slices at a matrix size of 240x240mm2 (TE/ΔTE/TR = 5/6/40ms, 5 echoes, flip angle=30). Anatomical T2-weighted images were acquired to aid image registration between histology and MRI performed using NiftyReg. Single-component R2* maps were calculated using a linear fit to the logarithmic data after correction for B0 field inhomogeneities7. The scanned tissue blocks were embedded in paraffin and cut in 10µm thick sections. Luxol-fast-blue-period-acid-Schiff myelin (LFB) and Turnbull-blue (TBB) iron staining were performed using standardized protocols. All histological sections were digitized, and LFB-PAS sections were color-deconvolved in ImageJ. The T2w images were re-oriented in MATLAB to select the cut through the MRI that best matches the LFB section. R2* images were registered in 3D to the T2w images, and mapped to histology using the T2w transformation metrics. Histology sections were matched in 2D using FLIRT, a non-deformable registration tool, in FSL. Normal appearing white matter (NAWM) regions and chronic inactive, active demyelinating lesions and shadow plaques, i.e. remyelinated lesions, were identified on the LFB sections. Average R2* and staining intensity values were estimated for the separate regions-of-interest. To assess lesion type differences, a Kruskal-Wallis test was used with post-hoc Tukey-Kramer testing for multiple comparisons.Results
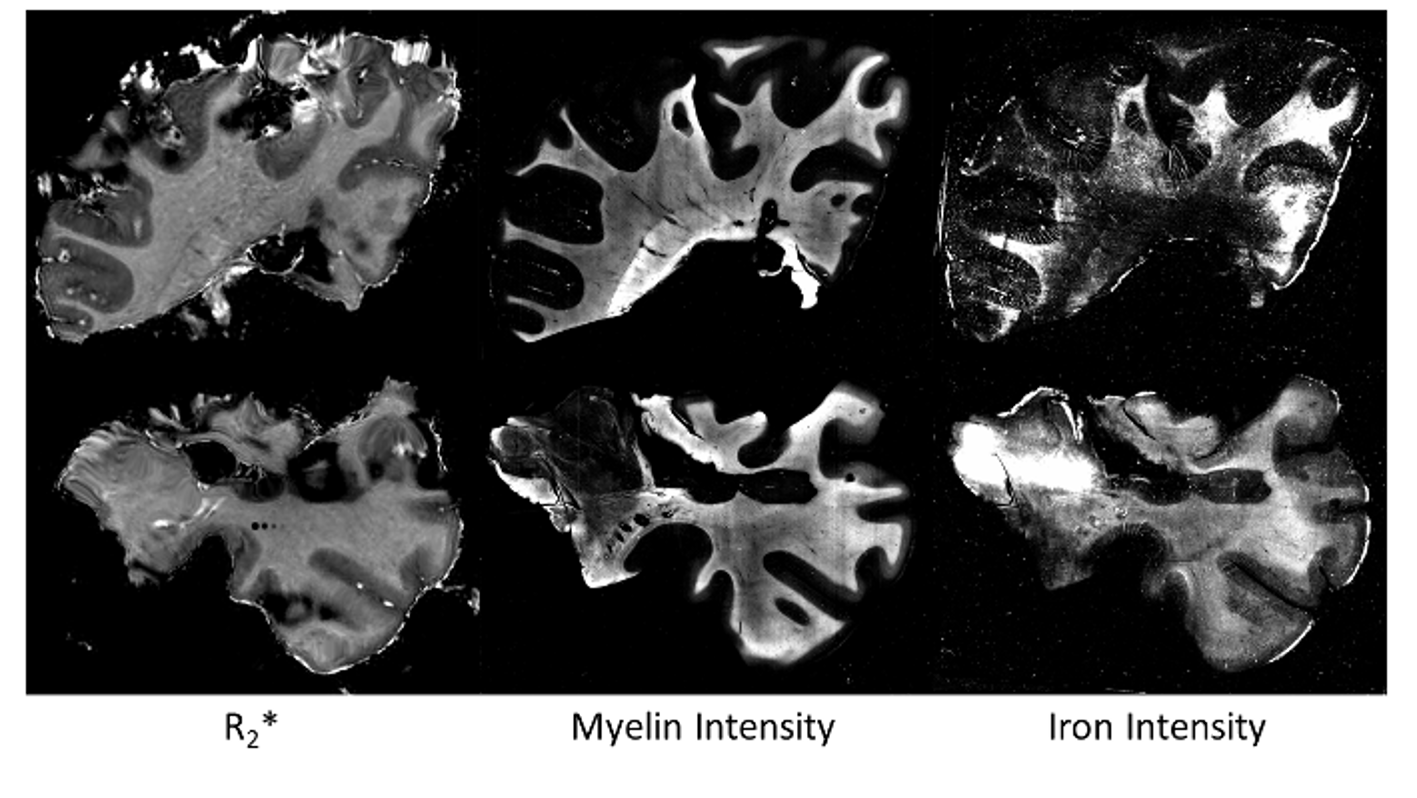
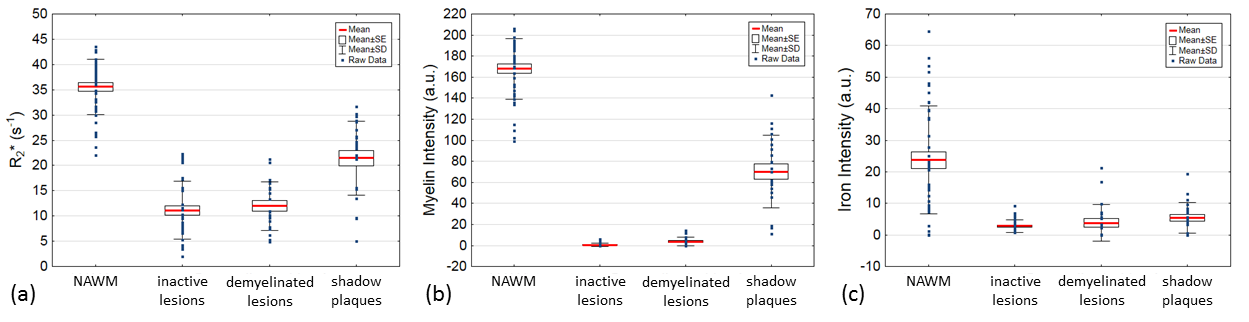
Two examples of R2* with corresponding iron and myelin intensity maps are shown in Figure 1. A total of 39 inactive lesions, 21 active demyelinating lesions, and 23 shadow plaques were identified. Additionally, 43 areas of NAWM were defined as reference. We observed reduced R2* values in all MS lesions when compared to NAWM (all p<0.001, Fig. 2). R2* distinguished shadow plaques in that R2* was significantly higher than in inactive lesions (p<0.001) and active demyelinating lesions (p<0.001), while there was no difference in R2* between inactive and active demyelinating lesions. In line with the R2* observations, iron and myelin densities were significantly lower in all lesion types compared to NAWM (all p<0.001), while no significant differences in iron staining were observed between lesion types. In contrast, myelin staining intensities were significantly higher in shadow plaques when compared to inactive lesions (p<0.001) and demyelinated lesions (p<0.001).Discussion
We combined R2* and histological analysis of post-mortem MS brain tissue to investigate the effect of iron and myelin densities on R2* in different types of MS lesions. Our results suggest that the overall R2* decrease in WM lesions compared to NAWM is driven by the combined decrease in iron and myelin density. Significantly increased R2* values in shadow plaques compared to inactive and active demyelinating lesions are in line with increased myelin density as the result of remyelination in shadow plaques. Our findings support current susceptibility-sensitive imaging studies that demonstrated that the degree of demyelination between MS lesions and surrounding NAWM drive the MR contrast8, not lesional iron content, as previously suggested9.Conclusion
We demonstrated that R2* even at 3T provides excellent sensitivity to detect remyelination in MS lesions. Furthermore we showed that the contrast of shadow plaques is driven by myelin density rather than by an increase in iron concentration.Acknowledgements
No acknowledgement found.References
1. Sedlacik J, Boelmans K, Löbel U, Holst B, Siemonsen S, Fiehler J. Reversible, irreversible and effective transverse relaxation rates in normal aging brain at 3T. Neuroimage 2013. doi: 10.1016/j.neuroimage.2013.08.051.
2. Walsh AJ, Lebel RM, Eissa A, Blevins G, Catz I, Lu J-Q, Resch L, Johnson ES, Emery DJ, Warren KG, Wilman AH. Multiple sclerosis: validation of MR imaging for quantification and detection of iron. Radiology 2013;267:531–42. doi: 10.1148/radiol.12120863.
3. Sati P, Cross AH, Luo J, Hildebolt CF, Yablonskiy DA. NeuroImage In vivo quantitative evaluation of brain tissue damage in multiple sclerosis using gradient echo plural contrast imaging technique. Neuroimage 2010;51:1089–1097. doi: 10.1016/j.neuroimage.2010.03.045.
4. Langkammer C, Krebs N, Goessler W, Scheurer E, Ebner F, Yen K, Fazekas F, Ropele S. Quantitative MR Imaging of Brain Iron : A Postmortem Validation Study. Radiology 2010;257:455–462. doi: 10.1148/radiol.10100495.
5. Oh S-H, Kim Y-B, Cho Z-H, Lee J. Origin of B0 orientation dependent R2(*) (=1/T2(*)) in white matter. Neuroimage 2013;73:71–9. doi: 10.1016/j.neuroimage.2013.01.051.
6. Li X, Harrison DM, Liu H, Jones CK, Oh J, Calabresi P a., van Zijl PCM. Magnetic susceptibility contrast variations in multiple sclerosis lesions. J. Magn. Reson. Imaging 2016;43:463–473. doi: 10.1002/jmri.24976.
7. Fernández-Seara M, Wehrli FW. Postprocessing technique to correct for background gradients in image-based R*(2) measurements. Magn. Reson. Med. 2000;44:358–66.
8.
Wiggermann
V, Hametner S, Hernandez-Torres
E, Kames C, Endmayr V, Kasprian G, Hoeftberger R, Li DKB, Traboulsee A,
Rauscher A. Susceptibility-sensitive MRI of multiple sclerosis lesions and the
impact of normal-appearing white matter changes. NMR
Biomed 2017;30(8)
Figures