1863
Quantitative MRI of diffusely abnormal white matter in multiple sclerosis at 3T1Radiology, University of British Columbia, Vancouver, BC, Canada, 2MS/MRI Research Group, University of British Columbia, Vancouver, BC, Canada, 3Medicine (Neurology), University of British Columbia, Vancouver, BC, Canada, 4Physics and Astronomy, University of British Columbia, Vancouver, BC, Canada, 5International Collaboration on Repair Discoveries, University of British Columbia, Vancouver, BC, Canada, 6Pathology & Laboratory Medicine, University of British Columbia, Vancouver, BC, Canada
Synopsis
Diffusely abnormal white matter (DAWM) is found in the brain of some multiple sclerosis (MS) and clinically isolated syndrome (CIS) subjects. DAWM has poorly defined boundaries, with signal intensity higher than normal appearing white matter (NAWM) but not as high as lesions on FLAIR, proton density and T2-weighted MRI. We compared results from myelin water imaging, T1 and diffusion basis spectrum imaging in areas of DAWM and corresponding areas of NAWM in 20 MS/CIS participants. No significant differences in measures sensitive to myelin, axons, oedema and inflammation were found, although trends for increased T1 and reduced fibre fraction were observed.
Introduction
Diffusely abnormal white matter (DAWM) is found in the brain of some multiple sclerosis (MS) and clinically isolated syndrome (CIS) subjects1,2,3. DAWM has poorly defined boundaries, with signal intensity higher than normal appearing white matter (NAWM) but not as high as lesions on fluid attenuated inversion recovery (FLAIR), proton density (PD) and T2-weighted MRI1,4. Histologically, DAWM shows blood-brain barrier breakdown, as well as myelin and axonal loss5,6,7,8. DAWM may have clinical implications as patients with DAWM reach more severe clinical disability levels as measured by the Expanded Disability Status Scale (EDSS), sooner than those without DAWM2,9.
A number of advanced MRI techniques exist that are sensitive to myelin, axons, oedema and inflammation and may give more information about the underlying tissue changes responsible for DAWM. The fraction of water within the myelin bilayers (myelin water fraction, MWF10) has been histopathologically validated as a marker for myelin11. T1 relaxation is closely related to water content12. Diffusion basis spectrum imaging (DBSI) models myelinated and unmyelinated axons as anisotropic diffusion tensors, and models cells and extracellular space as isotropic diffusion tensors to simultaneously quantify axonal injury, myelination, inflammation and oedema in the CNS13. Numerous measurements can be derived from the DBSI data including: axial diffusivity (related to axonal integrity), radial diffusivity (modulated by myelin)14, fibre fraction (a measure of the density of axons)15, isotropic restricted diffusion fraction (changes in cellularity resulting from inflammation) and the isotropic hindered diffusion fraction (increases with vasogenic oedema)15.
Previous studies of DAWM at 1.5T have found reduced magnetization transfer ratio and increases in T1, suggesting loss of tissue and increased water content16,17, reduced diffusion fractional anisotropy attributed to lower fibre ordering5 and decreases in myelin water fraction6, indicative of myelin loss. DAWM has not been examined with quantitative MR at 3T
Objective
To compare the MWF, T1, DBSI-derived measures and normalised brain volumes in MS subjects with and without DAWM at 3T.Methods
Subjects and MR Experiments: Twenty MS subjects (13 relapsing-remitting MS, 3 CIS, 3 secondary-progressive MS, 1 primary-progressive MS) were scanned on a 3T Philips scanner. Scanning sequences included a 48-echo GRASE T2 relaxation sequence (TR=1073ms, TE=8ms, 1x1x2.5mm3, 40 slices)18, a DBSI sequence (99 directions, range of b values=0-1500, TE=79ms, TR=4798ms, 2x2x2mm3, 40 slices)15, and structural proton-density (PD)-weighted (TR=2900ms, TE=8.42ms, 1x1x3mm3), T2-weighted (TR=2900ms, TE=80ms, 1x1x3mm3) and 3D T1-MPRAGE (TR=3000ms, TI=926ms, 1x1x1mm3) sequences for tissue identification.
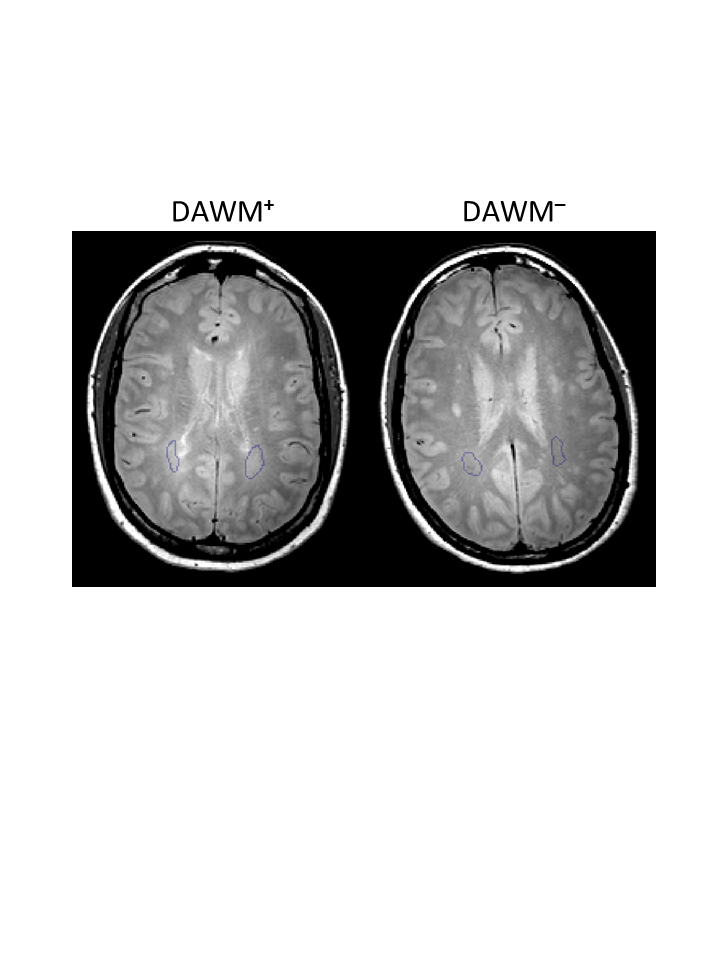
Data Analysis: PD and T2-weighted scans were used to stratify patients into those with DAWM (DAWM+) and without DAWM (DAWM–). T2 distributions were calculated for every voxel using a modified Extended Phase Graph algorithm combined with regularized non-negative least squares and flip angle optimization19,20, and MWF was defined as the fraction of signal with T2<40ms. T1 was fit to a single exponential using in-house software. DBSI data was analysed to calculate diffusivities, fibre fraction, hindered isotropic diffusion fraction and restricted isotropic diffusion fraction images21. Regions of interest (ROIs) were manually drawn around areas of DAWM in DAWM+ subjects and corresponding areas in DAWM– subjects on PD images (Figure 1). MWF, T1 and DBSI-derived images were registered to the PD image using FLIRT (FSL toolbox)22. ROIs were overlaid onto registered MWF, T1 and DBSI-derived images to obtain mean measurements. Normalised brain volume was determined using the 3DT1 images with in-house software23. Comparisons between values from DAWM+ and DAWM– participants were done using a Student's t-test.
Results
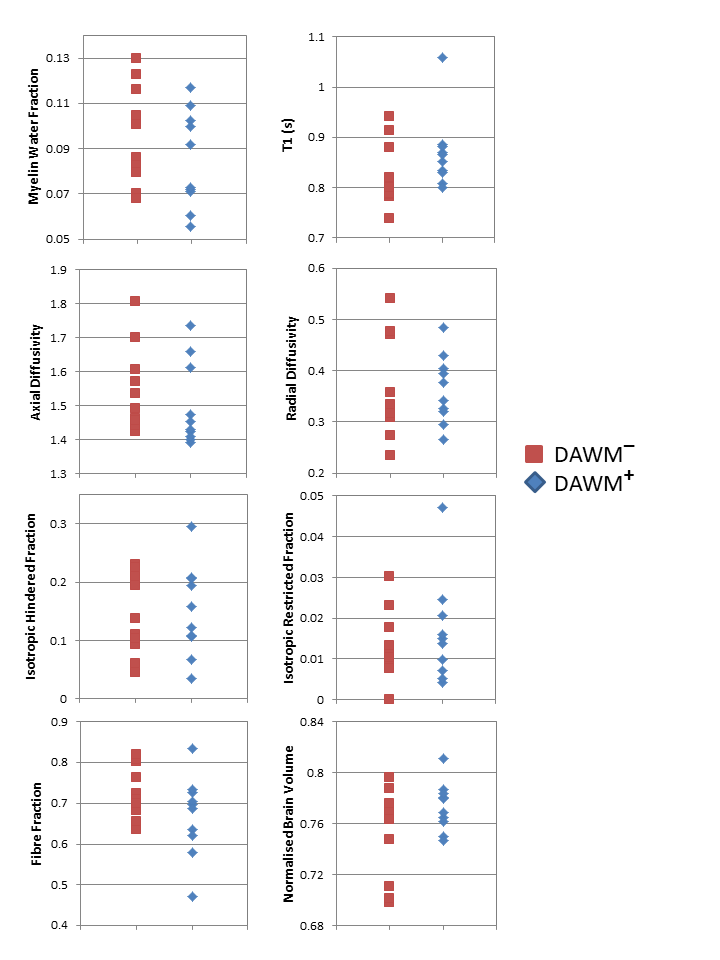
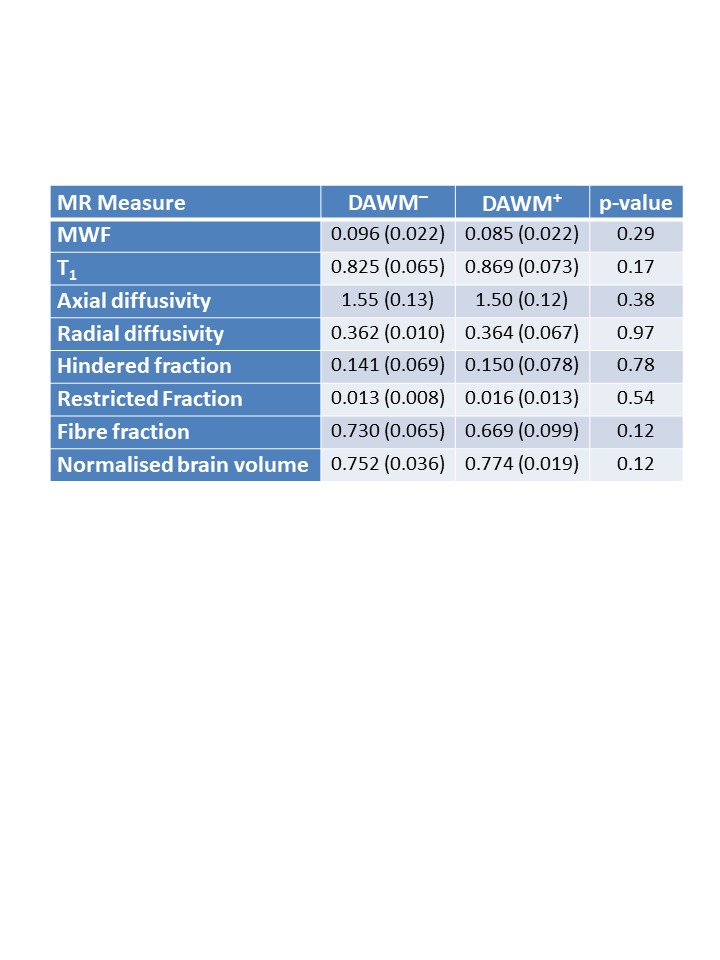
50% of subjects were DAWM+. DAWM+ subjects had a higher EDSS (median EDSS 3.5 vs. 2.0, p=0.37) but similar disease duration to DAWM– subjects (mean disease duration: 12.2y vs. 11.6y, p=0.87). Comparing ROIs from DAWM and non-DAWM, no significant differences were found in any MR measurement (Table 1). Plots of the data for each subject are shown in Figure 2.Conclusions
We found 50% of our MS participants showed DAWM in their brain MRI, which is double the rate of 25% previously reported at 1.5T1,2. In addition, contrary to previous studies conducted at 1.5T6,16,17, areas of DAWM at 3T did not show significant differences in MR measures sensitive to myelin, axons, oedema and inflammation, although trends for increased T1 and reduced fibre fraction were observed. Due to improved signal to noise ratio and resolution, DAWM identified at 3T likely includes additional mild abnormalities that would not be visible at 1.5T and would have formerly been classified as normal appearing white matter. Thus, 3T DAWM+ regions include less severe abnormalities, suggesting that larger sample sizes may be needed to detect differences between DAWM+ and DAWM– groups.Acknowledgements
We would like to thank the volunteers and their families and the MR technologists. This study is funded by the Multiple Sclerosis Society of Canada.References
1. Zhao GJ, Li DKB, Cheng Y et al. MRI dirty-appearing white matter in MS. Neurology 2000. 54(Suppl 3): A121.
2. Zhao G, Li DKB, Cheng Y et al. Possible prognostic significance of dirty-appearing white matter on MRI in multiple sclerosis. Mult Scler. 2003. 9 (Suppl 1):S61.
3. Laule C, Lee J, Zhao G, White R, Vavasour IM, Riddehough A, Traboulsee AL, Metz L, Li DKB. Prevalence of Diffusely Abnormal White Matter in Individuals with Clinically Isolated Syndromes Suggestive of Multiple Sclerosis. ISMRM, 2017, p788.
4. West J, Aalto A, Tisell A, Leinhard OD, Landtblom AM, Smedby Ö, Lundberg P. Normal appearing and diffusely abnormal white matter in patients with multiple sclerosis assessed with quantitative MR. PLoS ONE, 2014. 9(4): p. e95161.
5. Seewann A, Vrenken H, van der Valk P et al. Diffusely abnormal white matter in chronic multiple sclerosis: Imaging and histopathologic analysis. Arch Neurol. 2009. 66:601-609.
6. Laule C, Vavasour IM, Leung E, et al. Pathological basis of diffusely abnormal white matter: Insights from magnetic resonance imaging and histology. Mult Scler. 2011. 17:144-150.
7. Moore GRW, Laule C, MacKay AL, Leung E, Li DKB, Zhao G, Traboulsee AL, Paty DW.Dirty-appearing white matter in multiple sclerosis. J Neurol. 2008. 255(11): p.1802
8. Vos CM, Geurts JJ, Montagne L, et al. Blood-brain barrier alterations in both focal and diffuse abnormalities on postmortem MRI in multiple sclerosis. Neurobiol Dis. 2005. 20:953-960.
9. Lycklama-a-Nijeholt GJ, van Walderveen MA, Castelijns JA et al. Brain and spinal cord abnormalities in multiple sclerosis. Correlation between MRI parameters, clinical subtypes and symptoms. Brain. 1998. 121:687-697.
10. MacKay A, Whittall K, Adler J, et al. In vivo visualization of myelin water in brain by magnetic resonance. Magn Reson Med 1994; 31(6): 673-677.
11. Laule C, Kozlowski P, Leung E, et al. Myelin water imaging of multiple sclerosis at 7 T: correlations with histopathology. Neuroimage 2008; 40(4): 1575-1580.
12. Fatouros PP, Marmarou A, Kraft KA, et al. In Vivo Brain Water Determination by T1 Measurements: Effect of Total Water Content, Hydration Fraction, and Field Strength. Magn Reson Med 1991; 17(2): 402-413.
13. Wang Y, Wang Q, Haldar JP, et al. Quantification of increased cellularity during inflammatory demyelination. Brain 2011; 134: 3590–3601.
14. Song SK, Sun SW, Ju WK, et al. Diffusion tensor imaging detects and differentiates axon and myelin degeneration in mouse optic nerve after retinal ischemia. Neuroimage 2003; 20: 1714–22.
15. Wang Y, Peng Sun P, Wang Q, et al. Differentiation and quantification of inflammation, demyelination and axon injury or loss in multiple sclerosis. Brain 2015; 138: 1223–1238.
16. Ropele S, Strasser-Fuchs S, Augustin M, et al. A Comparison of Magnetization Transfer Ratio, Magnetization Transfer Rate, and the Native Relaxation Time of Water Protons Related to Relapsing-remitting Multiple Sclerosis. American Journal of Neuroradiology. 2000. 21(10): 1885-1891.
17. Ge Y, Grossman RI, Babb JS et al. Dirty-appearing white matter in multiple sclerosis: Volumetric MR imaging and magnetization transfer ratio histogram analysis. AJNR Am J Neuroradiol. 2003. 24:1935-1940.
18. Zhang J, Vavasour I, Kolind S, et al. Advanced Myelin Water Imaging Techniques for Rapid Data Acquisition and Long T2 Component Measurements. ISMRM 2015; p824.
19. Prasloski T, Mädler B, Xiang Q-S, et al. Applications of stimulated echo correction to multicomponent T2 analysis. Magn Reson Med 2012; 67: 1803–1814.
20. Whittall KP and MacKay AL. Quantitative interpretation of NMR relaxation data. J Magn Reson 1989; 84: 134–152.
21. Ellingson BM, Salamon N, Grinstead JW, et al. Diffusion tensor imaging predicts functional impairment in mild-to-moderate cervical spondylotic myelopathy. Spine J 2014; 14: 589–97.
22. M. Jenkinson, P.R. Bannister, J.M. Brady, and S.M. Smith. Improved optimisation for the robust and accurate linear registration and motion correction of brain images. NeuroImage, 17(2):825-841, 2002.
23. Wicks E, Chiu JPC, Tang LYW, Lam K, Riddehough A, Li DKB, Traboulsee A, and Tam R. Automatic Computation of Normalized Brain Volume on 3D T1-Weighted MRI Scans Without Registration to Standard Space, ISMRM 2015, 3750.
Figures