1861
Spinal Cord (C1 to T12) Demyelination Measured by Magnetization Transfer Imaging: Characteristics of Acute, Sub-Acute and Chronic Disease Phases1Boston Children's Hospital, Boston, MA, United States
Synopsis
The diagnostic utility of Magnetization Transfer Imaging (MTI) was tested in a large cohort of patients with transverse myelitis – a demyelinating myelopathy affecting the spinal cord. We measured the reproducibility of MTI in a pediatric clinical model, at different disease stages. Our results showed that obtaining repeatable measures in the entire spinal cord (C1 to T12) is feasible. Our findings also showed significant differences in MTR values between patients and healthy controls, and between three sub-groups of patients (acute, sub-acute and chronic disease phases).
Introduction
Objectives
Methods
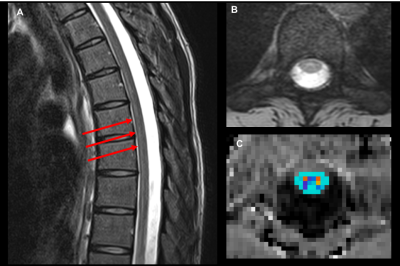
Subjects: 23 patients (mean age = 14.86±3.63 years) with spinal cord demyelinating myelopathies and 16 healthy controls (mean age = 14.64±4.10 years) were scanned. Patients were grouped by disease phase: acute (<1month, n=5 ), sub-acute (<1years, n=10 ) and chronic (<5 years, n=8). The patients had lesions spanning C1 to T12 spinal cord levels. Controls had no evidence of spinal cord pathology. Data acquisition: Subjects were scanned twice using a 3T MRI system. The imaging protocol included unenhanced T2-weighted images, and MTI (28 axial slices, FOV=180x180mm2, TR/TE=1190/4.37ms, 1.3x0.9x5mm3, 2 averages, and acquisition time=6min for each pulse sequence, flip angle=20°,BW=3800Hz/Px, pulse duration=9984μs, frequency offset=1200 Hz). MTI acquisition was applied axially in the anatomical location prescribed by the T2-weighted scan. Anesthesia, cardiac and/or respiratory gating were not used. The study was approved by the Institutional Review Board and written informed consent was obtained from all participants and/or parents. Data Analysis: Magnetization Transfer Ratio (MTR) calculations were performed using Spinal Cord Toolbox V3.0.84: (1) semi-automatic spinal cord segmentation, (2) manual vertebral labeling, (3) template registration on MR images and (4) MTR maps calculations and value extractions within regions of interest (Figure 1). MTR values were reported for all spinal cord levels. Lesion location was determined by clinical MRI and classified as “present” or “absent” for every spinal cord level. Statistical analysis: The method of generalized estimating equations (GEE) was performed between the patients and the controls to evaluate significant differences in mean MTR values. Reproducibility between scan 1 and scan 2 were established using the Intraclass correlation coefficients (ICC).Results
MTR values for the entire spinal cord are shown in Figure 2. MTR values in patients were on average 1.20 lower than in controls (P<0.001). Our findings showed strong agreement in MTR values between scan 1 and scan 2 for both patients and controls (Table 1). When examined by disease phase (Table 2), there was a statistically significant difference comparing controls and acute patients (P<0.001) and comparing controls and sub-acute patients (P<0.001). There was not a statistically significant difference in MTR between controls and chronic patients (P=0.868). When grouped by injury location (Figure 3), the comparison of injury vs. above injury was significant (P=0.011), above injury vs. below injury was significant (P=0.001), and at injury vs. below injury was not significant (P=0.288).Discussion
The clinical significance of MTI was examined in a large cohort of pediatric demyelinating myelopathies. Our results demonstrated the feasibility and test-retest reliability of MTI in the entire spinal cord (C1 through T12). Additionally, we found significant differences in MTR between patients and controls, and between three sub-groups of patients. Of note was our finding of no significant differences in MTR between controls and chronic patients. This could be explained by (1) remyelination occurring post-injury, or (2) patients having resolved lesions and MTI being unable to detect residual myelin damage. Additionally, we found significant differences in MTR between levels of injury and levels above injury. Our hypothesis is that damage to myelin could be a retrograde process in this rare disease model (transverse myelitis). Further analysis will include correlations between MTR and clinical symptoms, and between MTR and other imaging modalities. Our findings show that MTR could be a potential imaging biomarker to characterize the extent of myelin loss in myelitis, and could help reduce the uncertainty in diagnosing demyelinating myelopathies using conventional MRI.Acknowledgements
Research reported in this publication was supported by the Eunice Kennedy Shriver National Institute of Child Health and Human Development (NICHD), (K25, PI: Barakat).References
1. Verhey, L.H., Banwell, B.L., 2013. Inflammatory, vascular, and infectious myelopathies in children. Handb. Clin. Neurol. 112, 999–1017
2. Barakat N, Gorman MP, Benson L, Becerra L, Borsook D. Pain and spinal cord imaging measures in children with demyelinating disease. Neuroimage Clin. 2015;9:338-347.
3. Cohen-Adad J, El Mendili M, Lehéricy S, et al. Demyelination and degeneration in the injured human spinal cord detected with diffusion and magnetization transfer MRI. Neuroimage. 2011;55(3):1024-1033.
4. Cohen-Adad J et. Al. Spinal Cord Toolbox: an open-source framework for processing spinal cord MRI data. Proceedings of the 20th Annual Meeting of OHBM, Hamburg, Germany, 2014
Figures


