1859
Training induced myelin and iron changes in healthy subjects using novel quantitative MRI techniques1Spinal Cord Injury Center Balgrist, University Hospital Zurich, University of Zurich, Zurich, Switzerland, zürich, Switzerland, 2German Center for Neurodegenerative Diseases (DZNE), Magdeburg, Germany , magdeburg, Germany, 3Institute of Cognitive Neurology and Dementia Research, Magdeburg, Germany , Magdeburg, Germany, 4Department of Neurophysics, Max Planck Institute for Human Cognitive and Brain Sciences, Leipzig, Germany, leipzig, Germany, 5Department of Brain Repair and Rehabilitation, UCL Institute of Neurology, University College London, London, UK, london, United Kingdom, 6Wellcome Trust Centre for Neuroimaging, UCL Institute of Neurology, University College London, London, UK, london, United Kingdom
Synopsis
Activity-dependent plasticity has significant implications for healthy development, learning, memory, and recovery from brain damage. However, the exact time course and the neural mechanisms behind brain plasticity are still not completely understood. In this study, longitudinal quantitative MRI protocols were used to assess training associated microstructural changes using markers sensitive to myelin and iron. We show that training improvements during a sensorimotor task performed over 4 weeks induces linear and non-linear increases in myelin and iron content in the primary motor cortex and cerebellum. This study provides new tools to assess training effects in healthy controls.
Background
It was shown that training improvements relate to functional and volumetric changes in the brain of healthy subjects1,2. However, plasticity occurs also at the microstructural level. Quantitative MRI acquisitions are able to capture microstructural changes sensitive to myelin and iron content in-vivo. We used a multi-parameter mapping (MPM) protocol to investigate whether performance improvements during a motor task would induces microstructural changes related to myelin and iron content.Materials and Methods
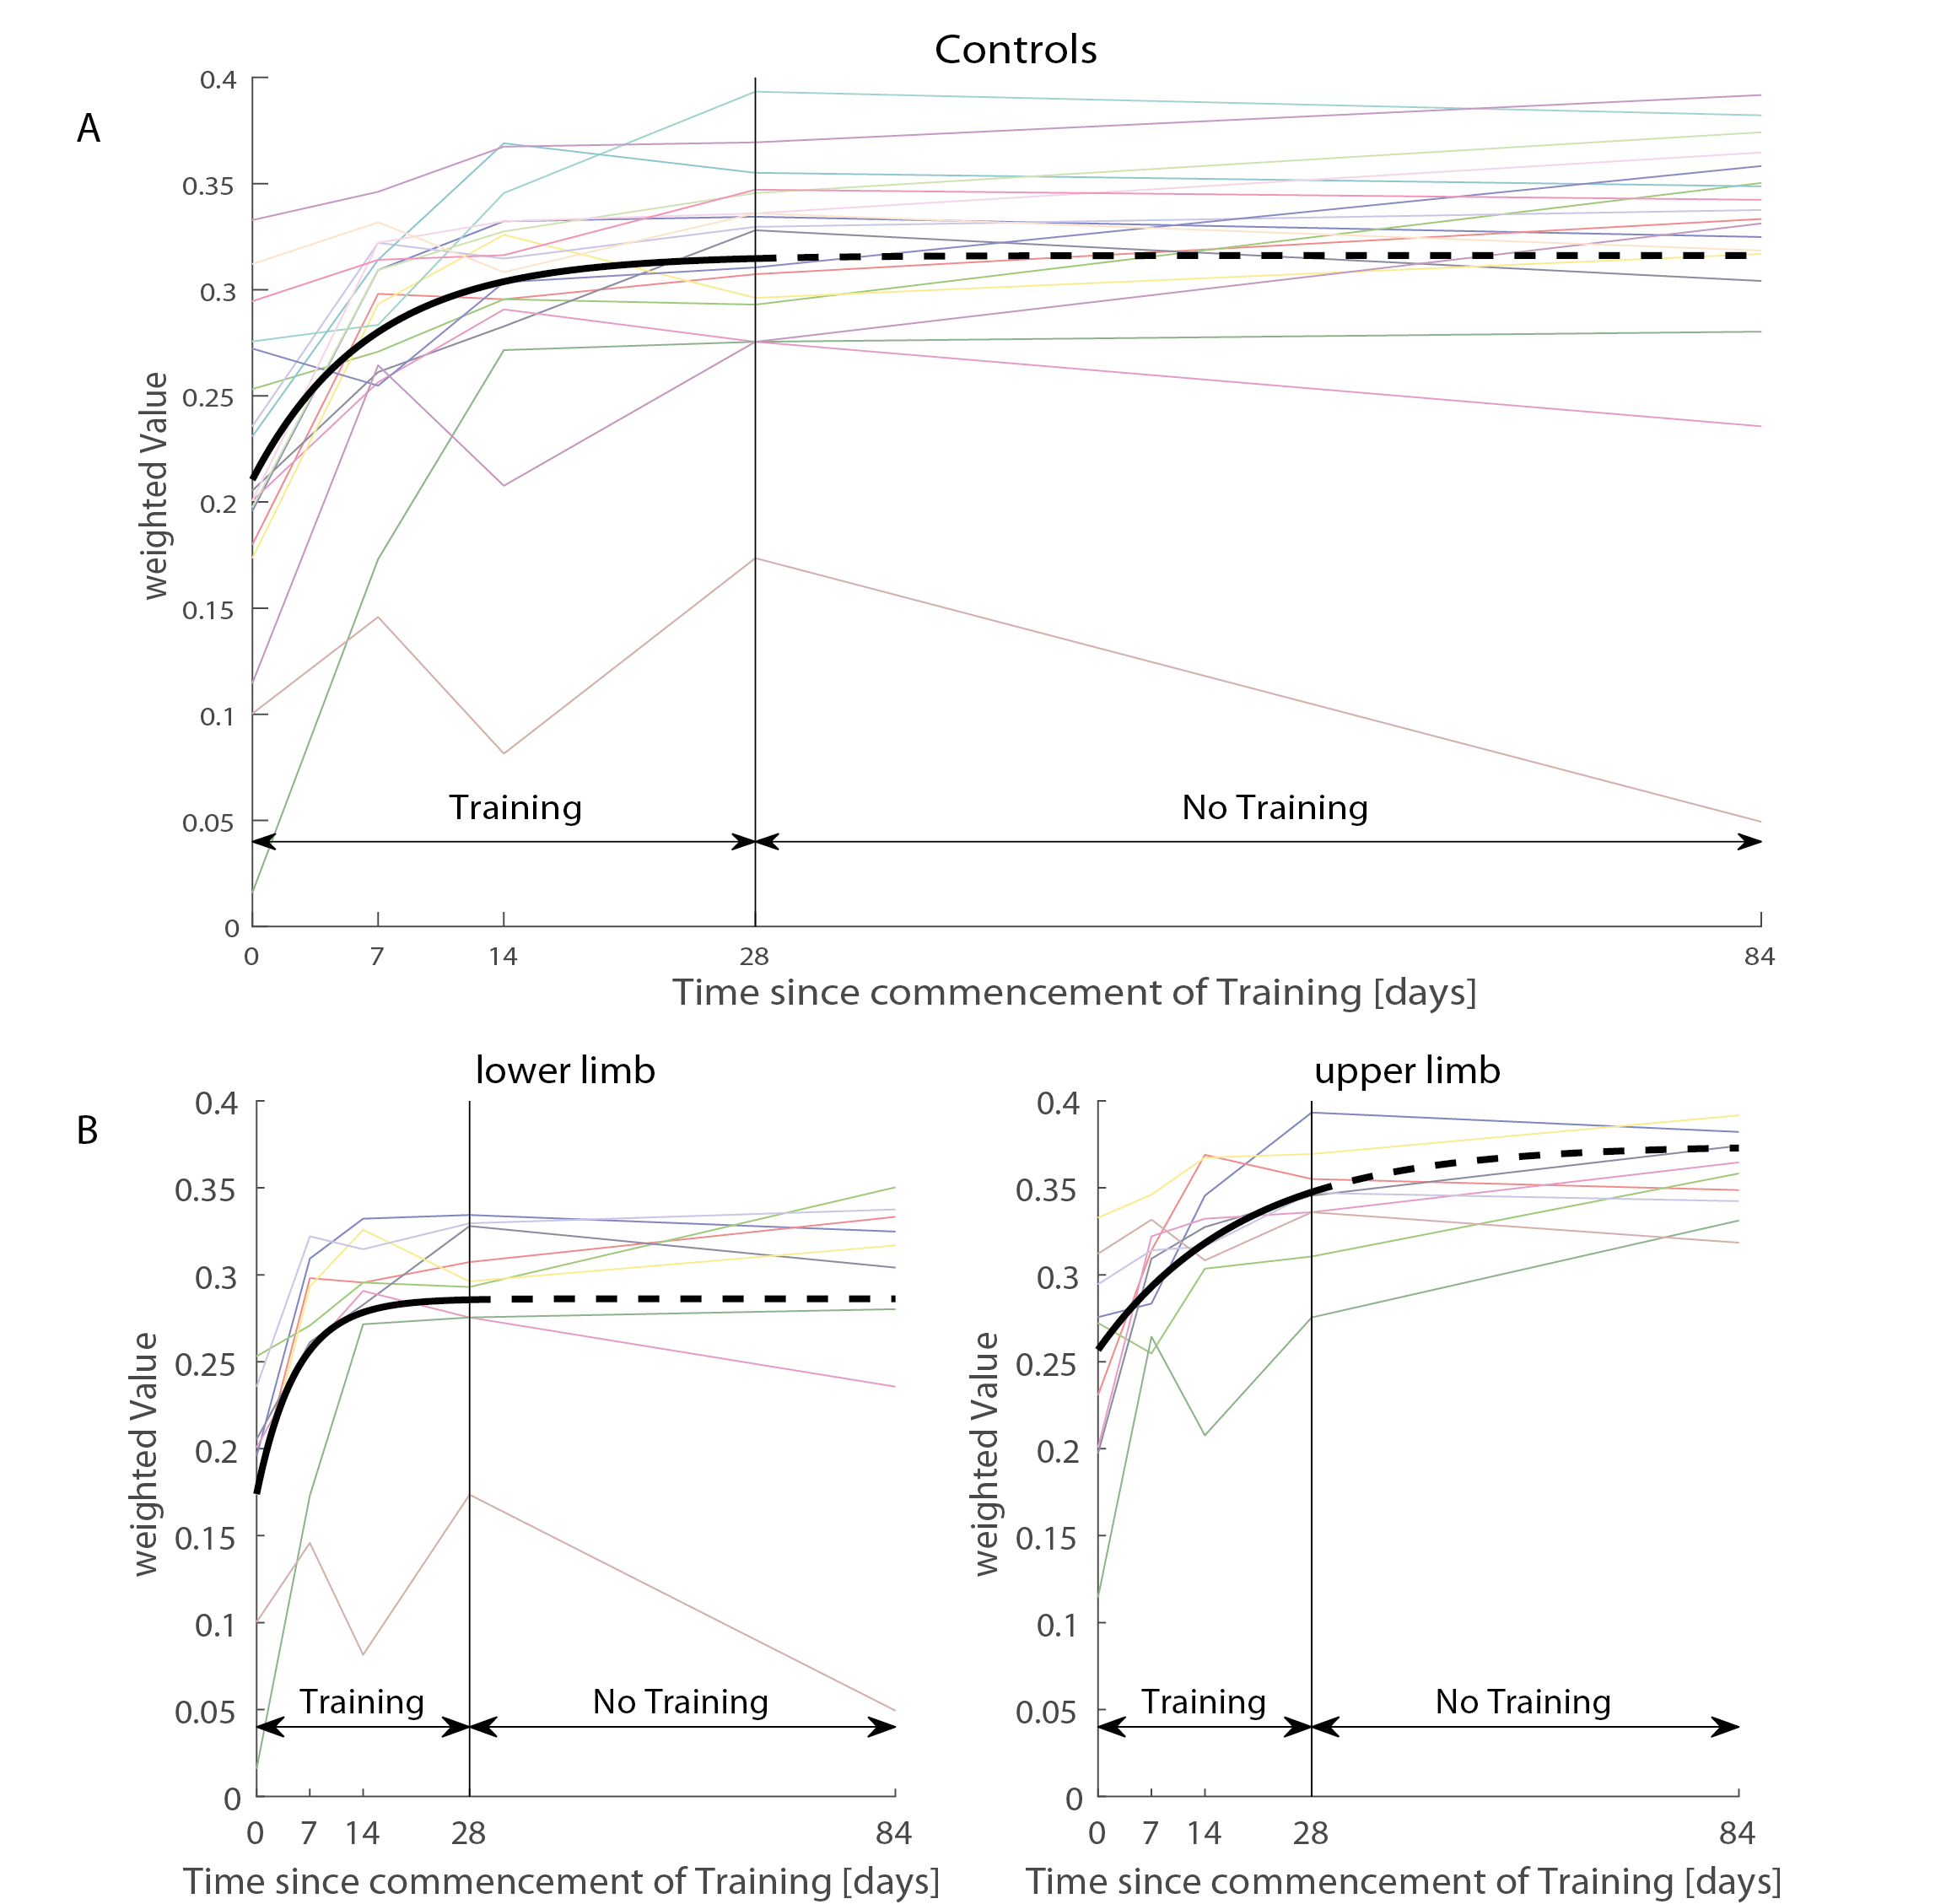
Thirty-two healthy controls underwent repeated MPM3,4 scans providing estimates of longitudinal relaxation rate (R1=1/T1), effective proton density (PD*), magnetization transfer saturation (MT) and effective transverse relaxation rate (R2*=1/T2*). The protocol for MPM involves acquisition of three images using a 3D multi-echo FLASH sequence (based on the Siemens "gre" FLASH product sequence) with the following sequence parameters: repetition times (TR) and flip angles (T1w: 25 ms/23°; PDw: 25/4° and MTw: 37 ms/9°). Participants were assigned to one of the following groups: upper limb training (n=9, age=34±10.22 years), lower limb training (n=9, age=38.67±13.22 years) and no training (n=14, age=38.71±10.98 years). The sensorimotor training was performed four times per week for 30 minutes each training session, and involved playing a game where buttons with different directions presented on a screen have to be accurately pressed on a platform with either their feet or hands (depending on the assigned group). At all MRI assessment time points, participants were also assessed in a within-game test where the accuracy of each button pressed was recorded. This behavioural data was analysed, first by classifying the fast pressed buttons (within a delay of 45ms) from the normal pressed buttons (within a delay of 90ms) and then by normalizing the sum by the total amount of buttons (1).
Weighted value= (2*fastPressedButtons+1*pressedButtons)/2*total amount of arrows (1)
In order to assess microstructural changes over the time, a longitudinal MRI acquisition was performed before (day 0), during the training period7,14,28 days, and at 84 days follow-up. Images were analysed using SPM 12 and pre-processed using a longitudinal voxel-based quantification (VBQ) pipeline5 and tissue-weighted smoothing with 5 mm full width at half maximum. The statistical analysis was computed using sandwich estimator toolbox (SwE6), with age and intracranial volume (TIV) as covariates of no interest. In order to identify persistent or transient plastic changes the model included linear and quadratic effects of time as in (2).
yi = Xiβ + Zibi +ϵ; (2)
where X = [intercept time time2 age TIV]
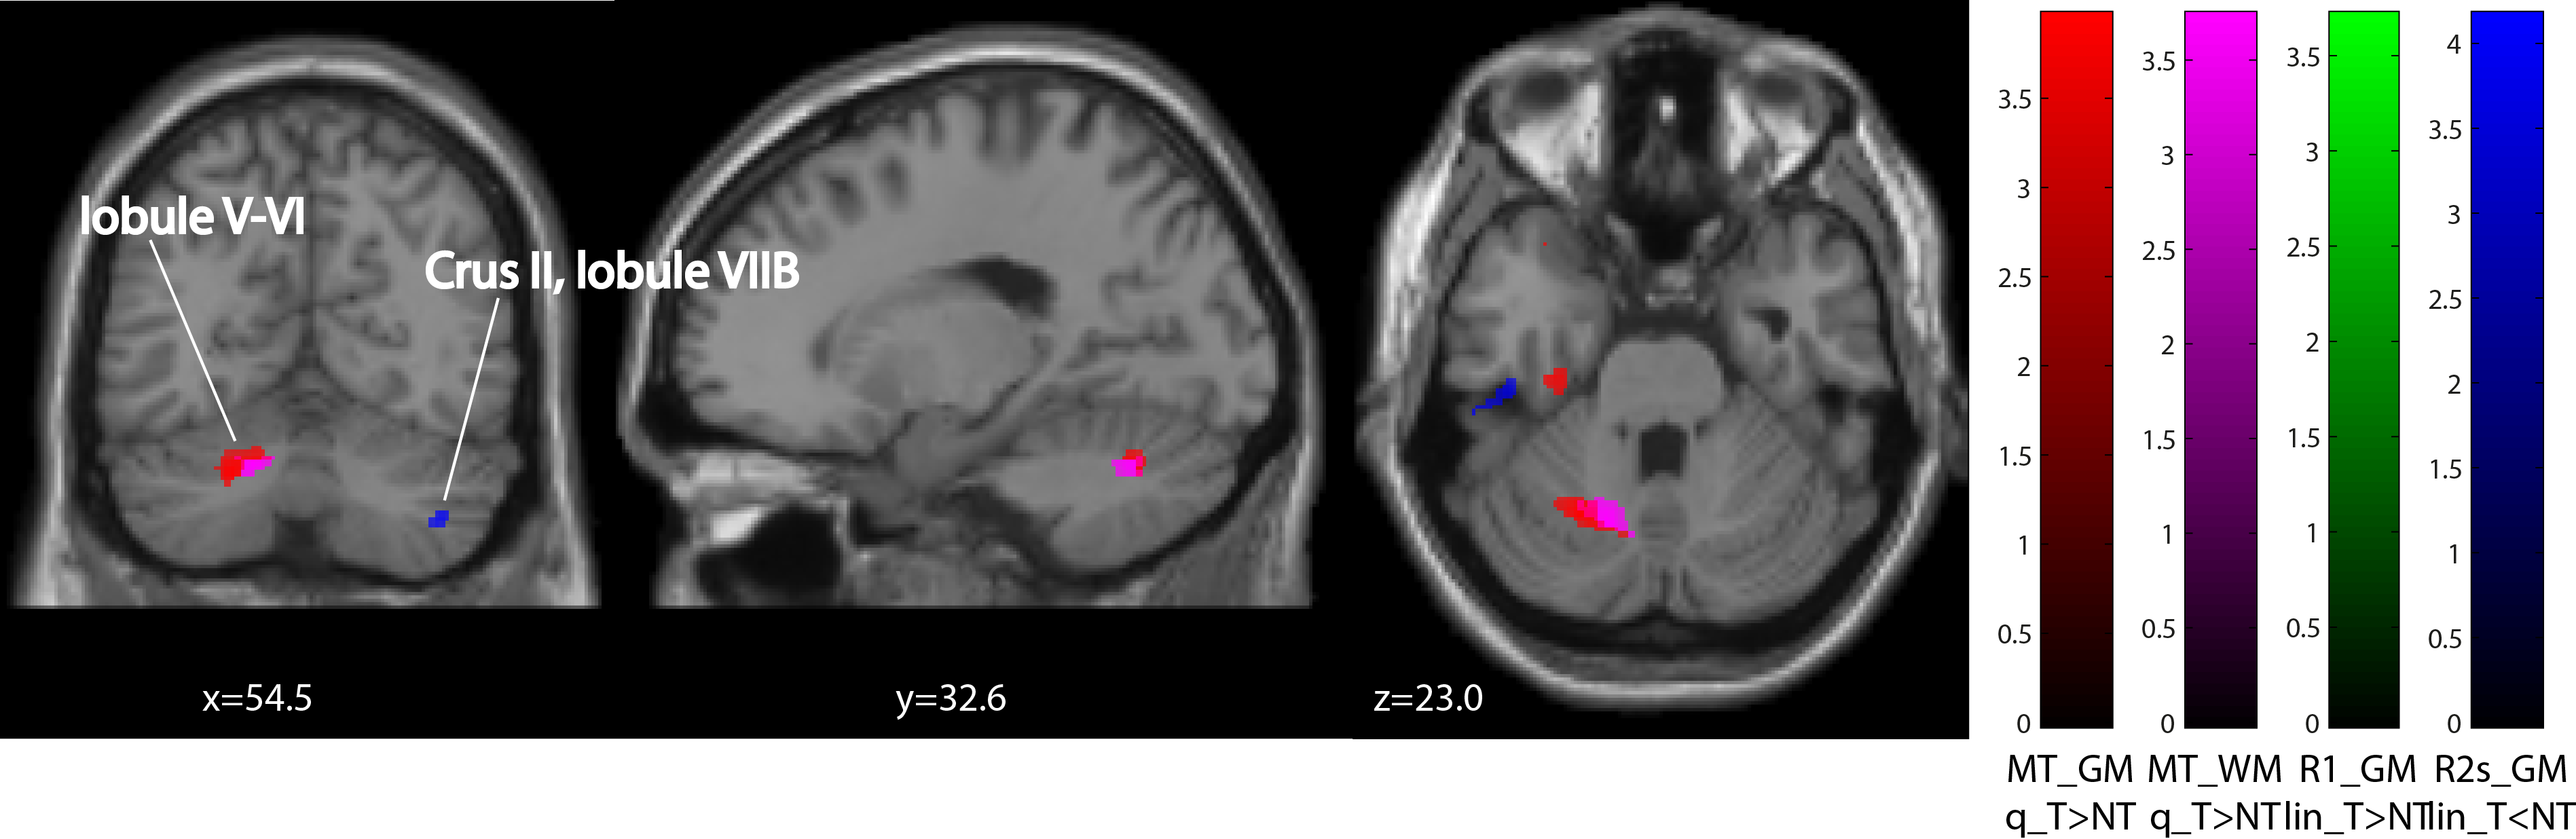
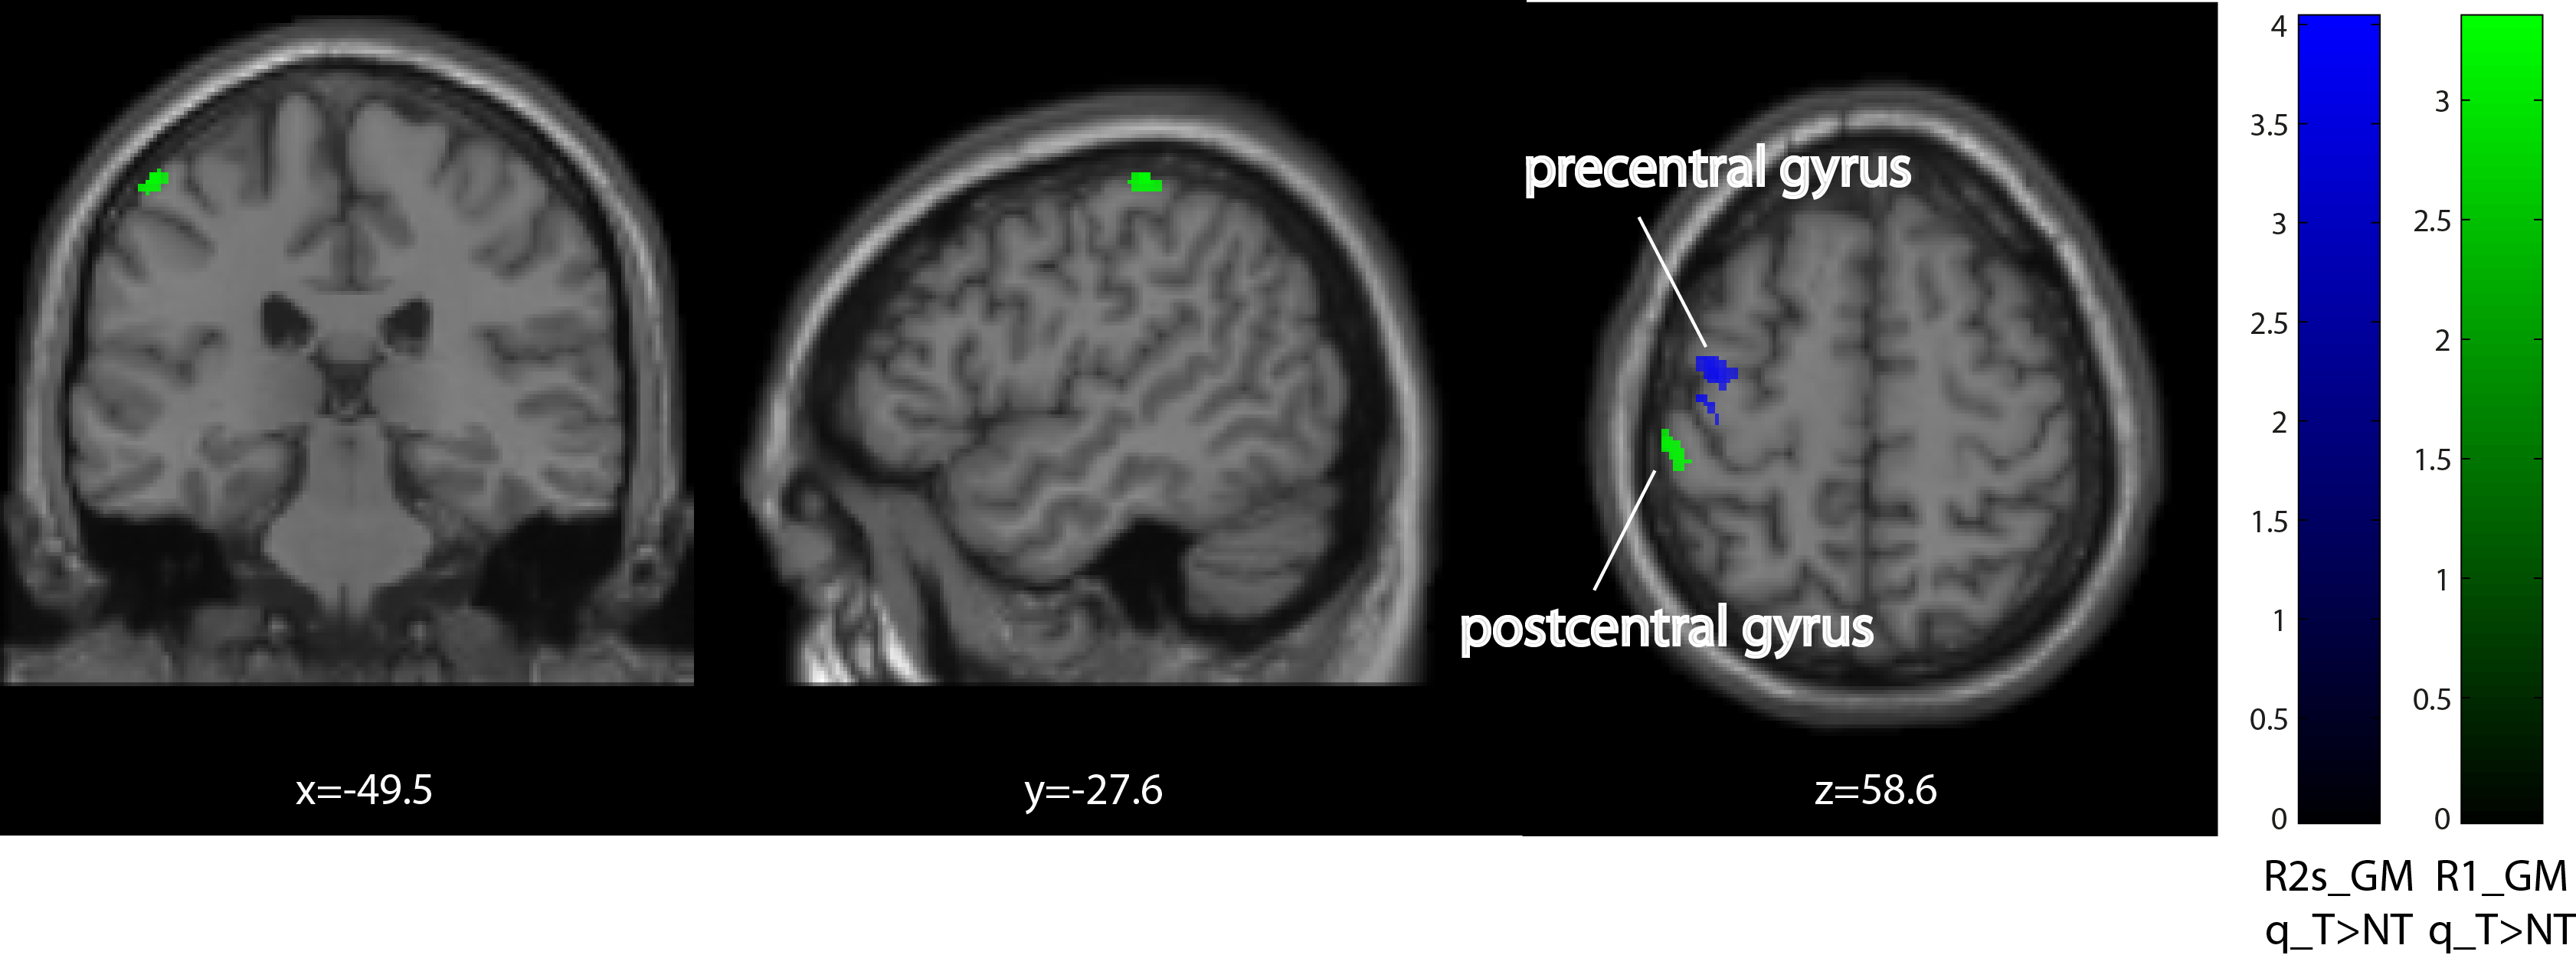
Based on previous neuroimaging evidence7–10, region of interest (ROI) were used to investigate the time course of changes within the cerebellum, corticospinal tract, and the pre- and postcentral gyrus.
Results
Behavioural analysis revealed that all subjects improved over time (p<0.001) (Figure1). The mean time constant (time to 63% of the final value) was 44days for the lower limb and 39days for upper limb Group. No significant difference was found between upper and lower limb training (p=0.8046). Over the training period, linear R1 increases were evident in the right cerebellum exterior (cluster extent: 86, z-scores: 3.7) and linear R2s decreases in Crus II and lobule VIIB in cerebellum (cluster extent: 93, z-scores: 3.64). MT increases accelerated (positive quadratic term) in Crus II and lobule VIIB in cerebellum (cluster extent: 261, z-scores: 3.96). We found accelerated R1 (left postcentral gyrus, cluster extent: 65, z-scores: 3.3) and in R2s increases (left precentral gyrus, cluster extent: 102, z-scores: 4.02) in the primary motor cortex. Behavioural data was related to MT increases in the left cerebellum (p=0.033).Discussion and conclusion
In this study, performance improvements during a motor task induced microstructural changes in quantitative markers sensitive to myelin and iron content in the cerebellum and motor cortex. The association between changes of performance and changes of myelin-sensitive MT suggest structural remodelling of the tissue reflecting neuroplasticity. The biological substrate underlying increased myelination might relate to reshaping of neuronal or glial processes, or strengthening of axonal connections. The localization of the microstructural changes fits with previous reports2 which reported volumetric changes following a motor task.Acknowledgements
No acknowledgement found.References
1. Draganski B, Kherif F, Lutti A. Computational anatomy for studying use-dependant brain plasticity. Front Hum Neurosci. 2014;8(June):380. doi:10.3389/fnhum.2014.00380.
2. Taubert M, Mehnert J, Pleger B, Villringer A. Rapid and specific gray matter changes in M1 induced by balance training. Neuroimage. 2016;133:399-407. doi:10.1016/j.neuroimage.2016.03.017.
3. Helms G, Dathe H, Kallenberg K, Dechent P. High-resolution maps of magnetization transfer with inherent correction for RF inhomogeneity and T1 relaxation obtained from 3D FLASH MRI. Magn Reson Med. 2008;60(6):1396-1407. doi:10.1002/mrm.21732.
4. Weiskopf N, Lutti A, Helms G, Novak M, Ashburner J, Hutton C. Unified segmentation based correction of R1 brain maps for RF transmit field inhomogeneities (UNICORT). Neuroimage. 2011;54(3):2116-2124. doi:10.1016/j.neuroimage.2010.10.023.
5. Ziegler G, Dahnke R, Gaser C. Models of the aging brain structure and individual decline. Front Neuroinform. 2012;6(March):1-16. doi:10.3389/fninf.2012.00003.
6. Guillaume B, Hua X, Thompson PM, Waldorp L, Nichols TE. Fast and accurate modelling of longitudinal and repeated measures neuroimaging data. Neuroimage. 2014;94:287-302. doi:10.1016/j.neuroimage.2014.03.029.
7. Makin TR, Scholz J, Filippini N, Slater DH, Tracey I, Johansen-berg H. structure and function in the former hand area. Nat Commun. 2013;4:1570-1578. doi:10.1038/ncomms2571.
8. Wrigley PJ, Press SR, Gustin SM, et al. Neuropathic pain and primary somatosensory cortex reorganization following spinal cord injury. Pain. 2009;141(1-2):52-59. doi:10.1016/j.pain.2008.10.007.
9. Draganski B, Moser T, Lummel N, et al. Decrease of thalamic gray matter following limb amputation. 2006;31:951-957. doi:10.1016/j.neuroimage.2006.01.018.
10. Freund PAB, Dalton C, Wheeler-kingshott CAM, et al. Method for Simultaneous Voxel-Based Morphometry of the Brain and Cervical Spinal Cord Area Measurements Using 3D-MDEFT. 2010;1247:1242-1247. doi:10.1002/jmri.22340.
Figures