1858
Reproducibility of Myelin Water Fraction for GRASE sequences with a varying SENSE factor1Department of Radiology & Nuclear Medicine, Maastricht University Medical Center, Maastricht, Netherlands, 2School for Mental Health and Neuroscience, Maastricht University Medical Center, Maastricht, Netherlands, 3Department of Behavioral Sciences, Epilepsy Center Kempenheaghe, Heeze, Netherlands
Synopsis
For myelin-water quantification to become a feasible method in a clinical setting a rapid whole brain coverage acquisition is required, as well as reproducible results. Therefore, this study aims to measure the reproducibility of the Gradient-Spin Echo (GRASE) sequence with and without utilizing parallel imaging with sensitivity coding (SENSE) to investigate the impact of the acceleration (e.g. increased SENSE factor).
Purpose
For myelin-water quantification to become a feasible method in a clinical setting a rapid whole brain coverage acquisition is required, as well as reproducible results. Previous studies have already shown that an accelerated multi-echo sequence allows whole brain coverage (20 slices with 5 mm thickness) in 5 minutes using a Gradient-Spin Echo (GRASE) sequence utilizing parallel imaging with sensitivity encoding (SENSE)1. However, the reproducibility of the GRASE sequence as well as the influence of the SENSE acceleration factor have not yet been investigated. This study aims to measure the reproducibility of myelin-water estimation using the GRASE sequence. Furthermore, the impact of the acceleration (e.g. increased SENSE factor) will be explored by assessing the agreement between the scans with different SENSE factors.Methods
Three male volunteers (aged 28-30) were scanned twice on a 3.0T unit (Philips Achieva) using multi-slice GRASE (Gradient-Spin Echo) sequences (TR = 3000 ms, 32 echo’s with 10 ms spacing, EPI factor = 3, Turbo factor = 32, 26 slices, voxel size = 1.5x1.5x4 mm) with a SENSE factor of 1 and 2, resulting in a duration of 14:06 min and 7:30 min per GRASE scan, respectively. To include variation related to repositioning, the volunteers were taken out of the scanner between the sessions. For anatomical reference and segmentation, T1-weighted three-dimensional (3D) turbo field echo (TFE) images were acquired (TR = 8.2 ms, TE = 3.7 ms, FA = 8°, 1 mm thick coronal slices).
For each volunteer, the second set of GRASE scans as well as the T1 image were registered to the TE = 10ms image of the first GRASE scan using SPM12. To correct for small spatial registration errors, a Gaussian kernel with a FWHM of 6 mm was used to smooth the images2.
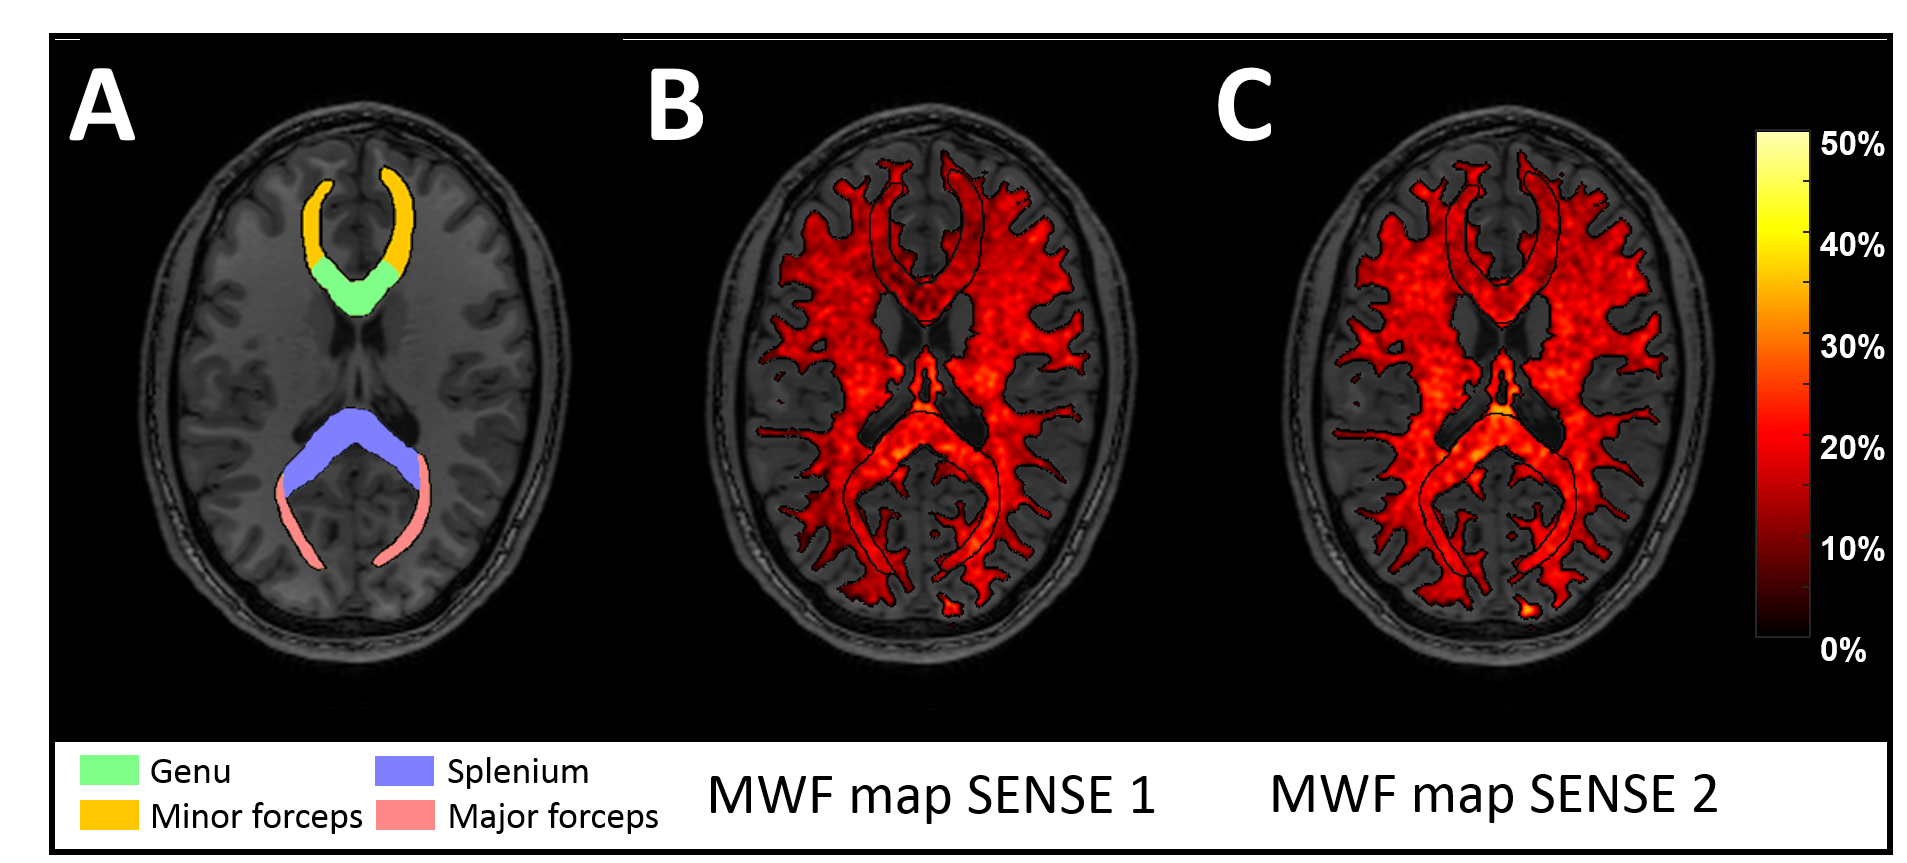
Four regions of interest (ROI) are delineated in the white matter: the splenium and genu of the corpus callosum and the major and minor forceps (Figure 1A). Myelin-water fraction (MWF) maps were obtained using the regularized non-negative least squares (NNLS) algorithm (Figure 1B & 1C). For this, a basis set of 120 logarithmically spaced T2 times between 10 and 3500ms was used to solve the NNLS. The Extended Phase Graph3 algorithm is used to correct for effects of B1 inhomogeneities.
To assess the agreement between the different scans the coefficient of variation (COV) and intraclass correlation coefficient (ICC)2 were determined for each ROI. The COV is the average within-subject standard deviation divided by the overall mean, where a low COV is indicative of a good reproducibility. The ICC is defined as the between-subject variation over the sum of between-subject and within-subject variation, it can therefore be used to assess whether the total variation is attributed to biological variation or measurement errors. For an ICC of >0.60 reproducibility is considered to be good4.
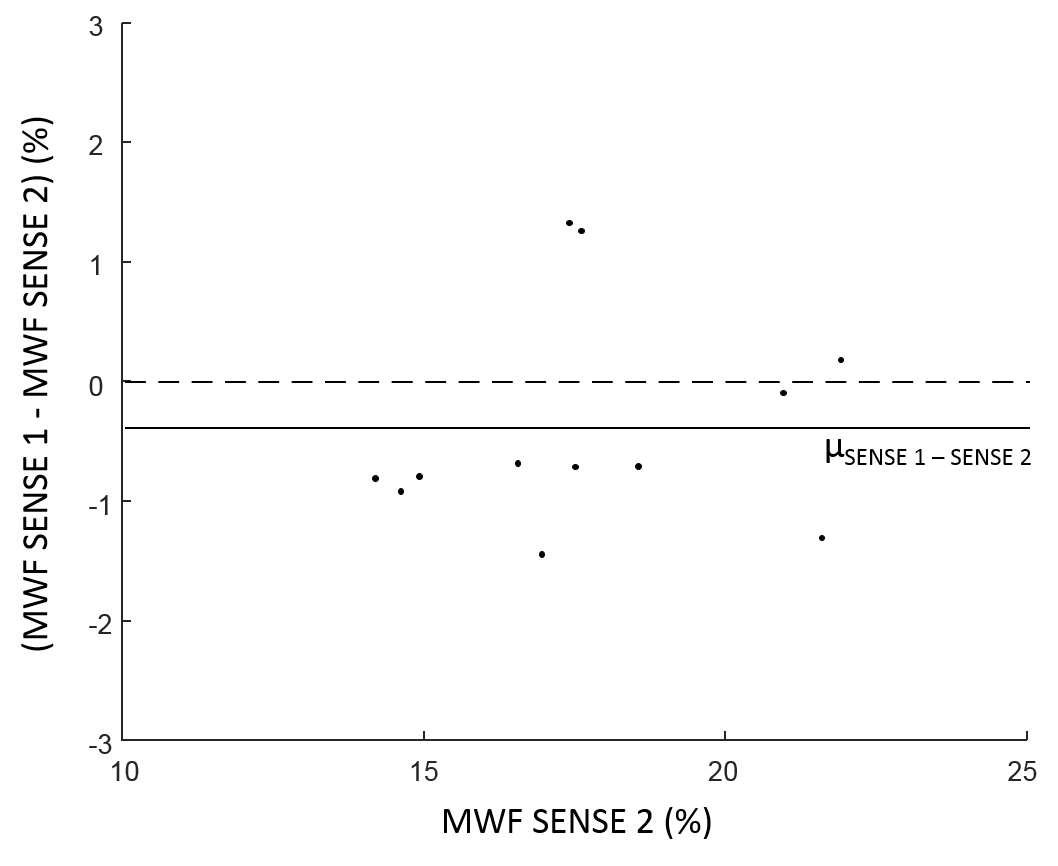
To investigate the impact of increased SENSE factor on the estimation of the MWF values, a difference plot (SENSE 1 - SENSE 2) of MWF values averaged over the two scan sessions is generated.
Results
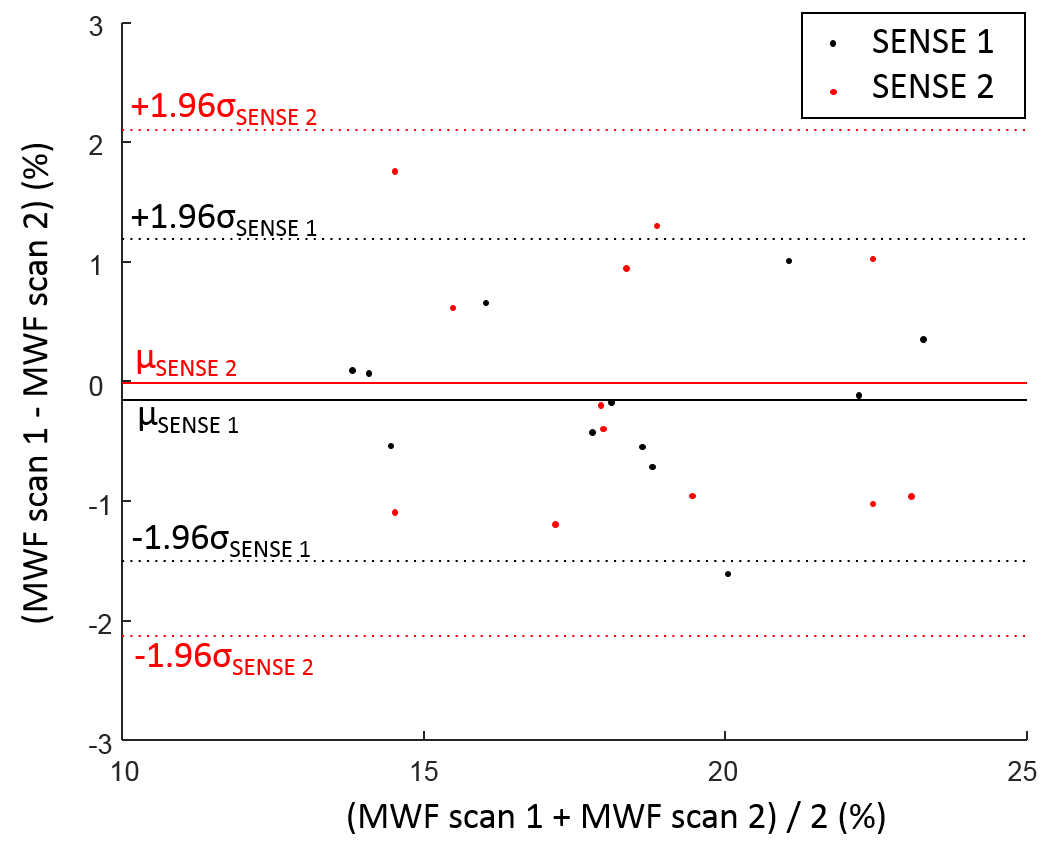
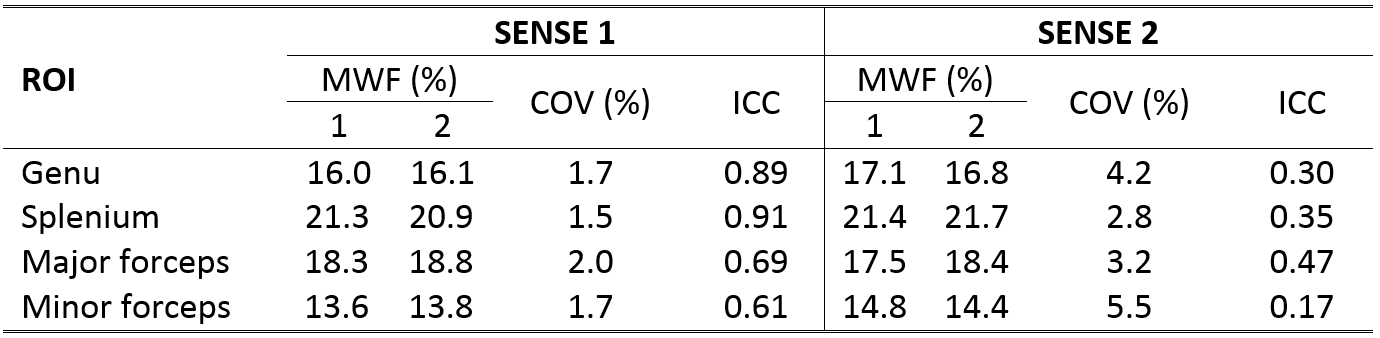
In Table 1 the average MWFs for each scan session (averaged over the population) and the reproducibility coefficients (COV and ICC) are shown for the four ROIs. A lower COV and a higher ICC are observed in the sequence with SENSE factor 1 compared to SENSE factor 2. In Figure 2 a Bland-Altman plot (mean both sessions vs difference both sessions)5 is shown to visualize the reproducibility of the SENSE factor 1 and SENSE factor 2 measurements. The 95% confidence intervals also reveal that MWFs obtained with SENSE factor 1 are better reproducible compared to SENSE factor 2.
Figure 3 shows the difference between MWFs scanned with SENSE factor 1 and SENSE factor 2 with respect to SENSE factor 2. The mean difference between SENSE 1 and SENSE 2 is 0.4%.
Discussion & Conclusion
The myelin-water quantification using the GRASE with SENSE factor 1 is better reproducible compared to the SENSE factor 2, as it shows a higher ICC and lower CV. Especially in the genu and splenium the SENSE factor 1 scan shows excellent reproducibility. For SENSE factor 2, the ICCs reveal poor to moderate reproducibility. Furthermore, the increased SENSE factor introduces a small bias (overestimation) in the MWF.
Concluding, the GRASE sequence with a SENSE factor of 1 shows good reproducibility, while the accelerated version (SENSE factor 2) should be used with caution, as it introduces additional noise which influences the reproducibility and the MWFs.
Acknowledgements
No acknowledgement found.References
1. Prasloski T, Rauscher A, MacKay A, et al. Rapid whole cerebrum myelin water imaging using a 3D GRASE sequence. NeuroImage. 2012;63:533-539
2. Jansen J, Kooi M, Kessels A, et al. Reproducibility of quantitative cerebral T2 relaxomtery, diffusion tensor imaging, and 1H magnetic resonance spectroscopy at 3.0 tesla. Investigative radiology. 2007;42(6):327-337
3. Hennig J. Multiecho imaging sequences with low refocusing flip angles. J Magn Reson. 1988;78:397–407.
4. Domenic V. Guidelines, criteria, and rules of thumb for evaluating normed and standardized assessment instruments in psychology. Psychological Assessment. 1994;6(4):284-290.
5. Bland J, Altman D. Statistical methods for assessing agreement between two methods of clinical measurement. Lancet. 1986;1:307–310.
Figures