1854
Multicomponent relaxation analysis of myelin in the brains of rare progressive solitary sclerosis, compared to multiple sclerosis and healthy control subjects in vivo1Department of Medicine (Neurology), University of British Columbia, Vancouver, BC, Canada, 2Department of Radiology, University of British Columbia, Vancouver, BC, Canada
Synopsis
Progressive solitary sclerosis (PSS) presents with an isolated demyelinating lesion along the corticospinal tract that results in progressive motor deficits. We used mcDESPOT-derived parameters to better understand the pathology in the normal-appearing white matter tracts (WMT) of PSS compared to relapsing-remitting multiple sclerosis (RRMS) and healthy control (HC) subjects. Overall, we found a trend of lower MWF (myelin content) and higher qT1 (inflammation/edema) in WMT in PSS, compared to RRMS and HC subjects. This suggested that there might be more extensive myelin damage in the normal-appearing brain, beyond the lesional site, that may be driving disease progression in PSS.
Introduction
Progressive solitary sclerosis (PSS) is a rare entity that is characterized by a spatially isolated T2 hyperintense lesion along the corticospinal tract, typically in the cervical spinal cord or the brainstem1-7. This single demyelinating lesion is thought to be responsible for progressive motor impairment, which may also present in multiple sclerosis (MS)1-7. However, PSS does not fulfill the current international diagnostic criteria for MS due to the absence of dissemination of lesions in time and space1,2,4. To date, advanced imaging measurements have not been studied in PSS subjects. Furthermore, there are currently no effective treatments for PSS2,4. Therefore, there is an unmet need to explore imaging markers that may provide better understanding of the pathogenesis and clarify whether PSS is a spatially limited variant of MS or a distinct entity. Study of PSS could also yield a valuable insight into progressive MS pathophysiology. We aimed to study the underlying pathology in the normal-appearing brain white matter tracts, using multi-component driven equilibrium single pulse observation of T1/T2 (mcDESPOT)8. We measured myelin water fraction (MWF) and single-component T1 (qT1) in PSS, compared to relapsing-remitting MS (RRMS) and healthy control (HC) subjects. These measures are suggested to represent myelin content and total water content related to inflammation/edema, respectively9.Methods
mcDESPOT data (1.7x1.7x1.7mm, whole brain) were acquired10 for 3 PSS subjects (mean age 53 y (range 49-60y)), using a 3 T scanner. Two subjects had a solitary lesion in the cervical cord and one subject had a lesion in the medullary brainstem. They did not have any other central nervous system demyelinating lesions or additional relapses. We compared this data to the data of 20 RRMS (43y (25-58y); median Expanded Disability Status Scale (EDSS, ranging from 0=normal function to 10=death) 2.0 (0.0-4.0)) and 29 HC (40y (24-60y)) subjects collected by Kolind et al10, using the same MRI protocol. We obtained white matter tracts (left and right corticospinal tract, corpus callosum, and superior longitudinal fasciculus) regions of interest (ROIs) from standard atlases in MNI space and transformed into mcDESPOT space using FMRIB Software Library (FSL)’s combined FMRIB’s Linear Image Registration Tool (FLIRT) and FMRIB’s Non-Linear Image Registration Tool (FNIRT)11-13. Mean MWF and qT1 values were calculated in each ROI. Unpaired two-sample Mann-Whitney test was performed on R to compare between groups.Results
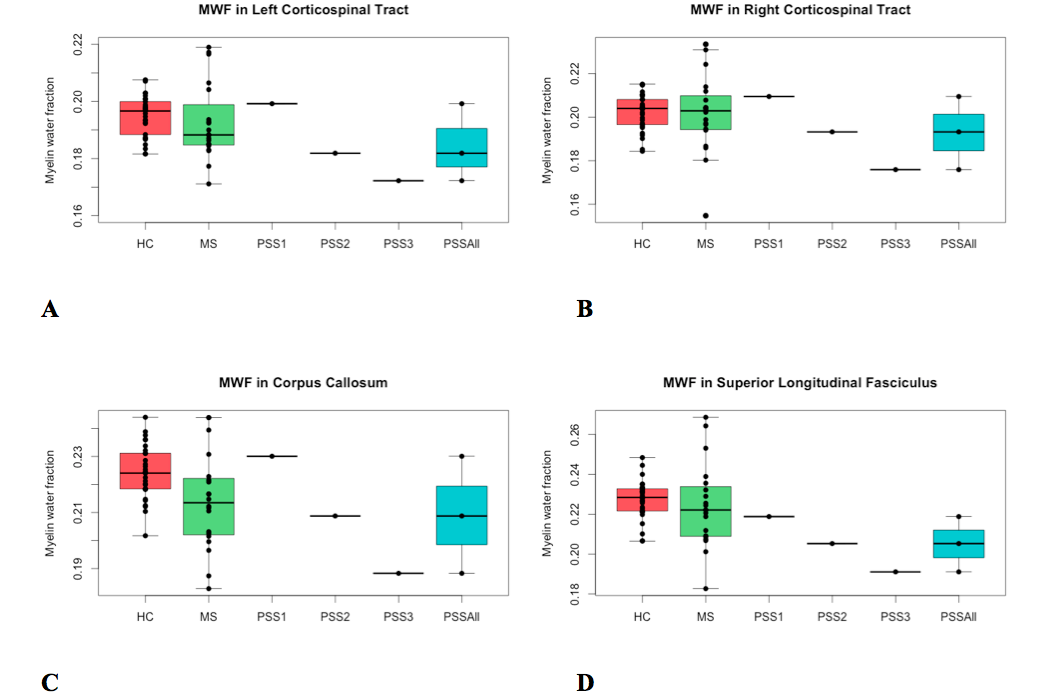
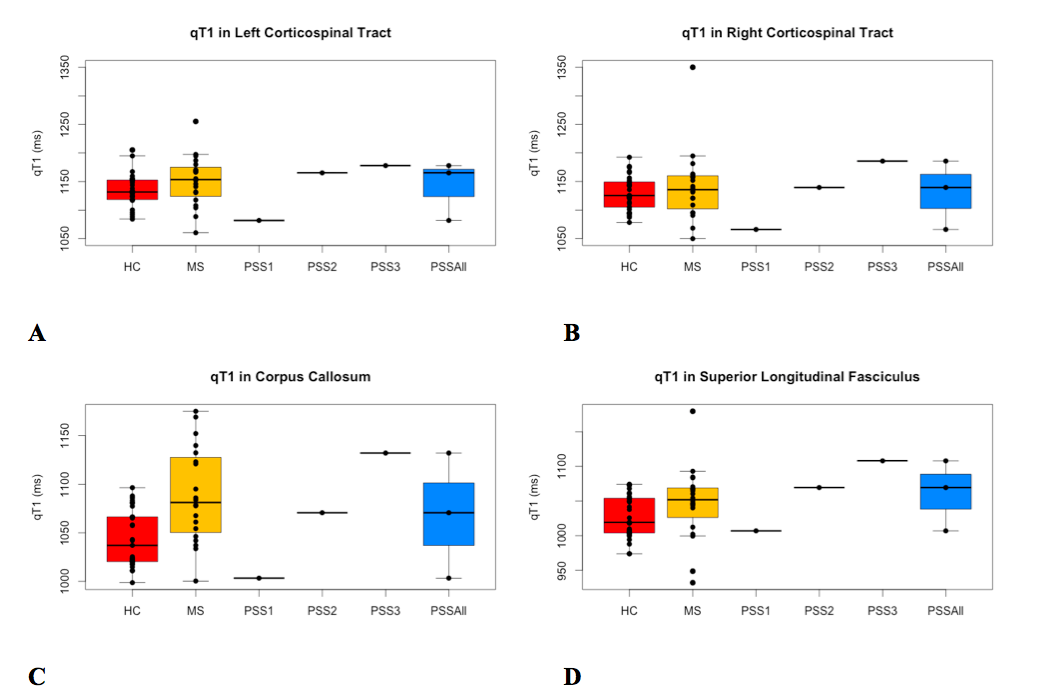
GROUP COMPARISON (Fig. 1, 2): For all regions assessed, there was a trend of lower MWF and higher qT1 (significantly lower MWF (p=0.01) and higher qT1 (p=0.001) in corpus callosum only) in RRMS compared to HC. In all ROIs, there was a trend of lower MWF (significantly in superior longitudinal fasciculus, p=0.004) and higher qT1 in PSS compared to HC. The MWF and qT1 were similar between PSS and RRMS.
CASE COMPARISON (Fig. 1, 2): There was heterogeneity between individual PSS subjects. PSS1 with the lowest disability score (EDSS=3.5) had MWF higher than RRMS and similar to HC (except superior longitudinal fasciculus where MWF was lower than RRMS and HC). PSS2 (EDSS=5.0) and PSS3 (EDSS=7.0) had lower MWF than HC and RRMS. For example, in the corpus callosum, PSS1, PSS2, and PSS3 had MWF of 0.230, 0.209, 0.188, respectively, compared to RRMS (0.214±0.017) and HC (0.224±0.010). The pattern for qT1 was similar, with higher values overall in PSS compared to HC, overlapping with RRMS except for PSS1 where qT1 was lower than HC and RRMS.
Discussion
The cross-sectional results showed that PSS subjects have lower myelin content and greater inflammation/edema in the normal-appearing white matter tracts, compared to HC subjects, and overlaps with findings seen in RRMS. The PSS subject with the lowest disability score had the least amount of abnormal MWF and qT1 findings. The PSS subjects with the greater disability had considerably greater decreases in MWF and increases in qT1. Despite a single lesion along the corticospinal tract, there may be more extensive myelin damage in the normal-appearing white matter in brain. This data suggests more widespread demyelination than what is apparent on conventional MRI imaging. The limitation includes a small sample size of rare PSS cases, as this was a pilot, exploratory study; thus, further study is warranted.Conclusion
The mcDESPOT-derived measures in the normal-appearing white matter tracts showed that although there is a single, demyelinating lesion along the corticospinal tract, there could be widespread myelin damage in the normal-appearing brain in PSS patients that might be responsible for disease progression and clinical disability. Advanced imaging techniques, such as mcDESPOT, could be valuable to provide an improved understanding of PSS pathogenesis in vivo.Acknowledgements
This research was supported by the UBC MRI Research Group. We would like to sincerely thank all participants and the MR technologists at the UBC MRI Research Centre. We would also like to thank Dr. Irene Vavasour for helpful discussions.References
1. Keegan BM, Kaufmann TJ, Weinshenker BG, et al. Progressive solitary sclerosis: gradual motor impairment from a single CNS demyelinating lesion. Neurology. 2016;87(16):1713-1719.
2. Rathnasabapathi D, Elsone L, Krishnan A, et al. Solitary sclerosis: progressive neurological deficit from a spatially isolated demyelinating lesion: a further report. J Spinal Cord Med. 2015;38(4):551-555.
3. Lattanzi S, Logullo F, Di Bella P, et al. Multiple sclerosis, solitary sclerosis or something else? Mult Scler. 2014;20(14):1819-1824.
4. Schmalstieg WF, Keegan BM, Weinshenker BG. Solitary sclerosis: progressive myelopathy from solitary demyelinating lesion. Neurology. 2012;78(8):540-544.
5. Cohen M, Lebrun C, Ayrignac X, et al. Solitary sclerosis: experience from three French tertiary care centres. Mult Scler J. 2015;21(9):1216.
6. Ayrignac X, Carra-Dalliere C, Homeyer P, et al. Solitary sclerosis: progressive myelopathy from solitary demyelinating lesion. A new entity? Acta Neurol Belg. 2013;113(4):533-534.
7. Lebrun C, Cohen M, Mondot L et al. A case report of solitary sclerosis: this is really multiple sclerosis. Neurol Ther. 2017;doi:10.1007/s40120-017-0082-8.
8. Deoni SCL, Rutt BK, Arun T, et al. Gleaning multicomponent T1 and T2 information from steady-state imaging data. MRM. 2008;60(6):1372-1387.
9. Kolind S, Deoni SCL. Rapid three-dimensional multicomponent relaxation imaging of the cervical spinal cord. MRM. 2011;65(3):551-556.
10. Kolind S, Vavasour I, Rauscher A, et al. Myelin-related advanced MRI demonstrates different degrees of change between various white matter tracts in MS. Neurology. 2014;82(10):Supplement S44.004.
11. Jenkinson M, Bannister P, Brady M, et al. Improved optimization for the robust and accurate linear registration and motion correction of brain images. Neuroimage. 2002;2:825-841.
12. Smith SM, Jenkinson M, Woolrich MW, et al. Advances in functional and structural MR image analysis and implementation as FSL. Neuroimage. 2004;23:Suppl:S208-S219.
13. Andersson JLR, Jenkinson M, Smith S. Non-linear registration, aka spatial normalization. 2010. FMRIB technical report TR07JA2.
Figures