1852
Effect of aldehyde fixation on the myelin water fraction measurements in rat cervical spinal cord1Radiology, University of British Columbia, Vancouver, BC, Canada, 2ICORD, Vancouver, BC, Canada, 3Physics and Astronomy, University of British Columbia, Vancouver, BC, Canada, 4UBC MRI Research Centre, Vancouver, BC, Canada, 5Zoology, University of British Columbia, Vancouver, BC, Canada
Synopsis
This study investigated the effect of tissue fixation on myelin water fraction (MWF), an MR derived measurement of myelin content. MWF was found to increase during aldehyde fixation due to an increase in myelin water. Differences in MWF between immersion fixation and perfusion fixation with immersion post-fixation were quantified. This study demonstrated that the measured MWF is sensitive to the changes induced by chemical fixation. The results bridge the interpretation of MWF in the in vivo situation to that of the ex vivo situation and provide a guideline for designing MWF studies with histological validation.
Introduction
Myelin content is often measured by fitting a series of T2 weighted images to a multi-exponential model. In the central nervous system, two peaks are usually found in the T2 distribution: one with lower T2 associated with the water trapped in the myelin lipid bilayers, and one with longer T2 associated with the intra/extracellular water1. The integral under the myelin water peak over the total integral is the myelin water fraction (MWF), which correlates well to myelin content, both in vivo and ex vivo2–9.
Typically, ex vivo studies utilize chemical fixation with an aldehyde fixative to stabilize the tissue, but the process produces complex changes that can greatly affect the T2 distribution and the measured MWF.
This study aims to track the changes in MWF and associated parameters during aldehyde fixation.
Methods
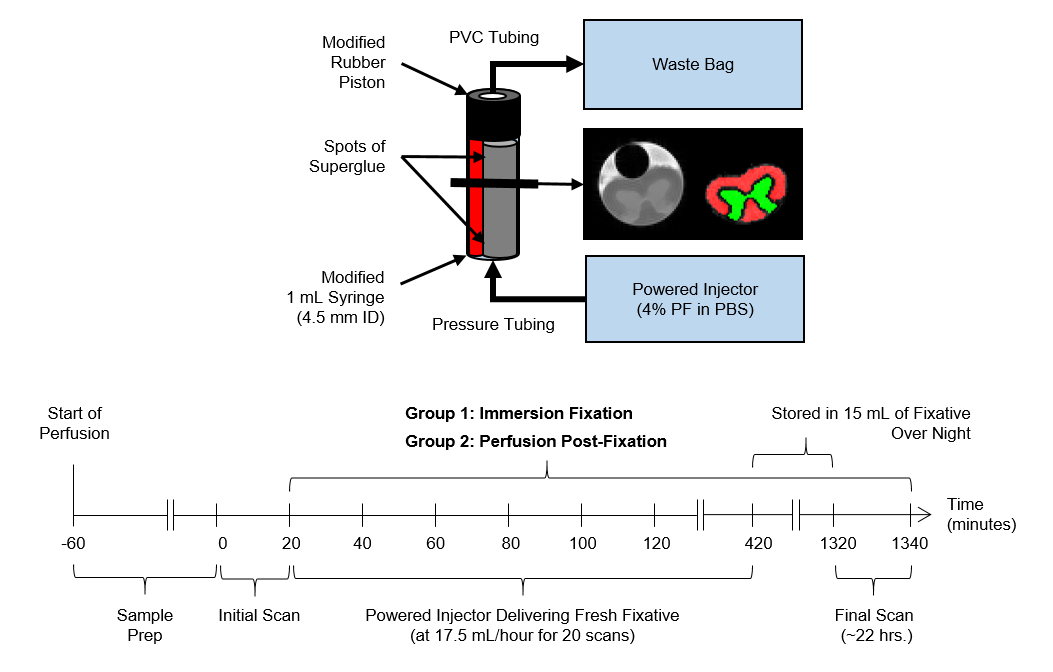
Details of the experimental setup and timing is shown in Figure 1.
Twelve Sprague-Dawley rats were divided into two groups: 1) an immersion fixation group and 2) a perfusion fixation group. Cervical spinal cord samples were excised after intracardial perfusion with phosphate buffered saline (PBS), followed by 4% paraformaldehyde (PF) for the perfusion fixation group, or PBS for the immersion fixation group. The samples were placed in 4% PF for the perfusion fixation group or PBS for the immersion fixation group for scanning.
A single slice multi-echo spin-echo sequence was used to acquire the data10 (TE/TR = 6.738/1,500 ms, 32 echoes, 128 × 256, 1.28 cm × 2.56 cm field-of-view, 1 mm slice, and 6 averages) using a five turn, 13 mm inner-diameter solenoid coil on a 7-Tesla preclinical scanner (Bruker, Germany). At one-hour after the start of perfusion, a baseline scan was taken, after which a power injector (KD Scientific, PA), was started to deliver fresh 4% PF at 17.5 ml/hr. A series of twenty scans were then performed continuously (20 minutes each, spanning 400 minutes). Next, the sample was stored overnight in 15 ml of 4% PF, and a final scan performed at 22 hours after the start of perfusion.
In-house developed Matlab (Natick, MA) code was used to perform all the analyses. T2 distributions were generated using a regularized non-negative least square analysis technique1. From these, parameter maps were calculated for MWF, integral of myelin water (Amyelin) and intra/extracellular water (AI/E), and geometric mean T2 of myelin water (T2myelin) and intra/extracellular water (T2I/E).
Automatic segmentation of grey matter (GM) and white matter (WM) were performed, and region-of-interest averages calculated for each parameter in GM and WM.
Results and Discussion
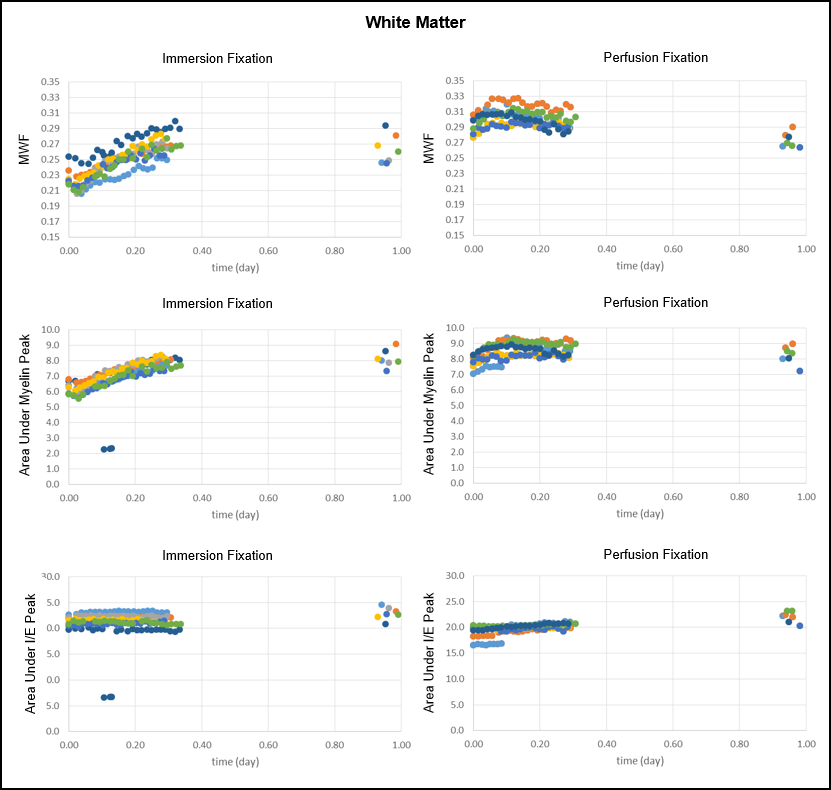
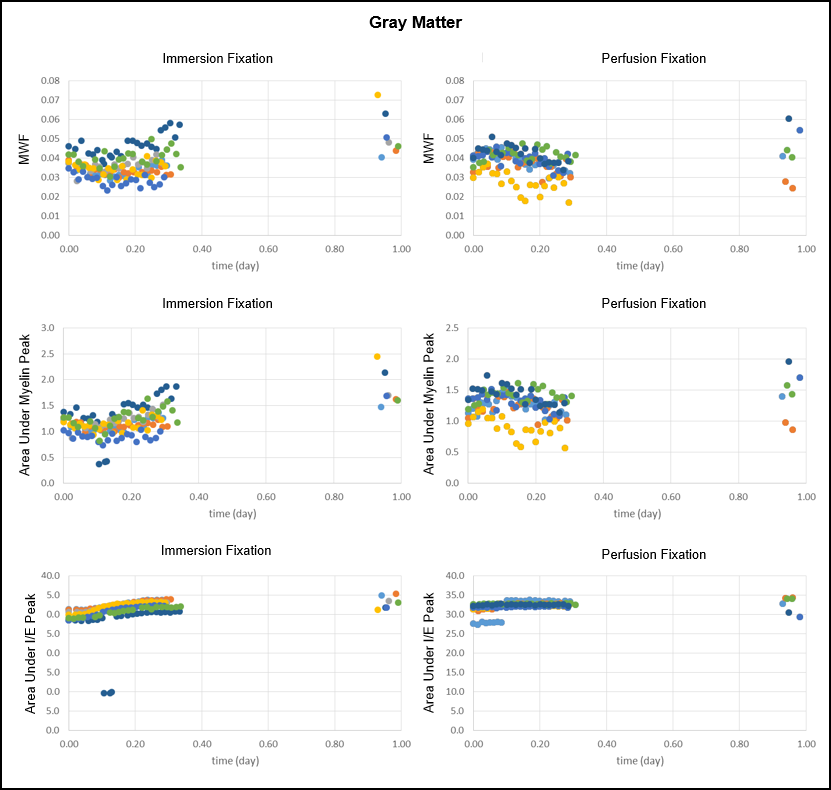
The results for MWF, Amyelin, and AI/E are shown in Figure 2 and 3. In immersion fixation, MWF was found to increase in both GM and WM due to an increase in the amount of myelin water, which is reflected by the increase in Amyelin. After perfusion fixation, MWF remained relatively stable due to the stability in Amyelin. For both groups, AI/E stayed approximately constant throughout the fixation process.
We speculate that the increase in myelin water during immersion fixation results from the loosening of myelin lipid bilayers from chemical fixation. The appearance of the myelin sheath in aldehyde fixed nervous tissue is markedly different from that of unfixed tissue when modern high pressure freezing methods are employed11,12. While the frozen samples produce myelin sheaths with compact and regular spacing, aldehyde fixed samples produce looser lipid bilayers with variable spacing and vacuolated spaces, which would increase the myelin water content. The high lipid to protein ratio of myelin does not favor protein crosslinking by aldehyde fixation. This leads to poor fixation that, when combined with the mechanical stress of tissue shrinkage, can result in the loosening of myelin sheaths.
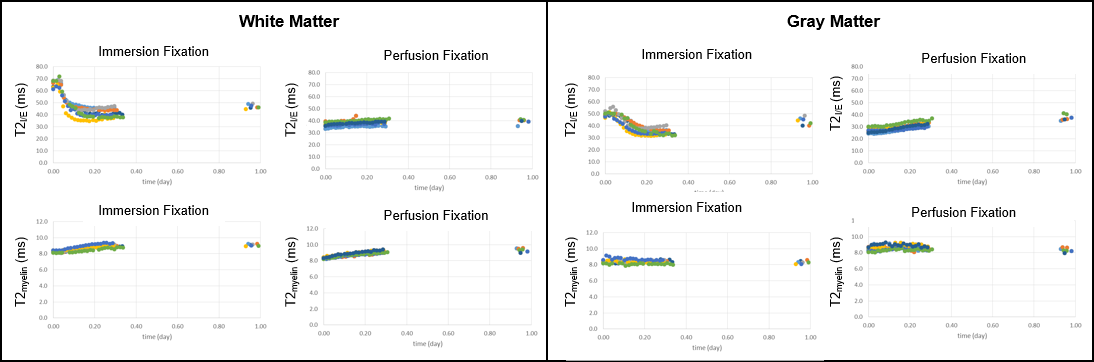
The results for geometric mean T2 is shown in Figure 4. In immersion fixation, T2I/E showed an initial sharp decrease, followed by a slow recovery. After perfusion fixation, however, only a slow recovery was observed. This behavior matched previous observations in the T2 of nervous tissue13,14. The initial drop is likely associated with the infiltration of fixative and the slow recovery is likely associated with tissue decomposition, which increases T213,15.
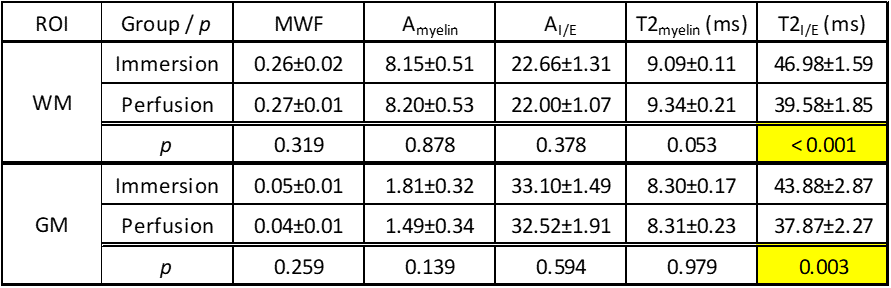
No statistical significant
differences were found in MWF, AI/E, and Amyelin between
immersion and perfusion fixation in the final scan; however, T2I/E
was significantly shorter with perfusion fixation (Table 1). This agrees with
the observation that T2 increases with postmortem interval.
Conclusion
We have demonstrated that MWF increases with aldehyde fixation due to an increase in myelin water. The results explains the discrepancy between MWF observed in vivo and ex vivo, and provide a guideline for designing MWF studies involving chemical fixation.Acknowledgements
This project has been supported with funding from The Natural Sciences and Engineering Research Council of Canada.References
1. Whittall, K. P. et al. In vivo measurement of T2 distributions and water contents in normal human brain. Magn. Reson. Med. 37, 34–43 (1997).
2. Chan, C. C. M. et al. Dose-dependent beneficial and detrimental effects of ROCK inhibitor Y27632 on axonal sprouting and functional recovery after rat spinal cord injury. Exp. Neurol. 196, 352–364 (2005).
3. Kozlowski, P. et al. Characterizing White Matter Damage in Rat Spinal Cord with Quantitative MRI and Histology. J. Neurotrauma 25, 653–676 (2008).
4. Laule, C. et al. Myelin water imaging in multiple sclerosis: quantitative correlations with histopathology. Mult. Scler. 12, 747–753 (2006).
5. Laule, C. et al. Myelin water imaging of multiple sclerosis at 7 T: correlations with histopathology. Neuroimage 40, 1575–1580 (2008).
6. Alonso-Ortiz, E., Levesque, I. R. & Pike, G. B. MRI-based myelin water imaging: A technical review. Magn. Reson. Med. 73, 70–81 (2015).
7. Barkovich, A. J. Concepts of Myelin and Myelination in Neuroradiology. Am. J. Neuroradiol. 21, 1099–1109 (2000).
8. Chen, H. S.-M., Holmes, N., Liu, J., Tetzlaff, W. & Kozlowski, P. Validating myelin water imaging with transmission electron microscopy in a rat spinal cord injury model. NeuroImage 153, 122–130 (2017).
9. Laule, C. et al. Water content and myelin water fraction in multiple sclerosis. J. Neurol. 251, 284–293 (2004).
10. Poon, C. S. & Henkelman, R. M. Practical T2 quantitation for clinical applications. J. Magn. Reson. Imaging 2, 541–553 (1992).
11. Korogod, N., Petersen, C. C. & Knott, G. W. Ultrastructural analysis of adult mouse neocortex comparing aldehyde perfusion with cryo fixation. eLife 4 (2015)
12. Möbius, W., Nave, K.-A. & Werner, H. B. Electron microscopy of myelin: Structure preservation by high-pressure freezing. Brain Res. 1641, Part A, 92–100 (2016).
13. Leprince, Y. et al. Optimization of sample preparation for MRI of formaldehyde-fixed brains. in Proceedings of the 23rd Annual Meeting of ISMRM, 2283 (2015).
14. Dawe, R. J., Bennett, D. A., Schneider, J. A., Vasireddi, S. K. & Arfanakis, K. Postmortem MRI of human brain hemispheres: T2 relaxation times during formaldehyde fixation. Magn. Reson. Med. 61, 810–818 (2009).
15. Shepherd, T. M. et al. Postmortem interval alters the water relaxation and diffusion properties of rat nervous tissue — Implications for MRI studies of human autopsy samples. NeuroImage 44, 820–826 (2009).
Figures