1851
Dynamic Sensitivity of 3D Ultrashort Echo Time (UTE) Cones Imaging for Myelin Concentration Quantification1Radiology, University of California San Diego, La Jolla, CA, United States, 2Radiology, University of California, San Francisco, San Francisco, CA, United States, 3Radiology, VA San Diego Healthcare System, San Diego, CA, United States
Synopsis
Quantification of myelin has the potential to be used as a specific biomarker for demyelinating diseases of the nervous system such as multiple sclerosis. Ultrashort echo time (UTE) MRI has been shown to be able to directly detect signal from myelin protons, but the dynamic sensitivity of the 3D UTE Cones sequence remains unclear. This study examined the correlation between 3D UTE Cones signal intensities and different concentrations of myelin extract in D2O, and found a strong linear correlation up to a myelin concentration of 24% (w/v).
Introduction
Ultrashort echo time (UTE) sequences can directly detect signals from myelin protons, which are normally not detectable by conventional MRI sequences because of their ultrashort T2 (< 1 ms)1–3. Therefore, UTE-based methods may be more specific than indirect methods of myelin quantification such as magnetization transfer or myelin-associated water imaging4–6. We have previously demonstrated the ability to obtain high myelin contrast on a clinical 3T scanner using 2D UTE sequences3,7,8. We have recently developed time-efficient volumetric UTE sequences with 3D Cones sampling9,10 using a short hard nonselective pulse for greater excitation efficiency and greatly reduced eddy current artifacts, which should improve myelin quantification. This study aimed to determine the dynamic sensitivity of the 3D UTE Cones sequence over a physiological range of myelin concentrations on a clinical 3T scanner.Methods
Sample preparation: Myelin powder (type 1 bovine brain lipid extract) was resuspended in D2O and then lyophilized to remove residual water and solvent contamination. The powder was then resuspended in D2O at concentrations ranging from 6% to 30%, which approximates the myelin concentration of white matter. The samples were loaded into 1.0 mL syringes prior to imaging, along with a D2O only control.
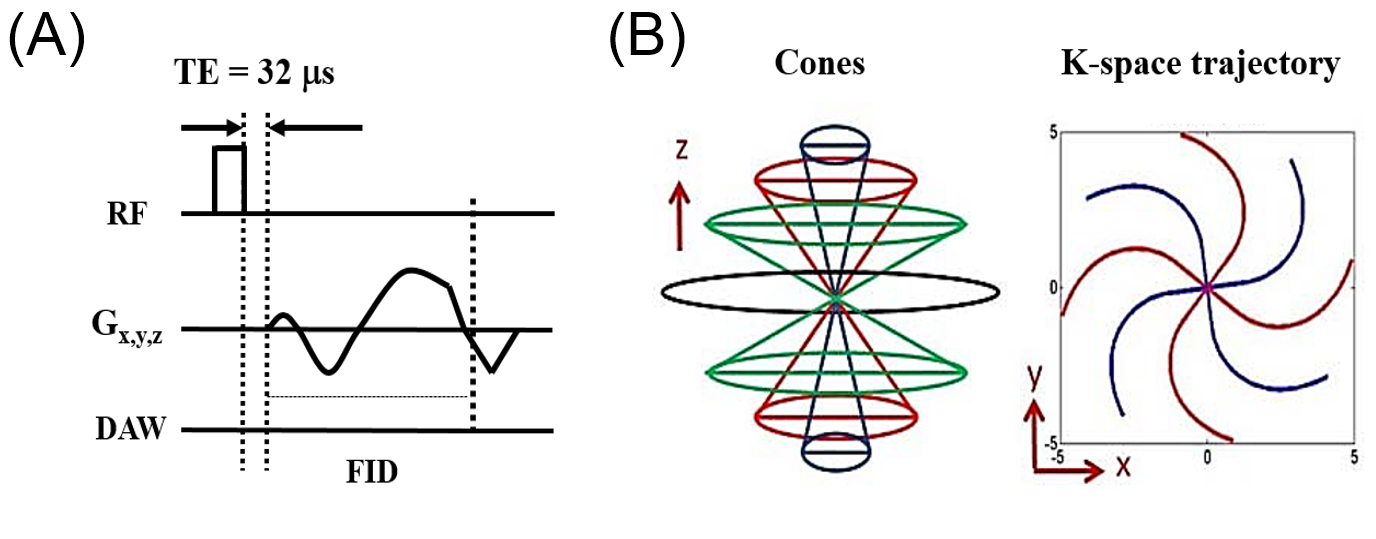
UTE MRI: All specimens were imaged simultaneously in a 30-mL birdcage coil using a clinical 3T scanner at 20°C. The UTE sequence used a short rectangular pulse followed by 3D spiral sampling using a conical view ordering11 with a minimal nominal TE of 32 µs (Figure 1).
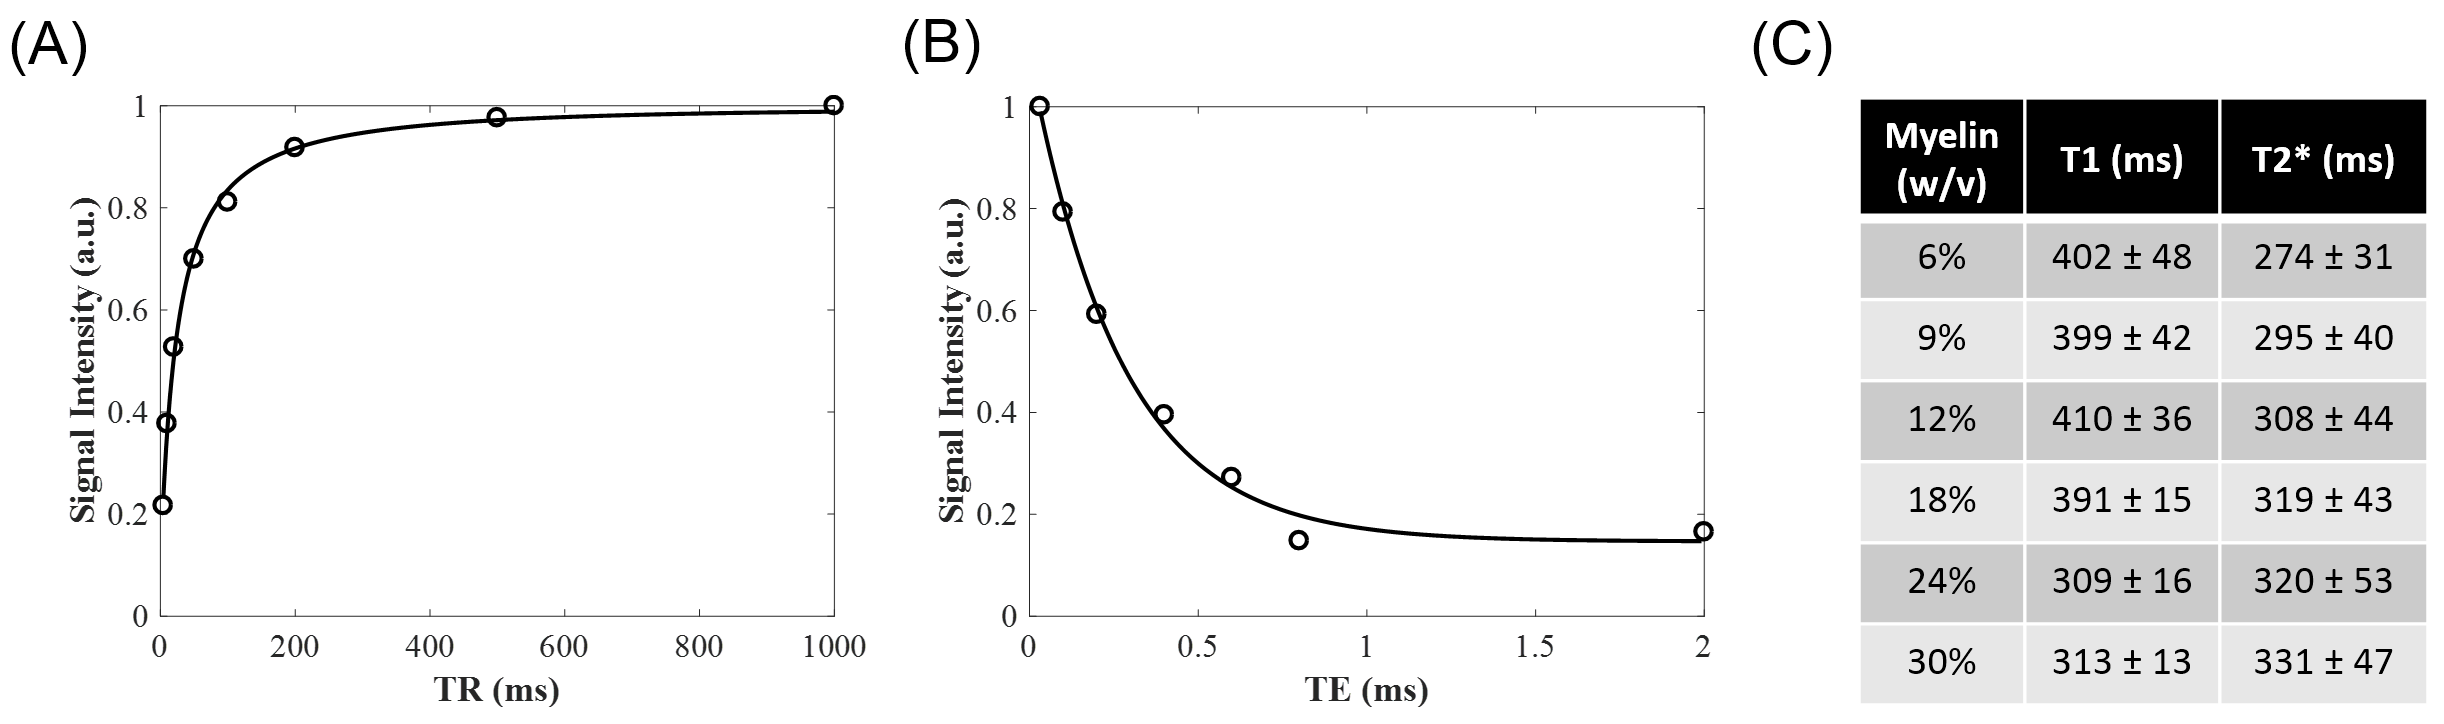
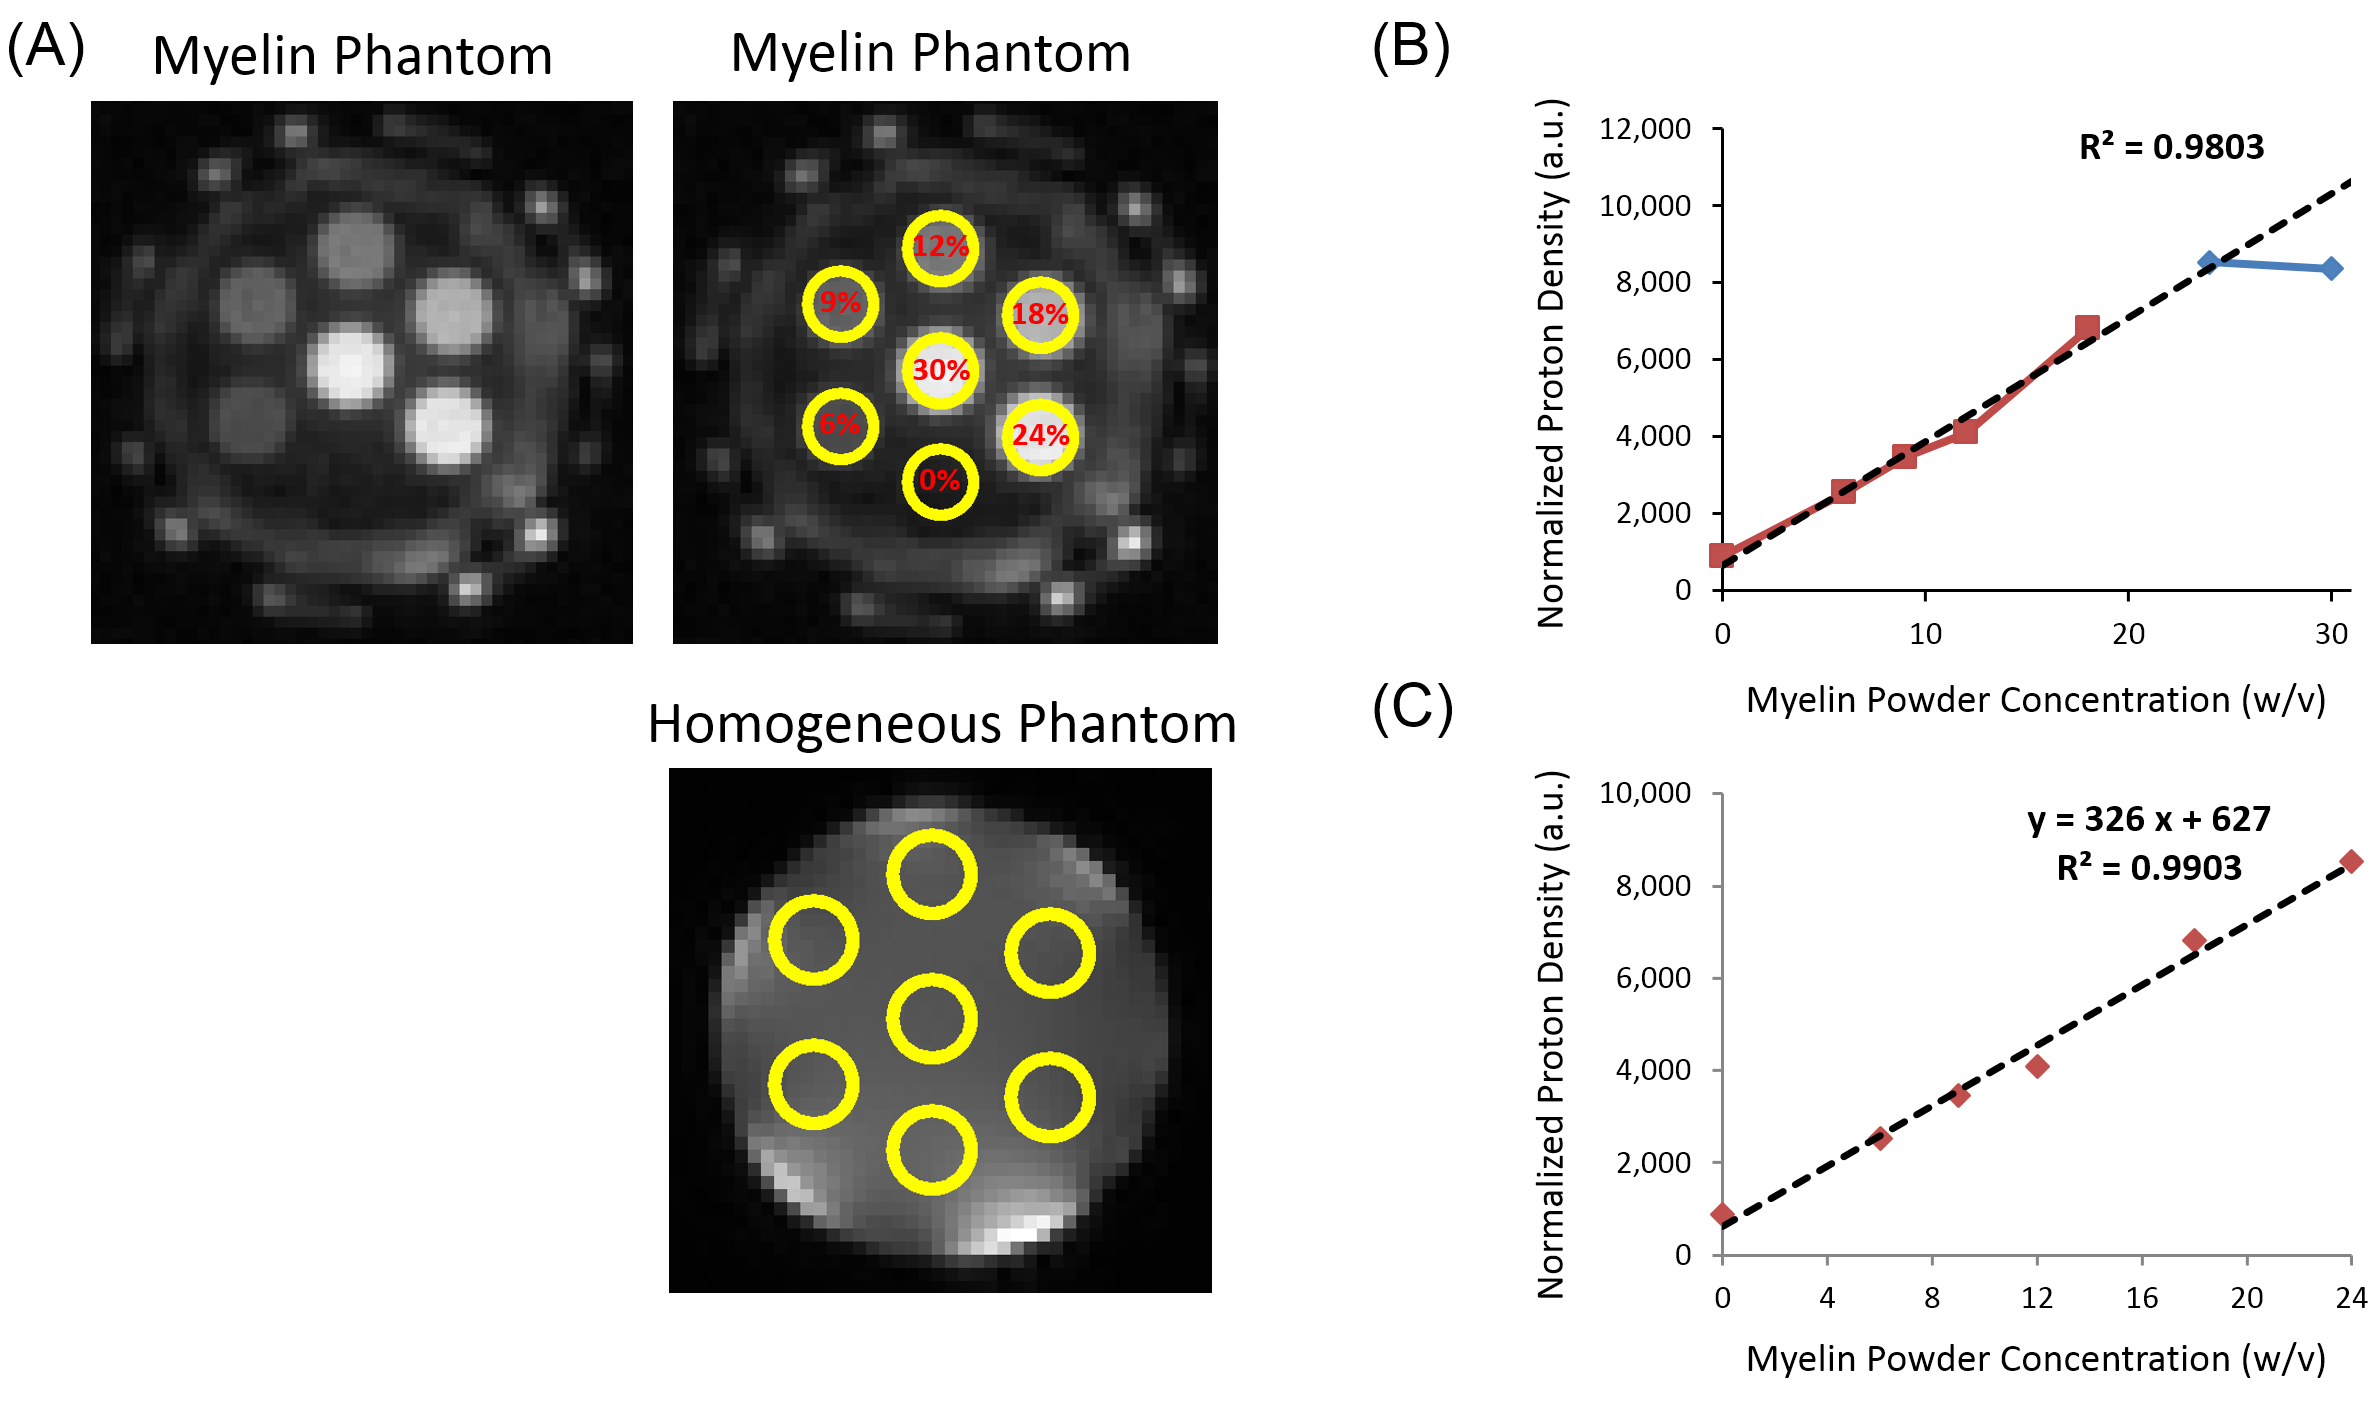
Data analysis: T1 values and T2* values were calculated in each manually-defined ROI offline using single component fitting in Matlab. The proton density values were calculated from the average signal magnitude at TR = 1000 and FA = 20º with T1 correction and normalization to a homogeneous phantom of 20% H2O/80% D2O doped with 12 mM MnCl2. Linear regression was used to determine the relationship between myelin concentration and normalized proton density.
Results
Single component T1 and T2* fitting was excellent for all samples (Figures 2A-B). The T1 was similar for myelin concentrations between 6 – 18%, ranging from 391 to 410 ms, and was significantly lower for myelin concentrations of 24% and 30%, at 309 and 313 ms, respectively (Figure 2C). The T2* of all samples ranged from 274 to 331 ms, and increased nonlinearly with concentration (Figure 2C).
UTE signal intensity increased with myelin concentration (Figure 3A), however the T1-corrected and normalized proton density was similar for the myelin concentrations of 24% and 30%. Given the different T1 values at these myelin concentrations compared to concentrations from 6 to 18%, linear regression was initially performed using only the 6 to 18% data. Normalized proton density had a strong linear correlation with myelin concentration with an R2 of 98% and correctly predicted the normalized proton density of the 24% but not 30% myelin concentration phantom (Figure 3B). Inclusion of the 24% myelin concentration to the regression model improved R2 to 99% (Figure 3C).
Discussion
The majority of the detectable myelin protons are in methylene groups that are not exchangeable with deuterons1,2,12. As the deuterons in D2O are not detectable in proton MRI13, the UTE signal of the myelin powder phantoms resuspended in D2O should directly correspond to myelin proton density. This study demonstrated that normalized proton density determined using the 3D UTE Cones sequence on a clinical 3T scanner was strongly linear in the 6 to 24% myelin concentration range, with linearity decreasing above 24%. These results highlight the potential for the 3D UTE Cones sequence to directly detect and quantify myelin protons but also demonstrate some limitations.
Overall, the T1 and T2* values of myelin were similar to prior studies using 2D UTE sequences7,14,15,12,8. In addition, these results suggest that the T1 and T2* values of myelin may depend on the concentration and perhaps other qualities as well. Lyophilized myelin lipids spontaneously form a distribution of multi- and unilamellar liposomes when resuspended in an aqueous environment16, and it is possible that concentration-dependent differences in this process may account for the observed T1 and T2* differences. Whether myelin quality affects its MRI properties warrants further investigation.
Conclusion
The 3D UTE Cones signal has a strong linear correlation with myelin concentration at physiological ranges and has the potential to be used for myelin quantification on a clinical 3T scanner.Acknowledgements
The authors acknowledge grant support from the NIH (1R01 NS092650 and T32 EB005970), VA Clinical Science Research and Development Service (Merit Award I01CX001388), and GE Healthcare.References
1. Horch, R. A., Gore, J. C. & Does, M. D. (2011). Origins of the Ultrashort-T21H NMR Signals in Myelinated Nerve: A Direct Measure of Myelin Content? Magn. Reson. Med. 66, 24–31.
2. Wilhelm, M. J., Ong, H. H., Wehrli, S. L., Li, C., Tsai, P.-H., Hackney, D. B. & Wehrli, F. W. (2012). Direct magnetic resonance detection of myelin and prospects for quantitative imaging of myelin density. Proc. Natl. Acad. Sci. 109, 9605–9610.
3. Du, J., Ma, G., Li, S., Carl, M., Szeverenyi, N. M., VandenBerg, S., Corey-Bloom, J. & Bydder, G. M. (2014). Ultrashort echo time (UTE) magnetic resonance imaging of the short T2 components in white matter of the brain using a clinical 3T scanner. NeuroImage 87, 32–41.
4. Laule, C., Vavasour, I. M., Kolind, S. H., Li, D. K. B., Traboulsee, T. L., Moore, G. R. W. & MacKay, A. L. (2007). Magnetic resonance imaging of myelin. Neurotherapeutics 4, 460–484.
5. Levesque, I. R., Giacomini, P. S., Narayanan, S., Ribeiro, L. T., Sled, J. G., Arnold, D. L. & Pike, G. B. (2010). Quantitative magnetization transfer and myelin water imaging of the evolution of acute multiple sclerosis lesions. Magn. Reson. Med. 63, 633–640.
6. Wood, T. C., Simmons, C., Hurley, S. A., Vernon, A. C., Torres, J., Dell’Acqua, F., Williams, S. C. R. & Cash, D. (2016). Whole-brain ex-vivo quantitative MRI of the cuprizone mouse model. PeerJ 4.
7. Sheth, V., Shao, H., Chen, J., Vandenberg, S., Corey-Bloom, J., Bydder, G. M. & Du, J. (2016). Magnetic Resonance Imaging of Myelin Using Ultrashort Echo Time (UTE) Pulse Sequences: Phantom, Specimen, Volunteer and Multiple Sclerosis Patient Studies. NeuroImage 136, 37–44.
8. He, Q., Ma, Y., Fan, S., Shao, H., Sheth, V., Bydder, G. M. & Du, J. (2017). Direct magnitude and phase imaging of myelin using ultrashort echo time (UTE) pulse sequences: A feasibility study. Magn. Reson. Imaging 39, 194–199.
9. Carl, M., Bydder, G. M. & Du, J. (2016). UTE imaging with simultaneous water and fat signal suppression using a time-efficient multispoke inversion recovery pulse sequence. Magn. Reson. Med. 76, 577–582.
10. Chen, J., Chang, E. Y., Carl, M., Ma, Y., Shao, H., Chen, B., Wu, Z. & Du, J. (2017). Measurement of bound and pore water T1 relaxation times in cortical bone using three-dimensional ultrashort echo time cones sequences. Magn. Reson. Med. 77, 2136–2145.
11. Gurney, P. T., Hargreaves, B. A. & Nishimura, D. G. (2006). Design and analysis of a practical 3D cones trajectory. Magn. Reson. Med. 55, 575–582.
12. Fan, S.-J., Ma, Y., Chang, E. Y., Bydder, G. M. & Du, J. (2017). Inversion recovery ultrashort echo time imaging of ultrashort T2 tissue components in ovine brain at 3T: a sequential D2O exchange study. NMR Biomed. doi:10.1002/nbm.3767
13. Müller, S. & Seelig, J. (1987). In vivo NMR imaging of deuterium. J. Magn. Reson. 72, 456–466.
14. Du, J., Sheth, V., He, Q., Carl, M., Chen, J., Corey-Bloom, J. & Bydder, G. M. (2014). Measurement of T1 of the Ultrashort T2* Components in White Matter of the Brain at 3T. PLOS ONE 9, e103296.
15. Sheth, V. R., Fan, S., He, Q., Ma, Y., Annesse, J., Switzer, R., Corey-Bloom, J., Bydder, G. M. & Du, J. (2017). Inversion Recovery Ultrashort Echo Time Magnetic Resonance Imaging: A Method for Simultaneous Direct Detection of Myelin and High Signal Demonstration of Iron Deposition in the Brain – A Feasibility Study. Magn. Reson. Imaging 38, 87–94.
16. Díaz, R. S., Monreal, J., Regueiro, P. & Lucas, M. (1992). Preparation of a protein-free total brain white matter lipid fraction: Characterization of liposomes. J. Neurosci. Res. 31, 136–145.
Figures