1850
Measurement of T1 and T2* Relaxation Times of Purified Animal Myelin by 3D UTE Cones Sequences at 3T1Radiology, University of California San Diego, La Jolla, CA, United States, 2Radiology, VA San Diego Healthcare System, San Diego, CA, United States
Synopsis
Determination of accurate T1 and T2* values of myelin protons is challenging because it is comprised of multiple lipid and protein components with an ultrashort T2*, but would be important for ultrashort echo time (UTE) sequence development. In this study, we present the first T1 and T2* measurements of intact myelin directly purified from white matter, with T1 measured using a 3D UTE Cones adaptation of actual flip-angle imaging (UTE-AFI) with variable TRs, and T2* measured using 3D UTE acquisitions with variable TEs. We find that myelin has a T1 of 367 ms and T2* of 225 ms at 3T.
Introduction
The ultrashort echo time (UTE) MRI signal from myelin protons is thought to be primarily from long-chain methylene groups but also with contributions from cholesterol, choline, methyl groups, and proteins1,2. Prior attempts to measure the T1 and T2* of myelin protons may be inaccurate because they used myelin lipid extracts, purified myelin basic protein, or deuterated white matter containing other cellular components and residual water3–5. The use of adiabatic inversion-recovery prepared UTE (IR-UTE) to suppress and null longer T2 components allows for consistent short T2* measurement, however the multiple longer T2 water pools complicates T1 measurement6. In this study, intact myelin vesicles containing their native lipids and proteins were purified from porcine white matter and resuspended in deuterated buffer followed by T1 and T2* measurement using 3D UTE Cones sequences on a clinical 3T scanner.Methods
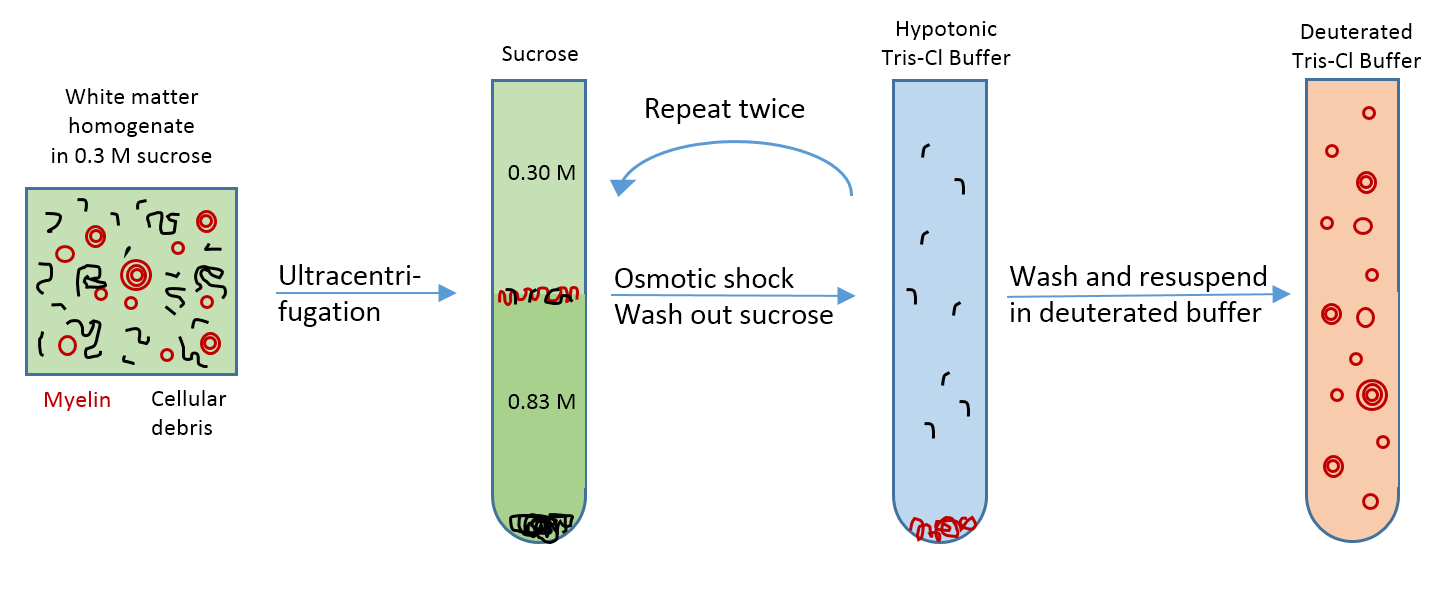
Sample preparation: Porcine white matter was mechanically homogenized followed by myelin vesicle purification using discontinuous sucrose gradient ultracentrifugation according to published methods7. The procedure was repeated three times to achieve high purity. After thoroughly washing out residual sucrose, the myelin was resuspended twice in deuterated tris-Cl buffer to remove residual H2O (Figure 1).
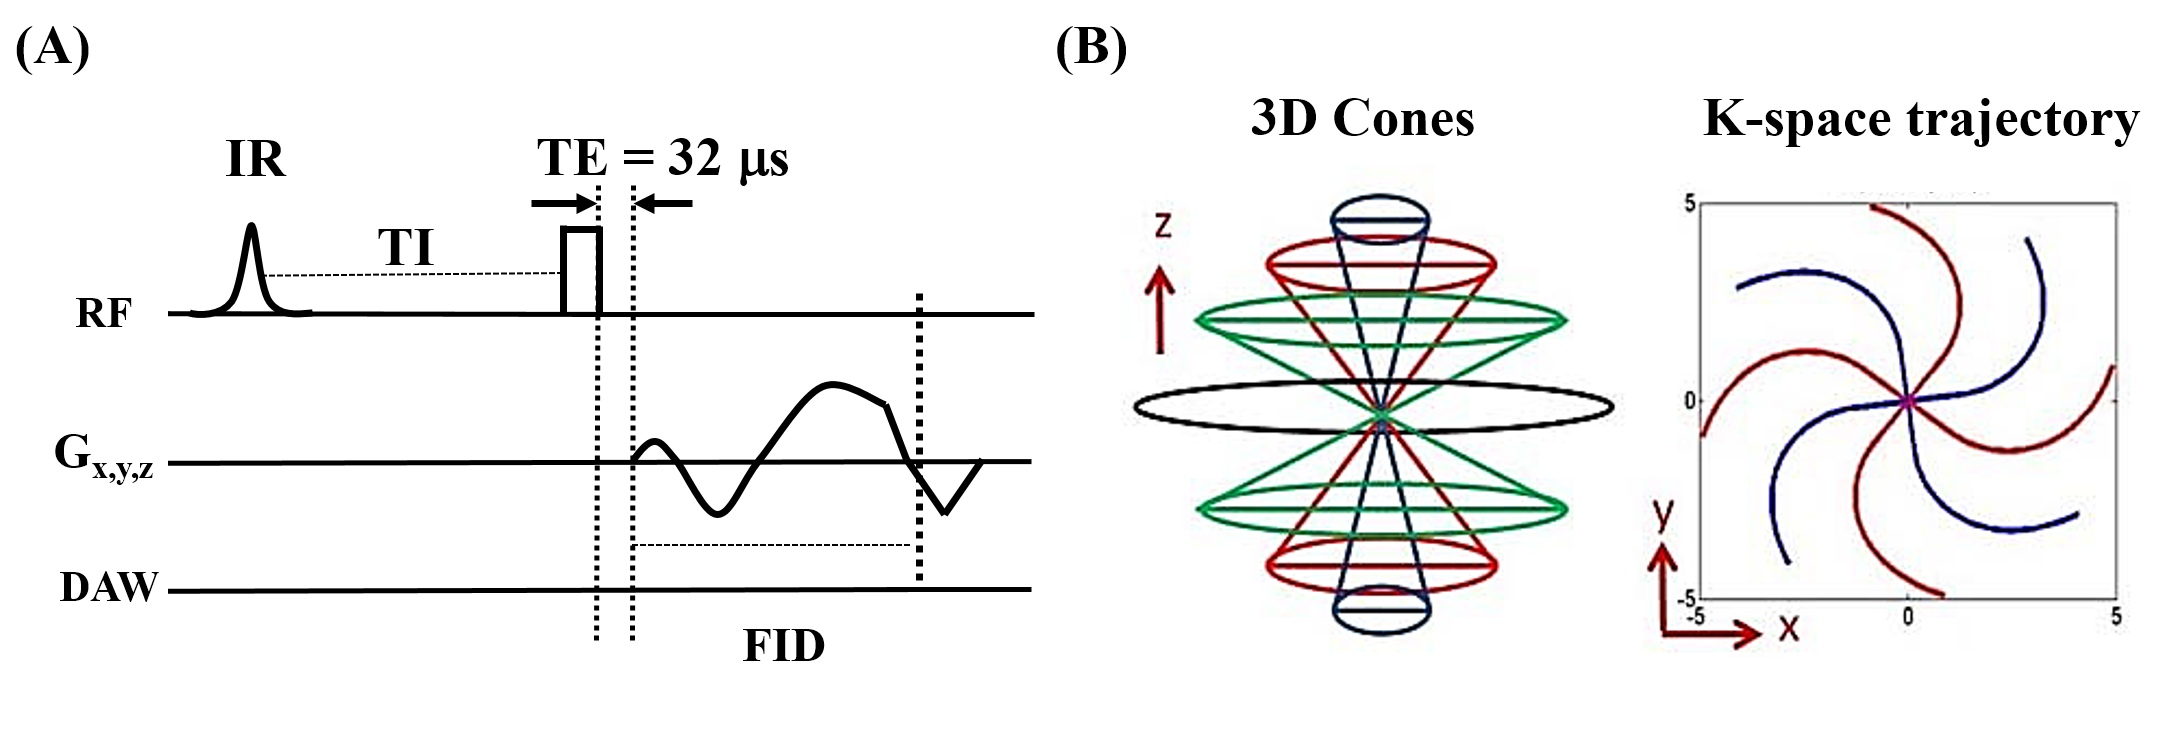
UTE MRI: Each myelin specimen was prepared in a 1 mL syringe and imaged in a 3 mL solenoid coil using a clinical 3T scanner at 20°C. The UTE sequence uses a short hard excitation pulse (26-52 µs in duration) and spiral trajectory data acquisition using 3D conical view ordering8, with adiabatic IR preparation in the case of IR-UTE (Figure 2)9–11. T1 was measured using a variable TR method with UTE and actual flip-angle imaging (UTE-AFI), which uses a pair of interleaved TRs for accurate B1 correction12. T1 was also measured with standard 3D UTE Cones acquisitions. Two flip angles (FA) of 45º (pulse duration = 120 µs) and 20º (pulse duration = 52 µs) were tested with variable TRs (TRs=5,10,20,30,50,100 ms; TE=0.032 ms). UTE-AFI data were acquired with TR1/TR2=15/75 ms, FA=45°. T2* was measured using either UTE (TR=20ms) or IR-UTE (TR/TI=200/81 ms) with variable TEs (TEs=0.032,0.1,0.2,0.4,0.8 ms). Other imaging parameters included: FOV = 8×8×6 cm3, slice thickness = 3 mm, matrix = 128×128×20, bandwidth=125 kHz.
Data analysis: T1 values and T2* values were calculated in a manually-defined ROI offline using single component fitting in Matlab.
Results
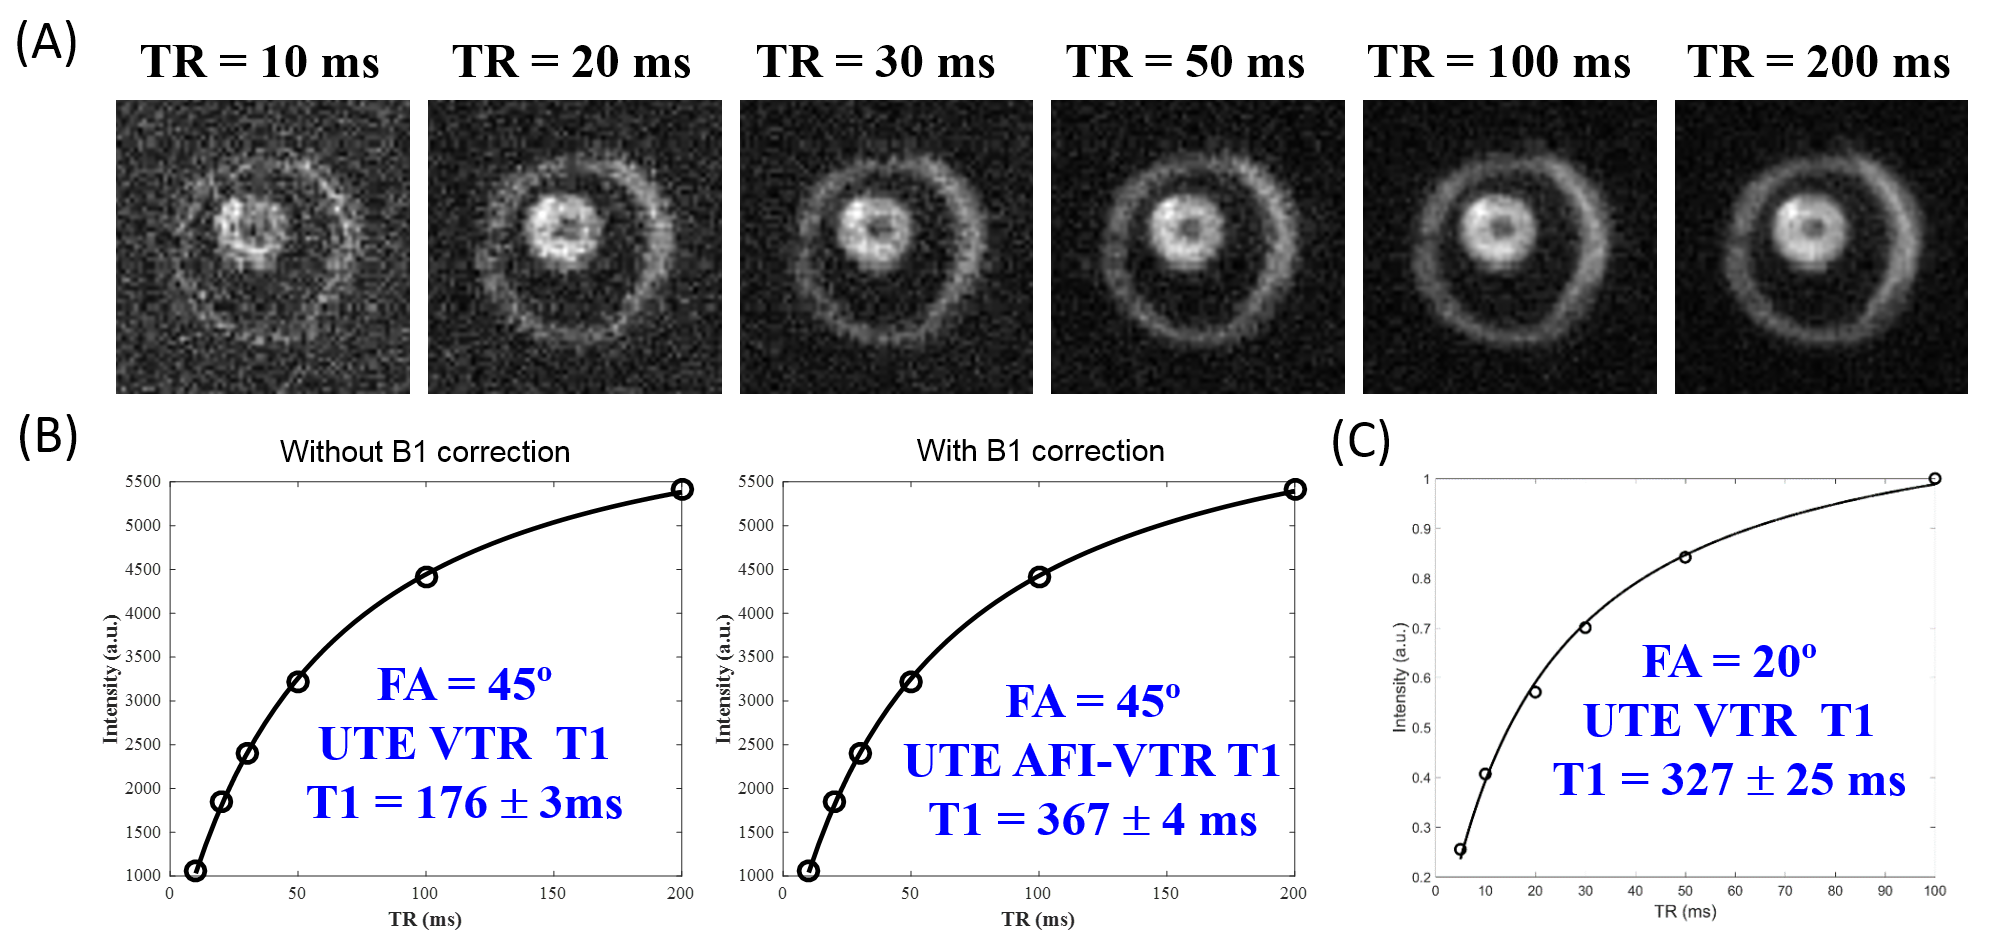
The T1 value of the purified myelin vesicles was 176±3 ms using a flip angle of 45° by UTE without B1 correction and 367±4 ms with B1 correction using AFI-UTE (Figure 3A-B). The latter value is similar to the T1 of 327±25 ms measured at the smaller flip angle of 20° without B1 correction (Figure 3C), which is less accurate but also less susceptible to excitation error due to the use of a shorter RF pulse (52 µs in duration).
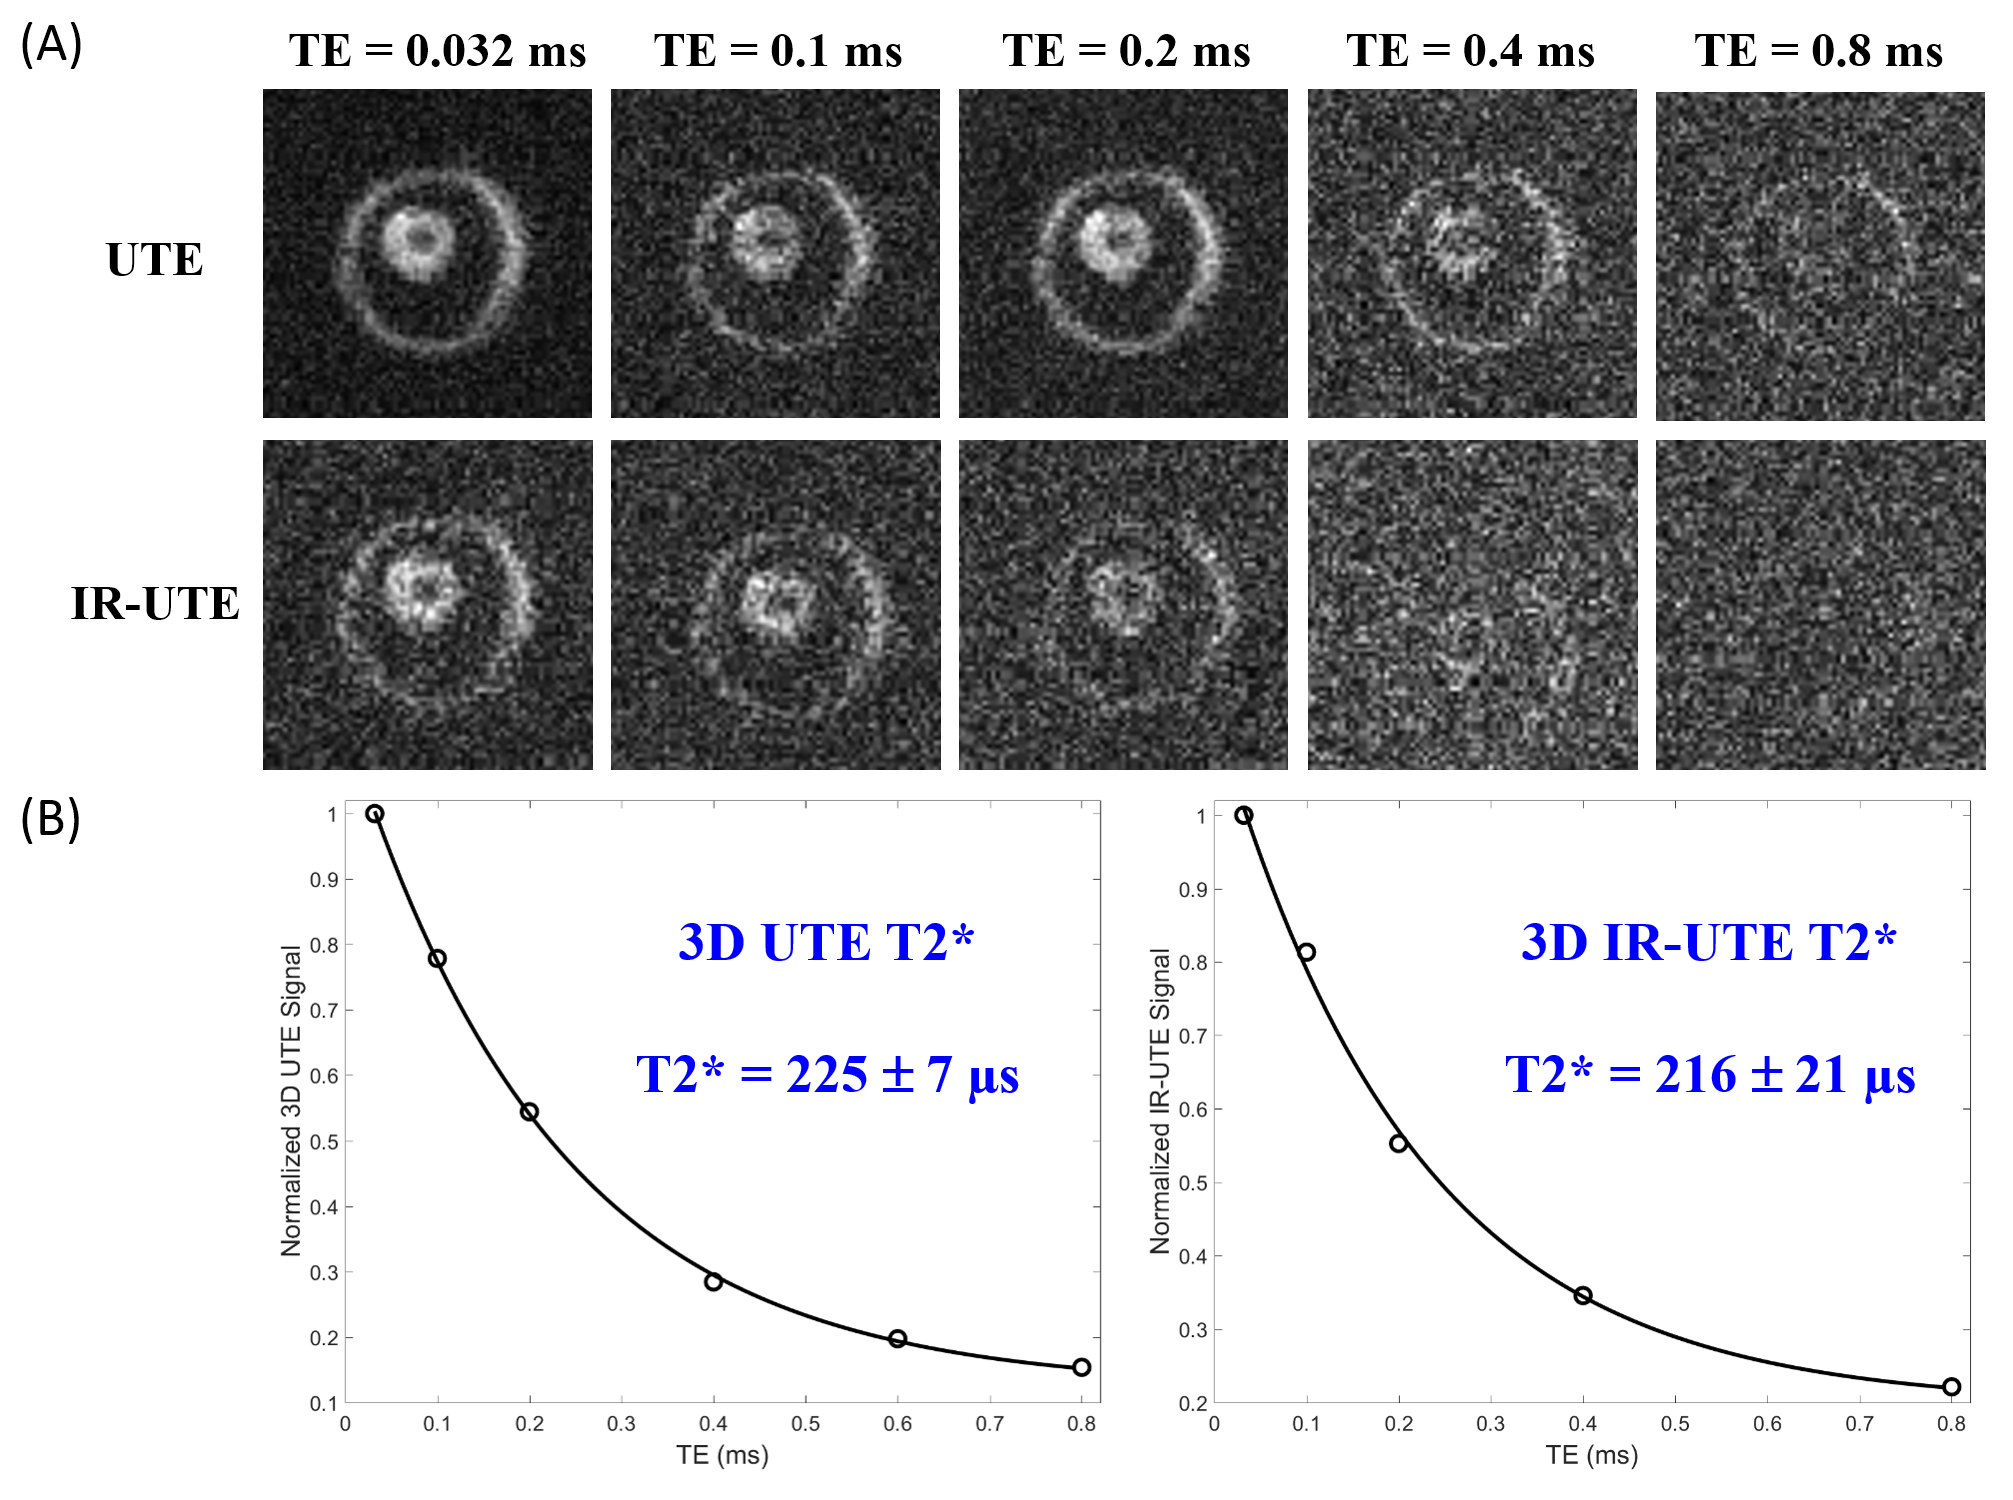
The myelin UTE signal was nearly absent by TE=0.8 ms and the IR-UTE signal completely undetectable by TE=0.8 ms, indicating that only minimal long T2 components were present in the sample (Figure 4A). The measured T2* values were similar between UTE and IR-UTE at 225±7 ms and 216±21 ms, respectively.
Discussion
The T1 and T2* values of intact myelin vesicles measured in this study were similar to the T1 and T2* values of deuterated white matter and myelin extract previously reported using UTE sequences3,6,13,5,4. The myelin vesicles were resuspended in deuterated tris-Cl buffer for vesicle stability and because deuterons are not detectable in proton MRI14. While most myelin protons are not exchangeable with the buffer deuterons1,2,5, the hydrogen-deuteron exchange of some hydroxyl and amide protons may have had a small effect on the measured T1 and T2* values. Nevertheless, these values are likely to more accurately reflect the T1 and T2* behavior of myelin in vivo because more short T2 myelin components were retained and there was almost no detected long T2 component contamination.
This approach of measuring intact myelin vesicles can be used in future studies to systematically investigate how the MR properties of myelin vary with its ultrastructure, such as vesicle size, compaction, and number of lamellae, by further subfractionation. Such studies may lead to the development of UTE-based methods for assessment of myelin quality, which is a significant unmet clinical need in disorders that affect both myelin content and quality such as multiple sclerosis15,16.
Conclusion
The T1 and T2* of intact myelin vesicles purified from white matter are 367 ms and 225 ms, respectively, as measured using 3D UTE Cones sequences. Those measurements will help future 3D UTE and IR-UTE sequence optimization for the imaging of myelin in vivo at 3T.Acknowledgements
The authors acknowledge grant support from the NIH (1R01 NS092650 and T32 EB005970), VA Clinical Science Research and Development Service (Merit Award I01CX001388), and GE Healthcare.References
1. Horch, R. A., Gore, J. C. & Does, M. D. (2011). Origins of the Ultrashort-T21H NMR Signals in Myelinated Nerve: A Direct Measure of Myelin Content? Magn. Reson. Med. 66, 24–31.
2. Wilhelm, M. J., Ong, H. H., Wehrli, S. L., Li, C., Tsai, P.-H., Hackney, D. B. & Wehrli, F. W. (2012). Direct magnetic resonance detection of myelin and prospects for quantitative imaging of myelin density. Proc. Natl. Acad. Sci. 109, 9605–9610.
3. Sheth, V., Shao, H., Chen, J., Vandenberg, S., Corey-Bloom, J., Bydder, G. M. & Du, J. (2016). Magnetic Resonance Imaging of Myelin Using Ultrashort Echo Time (UTE) Pulse Sequences: Phantom, Specimen, Volunteer and Multiple Sclerosis Patient Studies. NeuroImage 136, 37–44.
4. He, Q., Ma, Y., Fan, S., Shao, H., Sheth, V., Bydder, G. M. & Du, J. (2017). Direct magnitude and phase imaging of myelin using ultrashort echo time (UTE) pulse sequences: A feasibility study. Magn. Reson. Imaging 39, 194–199.
5. Fan, S.-J., Ma, Y., Chang, E. Y., Bydder, G. M. & Du, J. (2017). Inversion recovery ultrashort echo time imaging of ultrashort T2 tissue components in ovine brain at 3T: a sequential D2O exchange study. NMR Biomed. 10(30). doi:10.1002/nbm.3767.
6. Du, J., Sheth, V., He, Q., Carl, M., Chen, J., Corey-Bloom, J. & Bydder, G. M. (2014). Measurement of T1 of the Ultrashort T2* Components in White Matter of the Brain at 3T. PLOS ONE 9, e103296.
7. Larocca, J. N. & Norton, W. T. (2007). Isolation of myelin. Curr. Protoc. Cell Biol. Chapter 3, Unit 3.25.
8. Gurney, P. T., Hargreaves, B. A. & Nishimura, D. G. (2006). Design and analysis of a practical 3D cones trajectory. Magn. Reson. Med. 55, 575–582.
9. Carl, M., Bydder, G. M. & Du, J. (2016). UTE imaging with simultaneous water and fat signal suppression using a time-efficient multispoke inversion recovery pulse sequence. Magn. Reson. Med. 76, 577–582.
10. Chen, J., Chang, E. Y., Carl, M., Ma, Y., Shao, H., Chen, B., Wu, Z. & Du, J. (2017). Measurement of bound and pore water T1 relaxation times in cortical bone using three-dimensional ultrashort echo time cones sequences. Magn. Reson. Med. 77, 2136–2145.
11. Du, J., Ma, G., Li, S., Carl, M., Szeverenyi, N. M., VandenBerg, S., Corey-Bloom, J. & Bydder, G. M. (2014). Ultrashort echo time (UTE) magnetic resonance imaging of the short T2 components in white matter of the brain using a clinical 3T scanner. NeuroImage 87, 32–41.
12. Ma, Y.-J., Lu, X., Carl, M., Zhu, Y., Chang, E. Y. & Du, J. (2017). Accurate T1 Mapping for Short T2 Tissues using 3D Ultrashort Echo Time Cones Actual Flip Angle-Variable TR Method. ISMRM Workshop: Advanced Musculoskeletal MRI: Arthritis & Beyond. Hangzhou, China.
13. Sheth, V. R., Fan, S., He, Q., Ma, Y., Annesse, J., Switzer, R., Corey-Bloom, J., Bydder, G. M. & Du, J. (2017). Inversion Recovery Ultrashort Echo Time Magnetic Resonance Imaging: A Method for Simultaneous Direct Detection of Myelin and High Signal Demonstration of Iron Deposition in the Brain – A Feasibility Study. Magn. Reson. Imaging 38, 87–94.
14. Müller, S. & Seelig, J. (1987). In vivo NMR imaging of deuterium. J. Magn. Reson. 72, 456–466.
15. Stikov, N., Campbell, J. S. W., Stroh, T., Lavelée, M., Frey, S., Novek, J., Nuara, S., Ho, M.-K., Bedell, B. J., Dougherty, R. F., et al. (2015). In vivo histology of the myelin g-ratio with magnetic resonance imaging. NeuroImage 118, 397–405.
16. Duncan, I. D. & Radcliff, A. B. (2016). Inherited and acquired disorders of myelin: The underlying myelin pathology. Exp. Neurol. 283, Part B, 452–475.
Figures