1846
The Observable Fraction of Myelin Lipid 1H Magnetization Imaged by IR-ZTE1Department of Radiology, University of Pennsylvania, Philadelphia, PA, United States, 2Translational and Molecular Imaging Institute, Icahn School of Medicine at Mount Sinai, New York, NY, United States, 3Department of Chemistry, Temple University, Philadelphia, PA, United States, 4SAIF Core Facility, Children's Hospital of Philadelphia, Philadelphia, PA, United States
Synopsis
Direct detection of myelin using solid-state imaging methods is challenging due to the extremely short lifetime of the myelin matrix 1H MR signal, which significantly limits its observability. In this work, the fraction of total myelin matrix 1H MR signal that is observable by an inversion-recovery (IR)-prepared zero echo-time (ZTE) imaging with pointwise encoding time reduction with radial acquisition (PETRA) sequence using various acquisition parameters is estimated by Bloch equation simulations. Only approximately 5% of total magnetization is observable under realistic experimental conditions. The adiabatic inversion-recovery pulse is mostly responsible for this low fractional observability.
Introduction
Most current MRI methods for quantification of myelin density use magnetization transfer (MT) imaging1 or T2 relaxometry2. However, both methods exploit water’s chemical or magnetic interaction with the myelin matrix, rather than directly imaging myelin matrix 1H signal. Direct detection of myelin using solid-state imaging methods would remove the complications of indirect methods3, but is challenging due to the extremely short lifetime of the myelin matrix 1H MR signal4, which significantly limits its observability. Here, the fraction of total myelin matrix 1H MR signal that is observable by inversion-recovery (IR)-prepared zero echo-time (ZTE) imaging with pointwise encoding time reduction with radial acquisition (PETRA)5 using various acquisition parameters is estimated by Bloch equation simulations.Methods
Data Acquisition: Myelin was extracted from ovine spinal cord by the sucrose gradient technique6 and re-suspended in D2O, ensuring that all observed 1H signal arises from myelin lipids. A 1H spectrum was recorded on a 400MHz spectrometer (Avance III 400, Bruker, Billerica, MA) using a 5-mm RF probe and the following acquisition parameters: bandwidth=100kHz, averages=256, points=262,144, TR=3.6s, FA=90°, pulse duration=9.6µs.
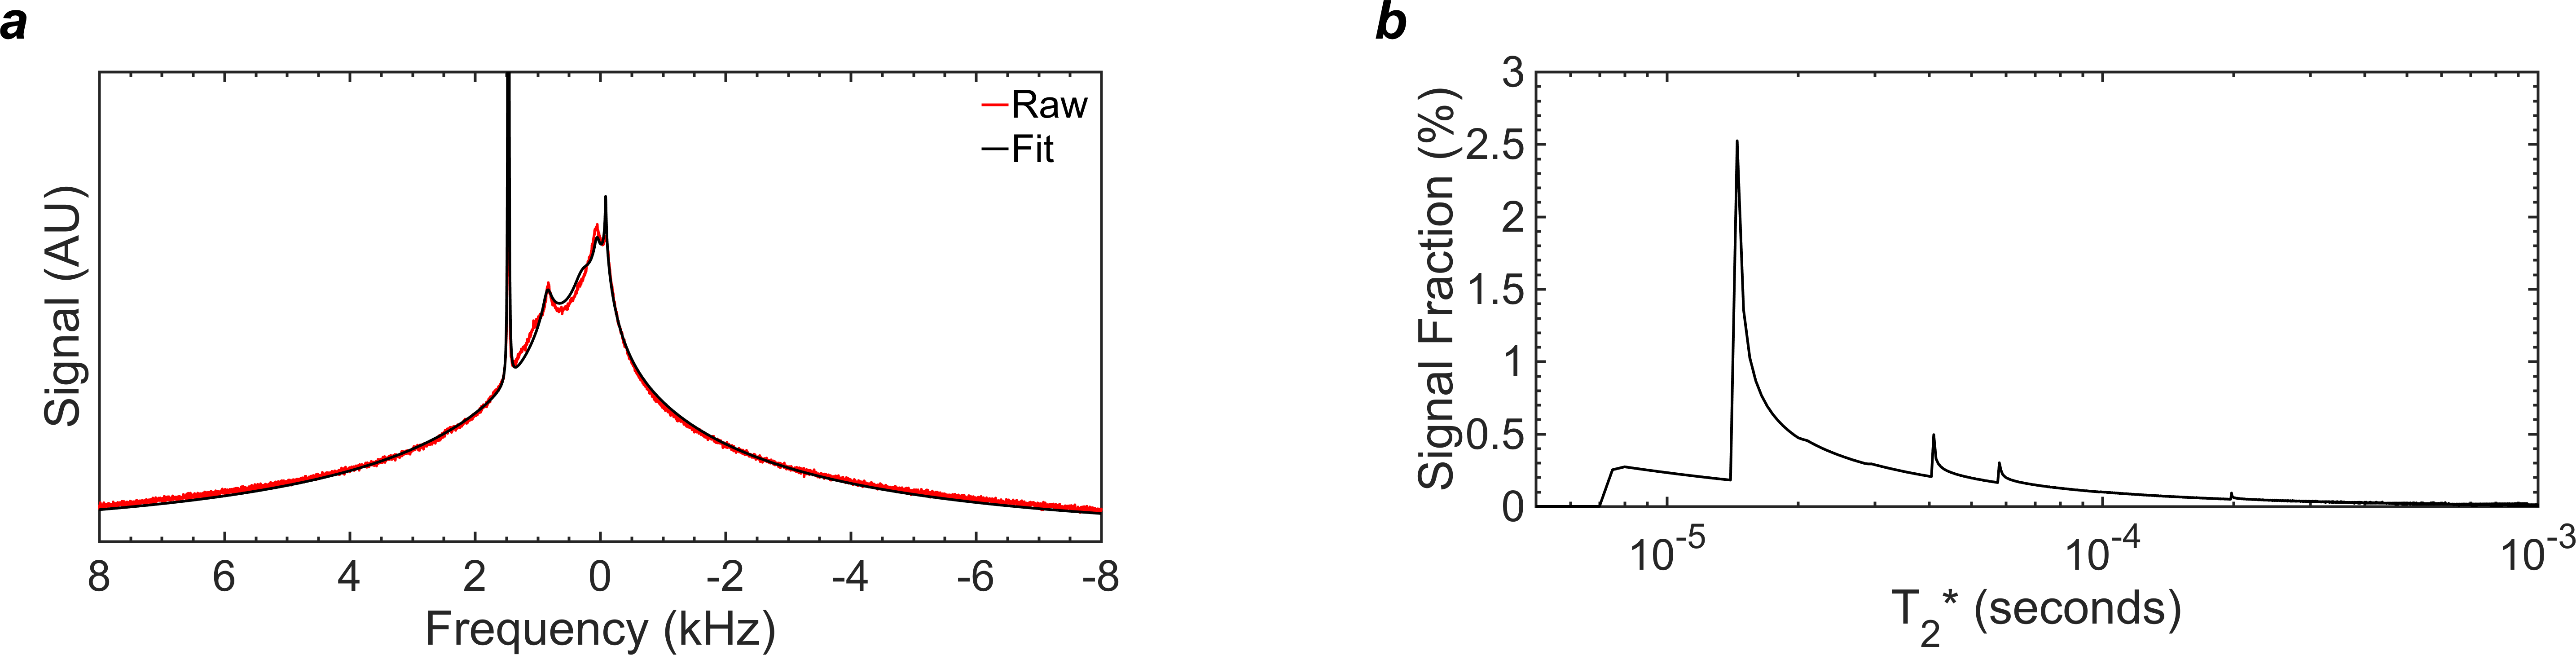
Super-Lorentzian Fitting: The super-Lorentzian (SL) function is based on the proton NMR line shape of lamellar liquid crystals7. The acquired 1H spectrum was fitted to a sum of four (SL) functions8, centered at chemical shifts representing alkyl chain methylenes from fatty acids, cholesterol alkyl chain methylenes, terminal methyls, and choline. A single additional Lorentzian was used to model residual monodeuterium oxide (HDO). The T2* spectrum was computed from the widths and areas of the individual Lorentzians comprising the super-Lorentzians. The T2* spectrum was corrected for transverse relaxation of each T2* component during the excitation pulse.
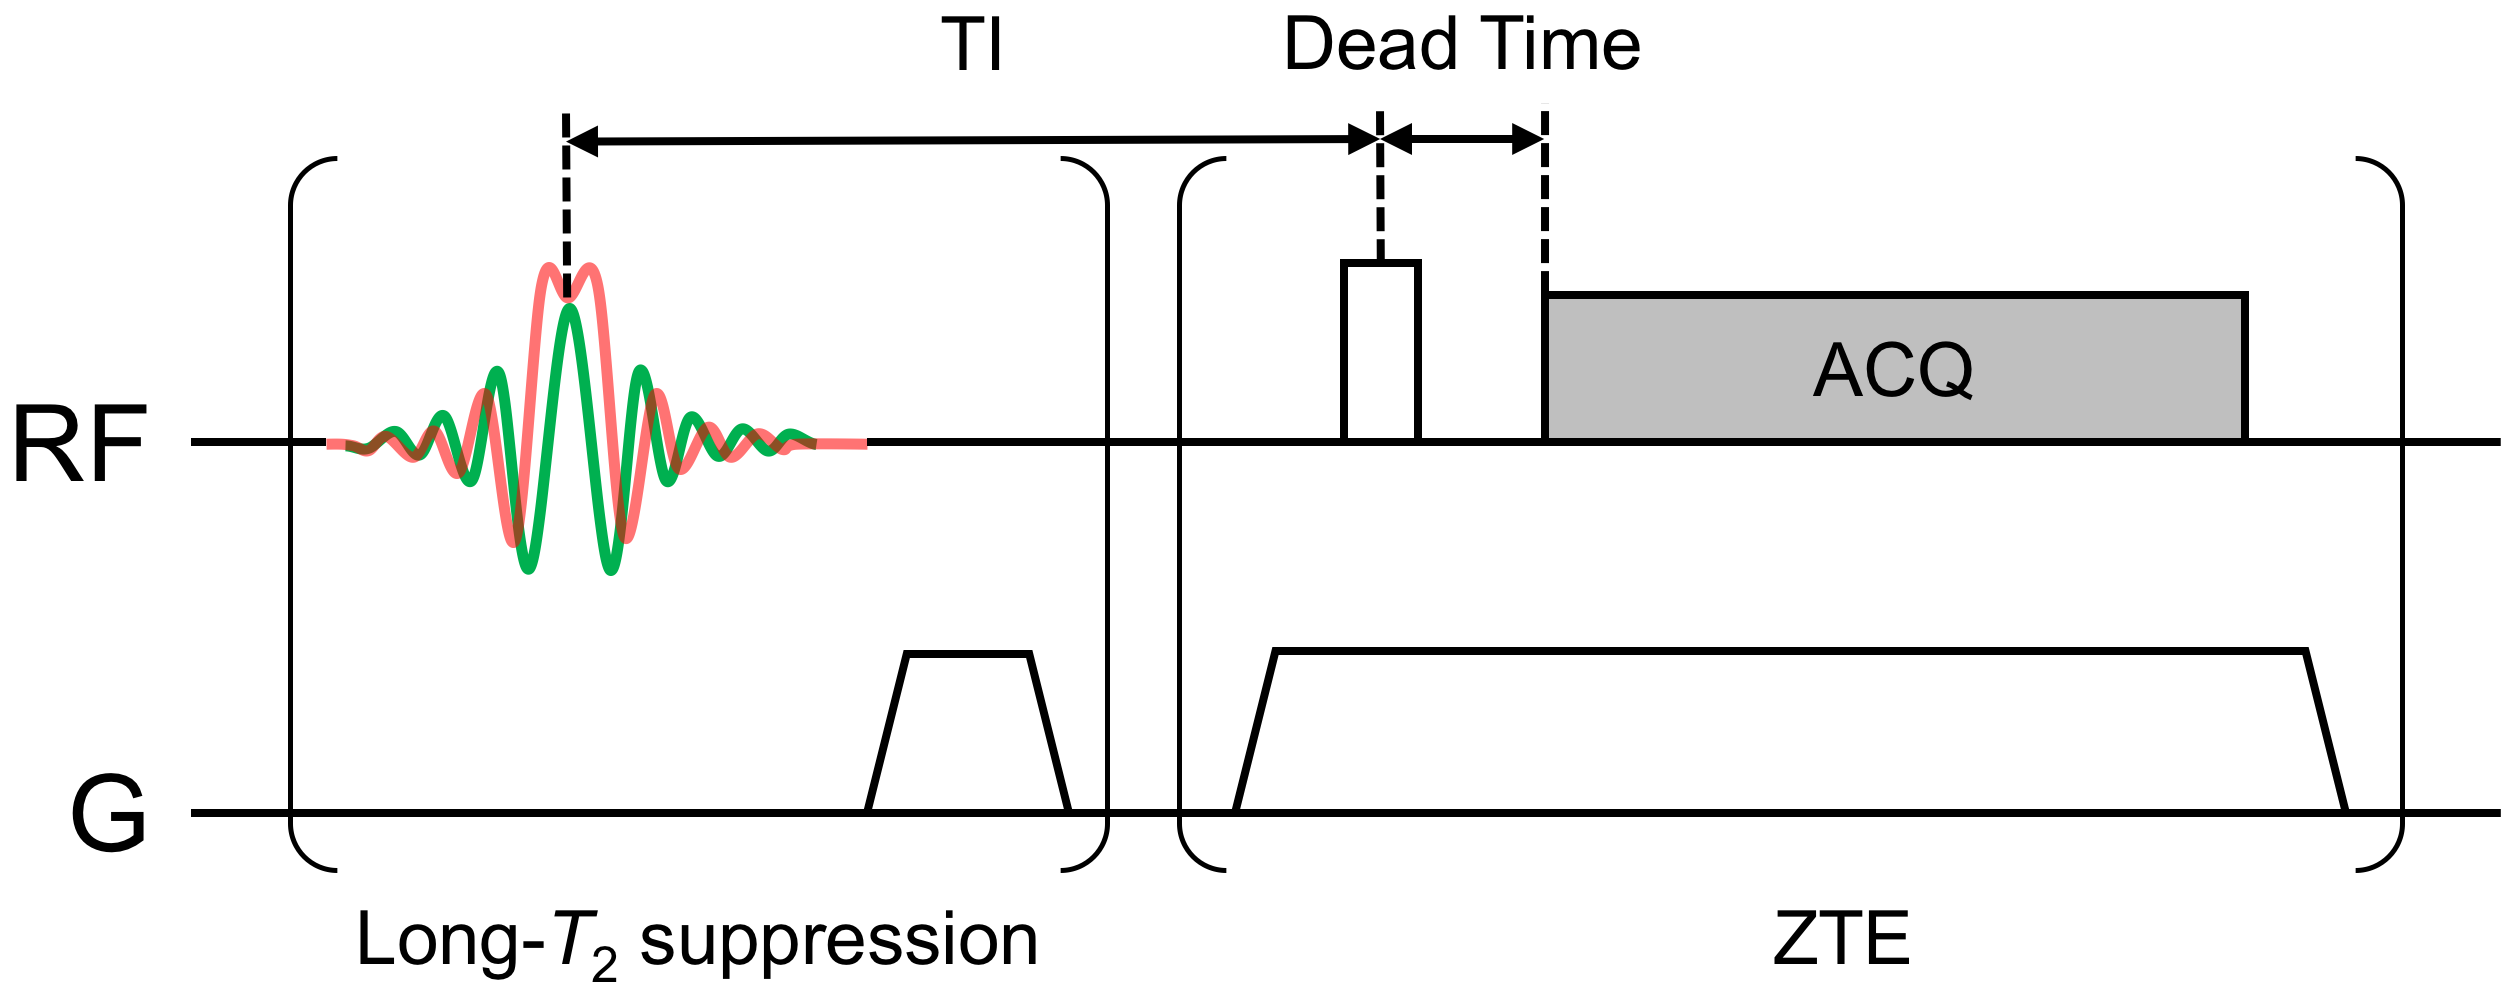
Bloch Equation Simulations: Bloch equation simulations of an IR-ZTE-PETRA sequence (Fig. 1) were performed for arrays of acquisition parameters: RF pulse durations ranging from 8µs to 200µs, flip angles from 3° to 90°, and transmit/receive dead times from 2µs to 64µs. The effect of the adiabatic inversion pulse was included, and magnetization was assumed to have reached steady state. Other simulation parameters were those of a typical IR-ZTE-PETRA scan protocol: TR=300ms; TI=120ms, hyperbolic secant (HS) inversion pulse duration=5ms; HS bandwidth=5,000Hz; T1=660ms (prior work on D2O-suspended myelin lipid yielded a composite T1 value of 0.66s at 9.4T3).
The normalized magnitude of the transverse magnetization at the transmit/receive dead time was calculated for each value of T2* contained in the T2* spectrum, and then scaled by the amplitude of the T2* spectrum at that time constant. The observable fraction of total myelin signal was calculated as the sum of the simulated magnitudes of the transverse magnetization at all T2*s, divided by the area under the T2* spectrum. These computations were performed in Matlab R2015b (Mathworks, Natick, MA, USA) on a high-performance image analysis server (32 CPU cores, 256 GB RAM, Linux Ubuntu 13.10, requiring 50 hours total processing time).
Results
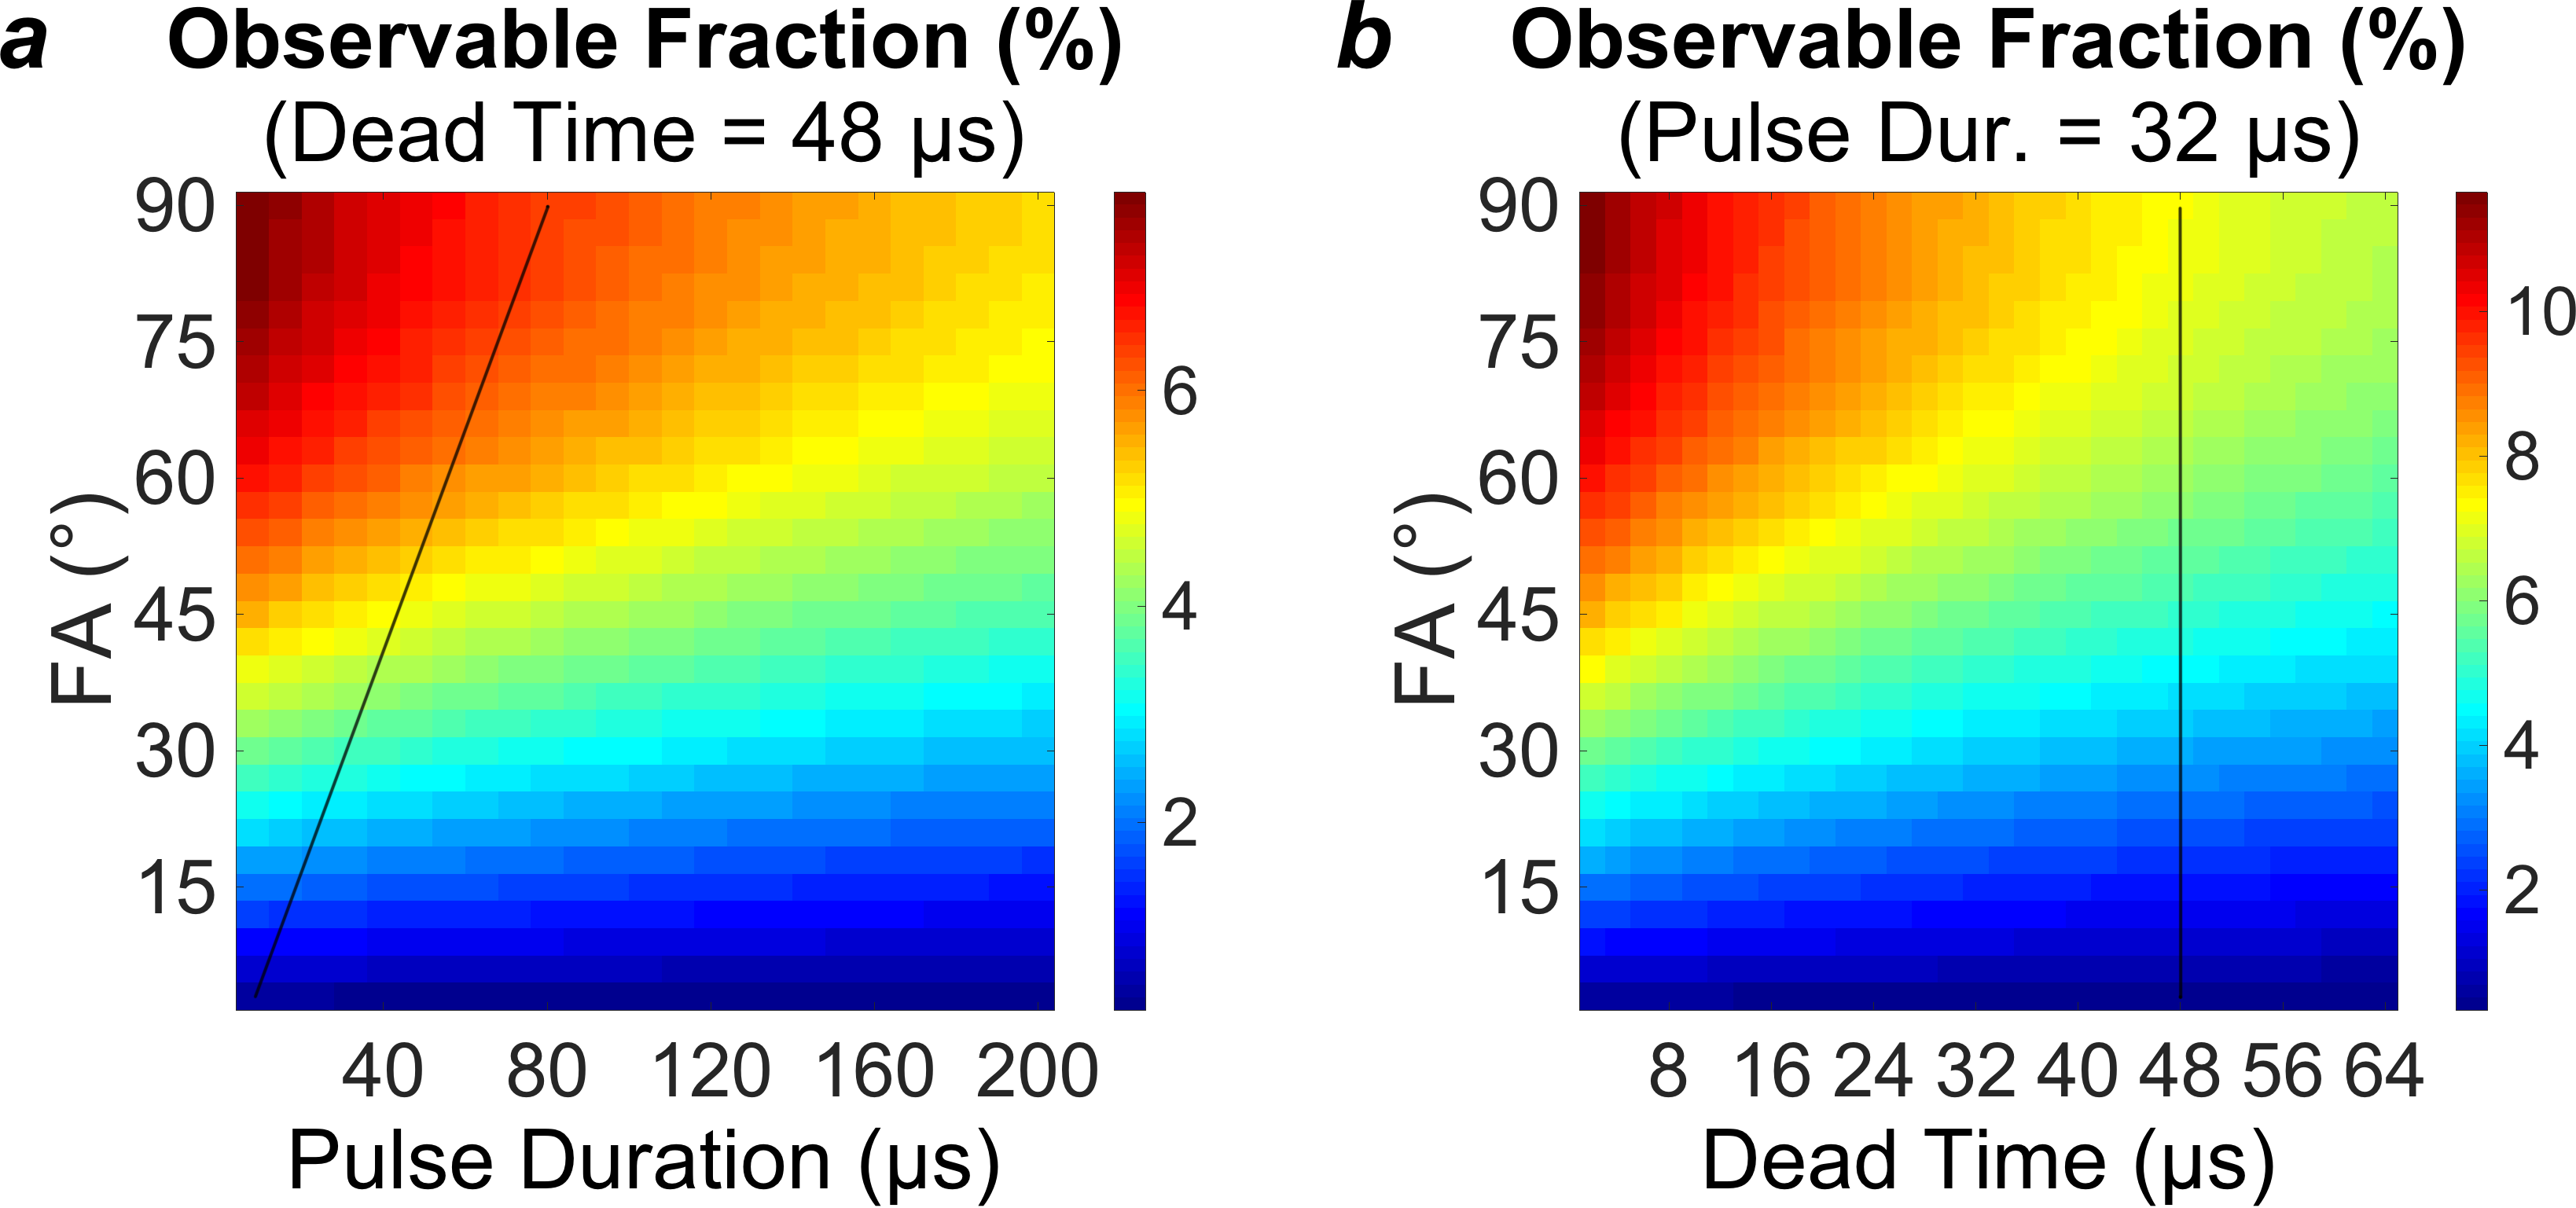
The acquired frequency spectrum, super-Lorentzian fit, and T2* spectrum are displayed in Fig. 2. At a reasonable set of parameters (pulse duration=32µs, flip angle=40º, and dead time=48µs), an IR-ZTE-PETRA pulse sequence would be able to observe 4.59% of the equilibrium magnetization. Under an extremely optimistic set of parameters (pulse duration=16µs, flip angle=90°, and dead time=8µs), 11.7% of the equilibrium magnetization would be observable. Maps of the observable signal fraction are displayed in Fig. 3.Discussion
In ZTE, the excitation RF pulse should use maximum power, so that pulse duration can be minimized for a given flip angle. This condition maps to a diagonal in Fig. 3a whose slope is proportional to the maximum transmit RF power. The dead time is dependent on the RF hardware, and is not user-selectable. The user is therefore effectively restricted to a diagonal line in the 3D space of simulated acquisition parameters.
The 5-ms adiabatic inversion pulse saturates the magnetization of myelin protons. This means that the available myelin signal results entirely from the magnetization recovered via longitudinal relaxation during the inversion-recovery time. Given the relatively long T1 of myelin 1H signal, the fraction of this recovered longitudinal magnetization is only about 15%, even before losses incurred due to transverse relaxation during the RF pulse and dead time are considered.
The primary contribution to the line width is dipole-dipole coupling. We therefore expect the T2* spectrum at clinical field strengths to differ only minimally from that at 9.4T.
Conclusion
Due to the extremely short lifetime of myelin lipid 1H signal, only approximately 5% of total magnetization is observable with pulse duration=32µs, flip angle=40º, and dead time=48µs.Acknowledgements
This work was supported by the National Institutes of Health Grant R21-NS082953.References
[1] Schmierer, K., Scaravilli, F., Altmann, D.R., Barker, G.J., Miller, D.H. Magnetization transfer ratio and myelin in postmortem multiple sclerosis brain. Ann Neurol 2004;56:407-415.
[2] Whittall, K.P., MacKay, A.L., Graeb, D.A., Nugent, R.A., Li, D.K., Paty, D.W. In vivo measurement of T2 distributions and water contents in normal human brain. Mag Res Med 1997;37:34-43.
[3] Wilhelm, M.J., Ong, H.H., Wehrli, S.L., Li, C., Tsai, P.H., Hackney, D.B., Wehrli, F.W. Direct magnetic resonance detection of myelin and prospects for quantitative imaging of myelin density. Proc Natl Acad Sci U S A 2016;109:9605-9610.
[4] Horch, R.A., Gore, J.C., Does, M.D. Origins of the ultrashort-T2 1H NMR signals in myelinated nerve: A direct measure of myelin content? Mag Res Med 2011;66:24-31.
[5] Grodzki, D.M., Jakob, P.M., Heismann, B. Ultrashort echo time imaging using pointwise encoding time reduction with radial acquisition (PETRA). Mag Res Med 2012;67:510-518.
[6] Norton, W.T. Isolation of myelin from nerve tissue. Methods Enzymol 1974;31:435-444.
[7] Wennerstrom, H. Proton nuclear magnetic resonance lineshapes in lamellar liquid crystals. Chem Phys Lett 1973;18:41-44.
[8] Wilhelm, M.J., Ong, H.H., Wehrli, F.W. Super-Lorentzian framework for investigation of T2* distribution in myelin. Proceedings of the 20th Annual Meeting of ISMRM, Melbourne, Australia, 2012, #2394.
Figures