1843
Higher variability of individual functional brain networks in young children with autism1Department of Bioengineering, School of Engineering and Applied Science, University of Pennsylvania, Philadelphia, PA, United States, 2Department of Radiology, Children’s Hospital of Philadelphia, Philadelphia, PA, United States, 3Department of Radiology, Perelman School of Medicine, University of Pennsylvania, Philadelphia, PA, United States, 4Beijing Children’s Hospital, Capital Medical University, Beijing, China, 5Department of Biomedical Engineering, School of Medicine, Tsinghua University, Beijing, China
Synopsis
Individual’s functional brain networks are sensitive indicators of behaviors. Atypical functional connectivity have been observed in children with autistic spectrum disorder (ASD), manifesting characteristic and distinctive behavior at ages of 2- to 7-years. However, little is known about individual variability of the functional brain networks in children with ASD. In this study, using resting-state fMRI and variability analysis, we quantified distinguished variability pattern in children with ASD from typically developing (TD) children from 2- to 7-years of age, especially in higher-order functional networks. The higher inter-subject variability in children with ASD may be associated with their impaired behaviors.
Target audience
Pediatric neuroradiologists, psychiatrists and neurologists.Purpose
Atypical functional connectivity (FC) has been observed in children with autism spectrum disorder (ASD) [1,2], manifesting characteristic and distinctive behavior at ages of 2- to 7-years [3]. However, little is known about individual variability of the functional brain networks in children with ASD. Individual variability in resting-state fMRI (rs-fMRI) signals across subjects reveals the variance of FC among subjects, which may be indicative of the individual differences in performance [4,5]. In this study, using rs-fMRI and variability analysis, we aimed to quantify distinguished variability pattern in children with ASD from typically developmental (TD) children aged 2-7 years.Methods
Subjects and data acquisition: 27 male children with ASD (ages: 2 to 7 years) and 20 age-matched male TD children (ages: 2 to 7 years) participated in this study. Children with ASD were medication naïve and diagnosed with ASD based on Autism Diagnostic Interview-Revised (ADI-R), Childhood Autism Rating Scale (CARS), Clancy Autism Behavior Scale (CABS), and Autism Behavior Checklist. T1w and rs-fMRI data were collected on a 3T Philips Achieva MR system with sedation. For rs-fMRI acquisition, echo-planar imaging (EPI) sequence was used with the following parameters: TR = 2000ms, TE = 24ms, number of slices = 35, slice thickness = 3 mm, gap = 1 mm, in-plane imaging resolution = 3.44×3.44 mm2, in-plane field of view (FOV) = 220×220 mm2, dynamics=200. Rs-fMRI preprocessing: The first 10 volumes for signal were removed. Subsequently, the slice timing, registration of functional images to T1 images, normalization, spatial smoothing, detrending, temporal filtering (0.01 to 0.1 Hz), and regression of several nuisance variables were conducted. Individual functional variability: Four groups of children with ASD were created, and the corresponding groups of children with TD were selected so that ages were most matched between paired ASD and TD groups. Each group of ASD or TD included 7 subjects. Due to limited overall number of subjects, some groups may have overlapped subjects. The individual functional variability in a certain voxel in a specific group was defined as 1 minus expected value of correlations between pairs of this voxel’s FCs from two subjects in this group [4].Results
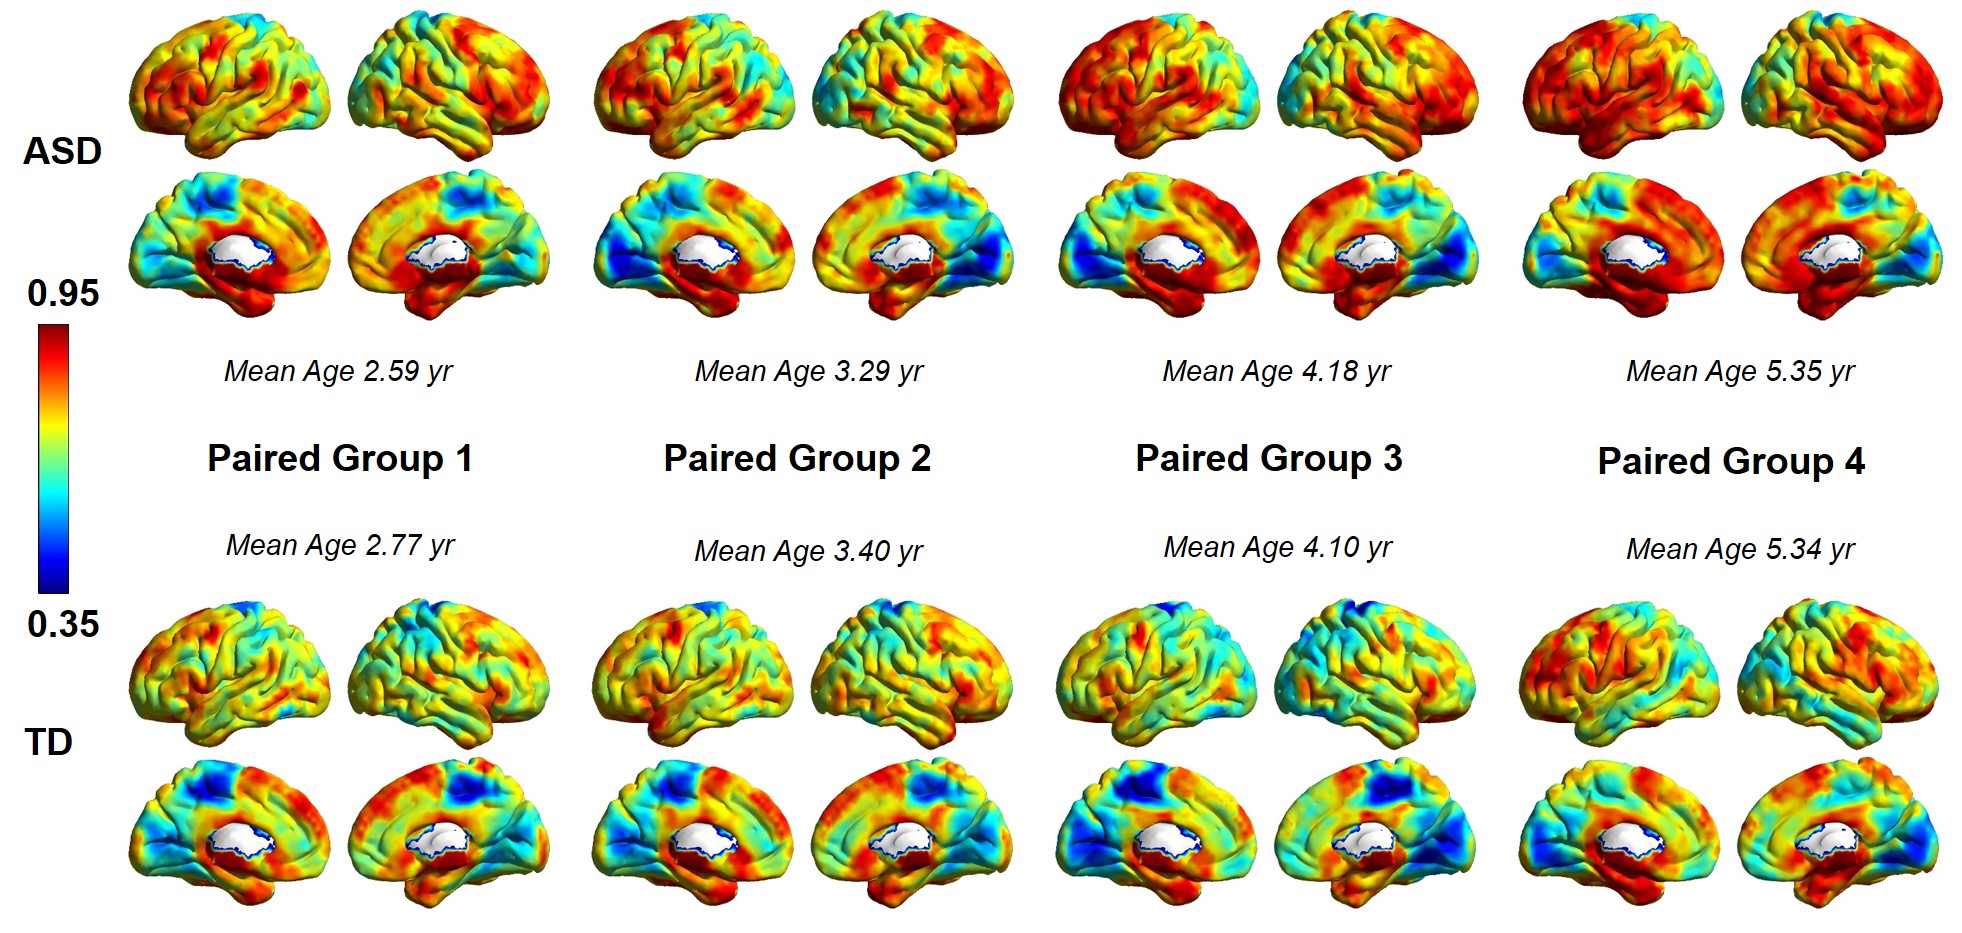
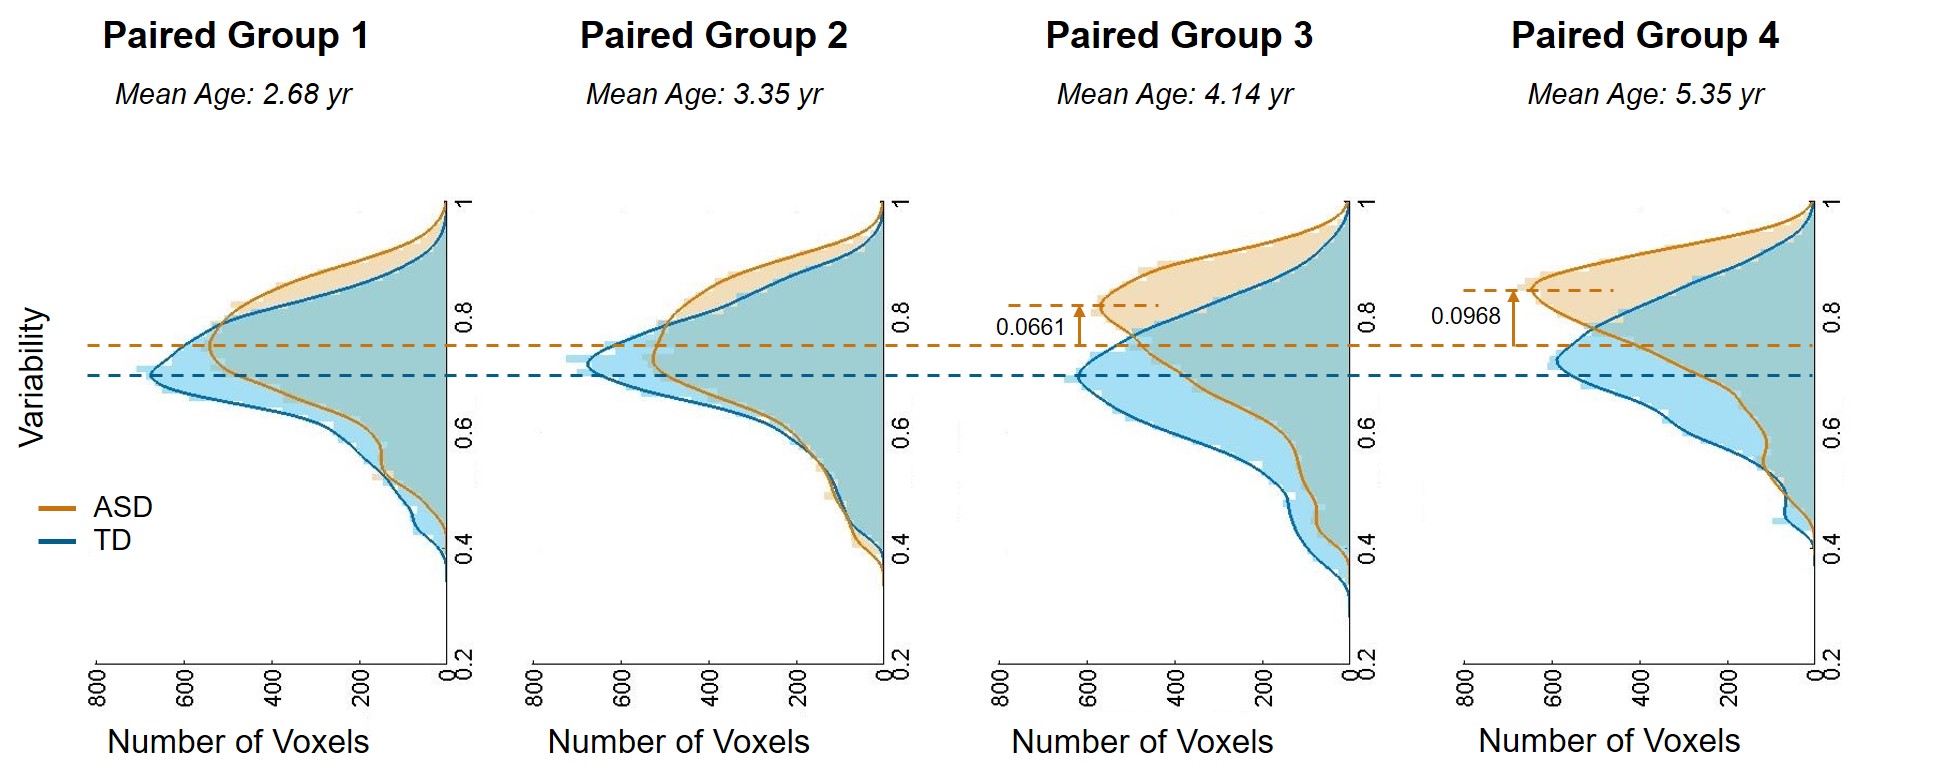
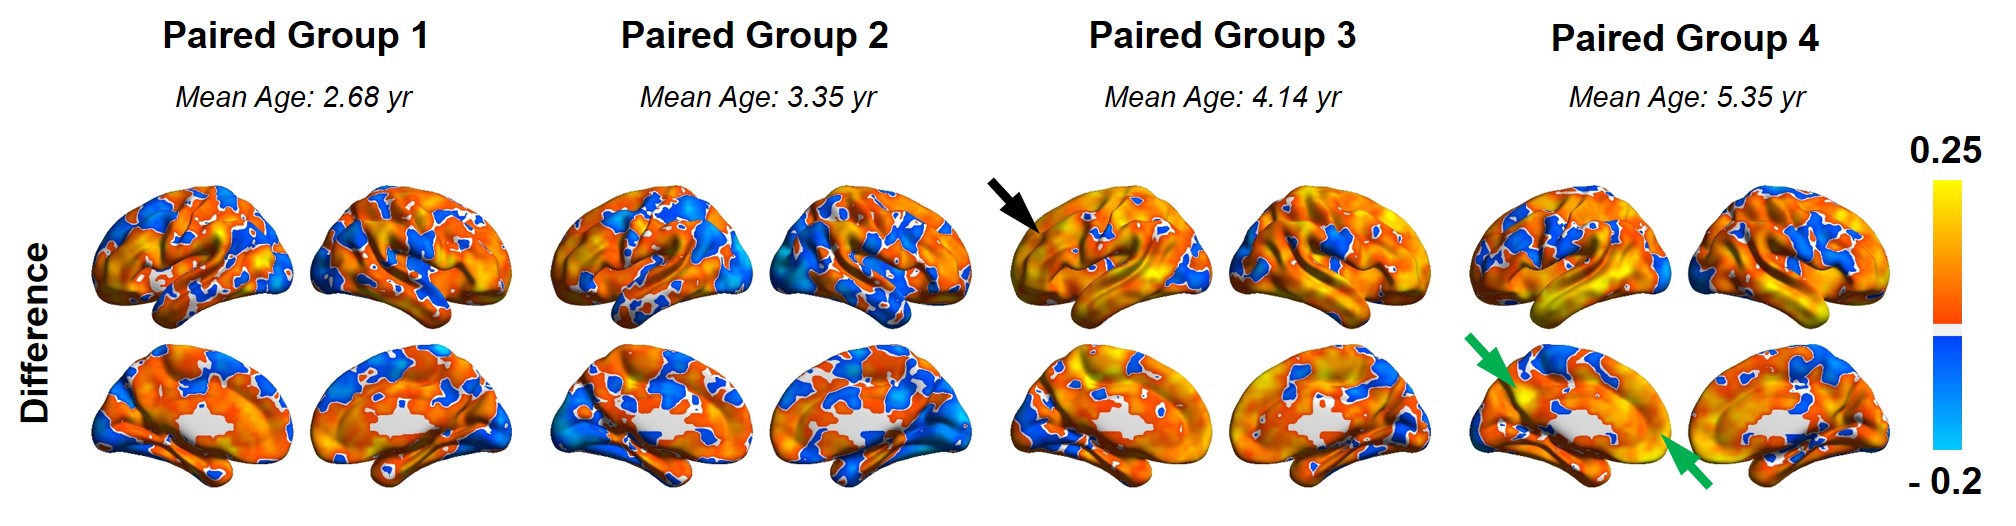
Figure 1 shows functional variability maps from 4 age-matched groups of children with ASD and those with TD. Higher variability in children with ASD compared to TD children can be observed across the age groups (Fig 1). Figure 2 demonstrates the variability profiles with the whole brain histograms of age-matched groups of children with ASD and TD. The peak of the density curves (kernel smoothing function estimates) shifted to higher values in ASD with age increase while no obvious changes of centralized variability values were observed among TD groups. Figure 3 illustrates the differences of variability between age-matched children with ASD and children with TD, revealing widespread higher variability in children with ASD (shown as red-yellow color in Figure 3), especially in higher-order functional networks such as frontoparietal network (black arrow) and default mode network (DMN, green arrows).Discussion and Conclusions
We found widespread higher functional variability across the brain cortical regions in children with ASD compared to age-matched TD children during the age of 2- to 7-years. Higher variability was especially apparent in the higher-order functional networks such as frontoparietal network and DMN. The presented results suggested divergence of functional connectivity development in ASD. With characteristic and distinctive behavior observed in children with ASD, the higher inter-subject variability among children with ASD may be associated with their impaired behavioral development in this age period [5]. The increased variability in DMN in children with ASD is consistent with the finding of lower inter-subject brain activity synchronization in posterior cingulate cortex and precuneus observed in individuals with ASD [6].Acknowledgements
This study is funded by NIH MH092535, MH092535-S1 and HD086984.References
[1] Di Martino, A., Kelly, C., Grzadzinski, R., Zuo, X. N., Mennes, M., Mairena, M. A., ... & Milham, M. P. (2011). Aberrant striatal functional connectivity in children with autism. Biological psychiatry, 69(9), 847-856.
[2] Uddin, L. Q., Supekar, K., Lynch, C. J., Khouzam, A., Phillips, J., Feinstein, C., ... & Menon, V. (2013). Salience network–based classification and prediction of symptom severity in children with autism. JAMA psychiatry, 70(8), 869-879.
[3] Dawson, G., Toth, K., Abbott, R., Osterling, J., Munson, J., Estes, A., & Liaw, J. (2004). Early social attention impairments in autism: social orienting, joint attention, and attention to distress. Developmental psychology, 40(2), 271.
[4] Mueller, S., Wang, D., Fox, M. D., Yeo, B. T., Sepulcre, J., Sabuncu, M. R., ... & Liu, H. (2013). Individual variability in functional connectivity architecture of the human brain. Neuron, 77(3), 586-595.
[5] Baldassarre, A., Lewis, C. M., Committeri, G., Snyder, A. Z., Romani, G. L., & Corbetta, M. (2012). Individual variability in functional connectivity predicts performance of a perceptual task. Proceedings of the National Academy of Sciences, 109(9), 3516-3521.
[6] Salmi, J., Roine, U., Glerean, E., Lahnakoski, J., Nieminen-von Wendt, T., Tani, P., ... & Rintahaka, P. (2013). The brains of high functioning autistic individuals do not synchronize with those of others. NeuroImage: Clinical, 3, 489-497.
Figures