1829
In search for a neuroimaging marker for neuroinflammation in neuropsychiatric systemic lupus erythematosus1Radiology, LUMC, Leiden, Netherlands, 2Radiology, UT Southwestern Medical Center, Dallas, TX, United States, 3Rheumatology, LUMC, Leiden, Netherlands
Synopsis
We explored the link between neuroinflammation and related changes in tissue susceptibility by using quantitative susceptibility mapping (QSM) in a clinically well characterized cohort including inflammatory NP-SLE, ischemic NP-SLE and SLE patients. No significant differences were found after stratifying all patients for antibodies, SLE activity, cumulative SLE damage or complement components in subcortical structures. Subanalysis of inflammatory NP-SLE patients showed a residual correlation between QSM values in the globus palidus and low C1q levels, which need further investigation. Current work is underway to analyse QSM in a bigger sample size to further investigate its potential in identifying NP-SLE patients.
Introduction
Systemic lupus erythematosus (SLE) is a relapsing-remitting female-predominant autoimmune disease characterized by acute or chronic inflammation of multiple organs. The involvement of the nervous system leads to a wide range of neuropsychiatric (NP) symptoms referred to as neuropsychiatric SLE (NP-SLE)1. NP-SLE is divided into two clinical phenotypes based on underlying pathophysiological processes: ischemic NP-SLE (characterized by vascular injury and occlusion) and inflammatory NP-SLE (characterized by immune-mediated inflammation). Depending on the suspected phenotype, patients are treated with anticoagulants or immunosuppressive therapy2. The characterization of NP-SLE phenotype, and in particular inflammatory NP-SLE remains a challenge.
Quantitative MRI techniques such as MTI and DTI have shown to be useful in identifying inflammatory NP-SLE3,4. However, both techniques indirectly link to inflammation and may reflect other underlying pathophysiological processes; In addition to microglia and reactive astrocytes, histological examination of NP-SLE brains have shown cerebral oedema, loss of neurons and myelinated axons, microinfarcts and diffuse ischaemic changes5. Evidence from several neurodegenerative and neurological diseases suggest that inflammation and iron dysregulation are closely linked via iron laden microglia, which can potentially have an effect on tissue susceptibility6-9.
In this study we aim to substantiate the link between neuroinflammation and related changes in tissue susceptibility by using quantitative susceptibility mapping (QSM) to examine alterations of magnetic susceptibility in a clinically well characterized NP-SLE cohort. In particular, we investigated the relationship between QSM values and clinical NP-SLE phenotypes, the correlation with antibody status and with other SLE-related variables including SLE activity and damage.
Methods
A total of 16 inflammatory NP-SLE patients (39 ± 13 years, 15 females/1 male), 12 ischemic NP-SLE patients (45 ± 12 years, 10 females/2 males), and 14 SLE patients with no NP symptoms (42 ± 12 years, all female) were scanned on a 3T Philips Achieva equipped with an 8-channel receive coil. All NP-SLE patients had at least one of the NP symptoms described by American College of Rheumatology. Single-echo T2*-weighted images (0.78x0.78x0.78mm, TR/TE=45/31ms, flip angle 13°) were acquired. STI Suite was used for QSM reconstruction. A Laplacian-based method was used for phase unwrapping, followed by background field removal using VSHARP. Finally, dipole inversion was performed using iLSQR. QSM data was warped into MNI152 space10,11,12 and mean QSM values were extracted from the following structures: nucleus accumbens, caudate nucleus, putamen, globus pallidus, hippocampus, amygdala and thalamus – inferred automatically from the T1-weighted scan using FSL-FIRST13. Statistical comparisons were done using SPSS.Results
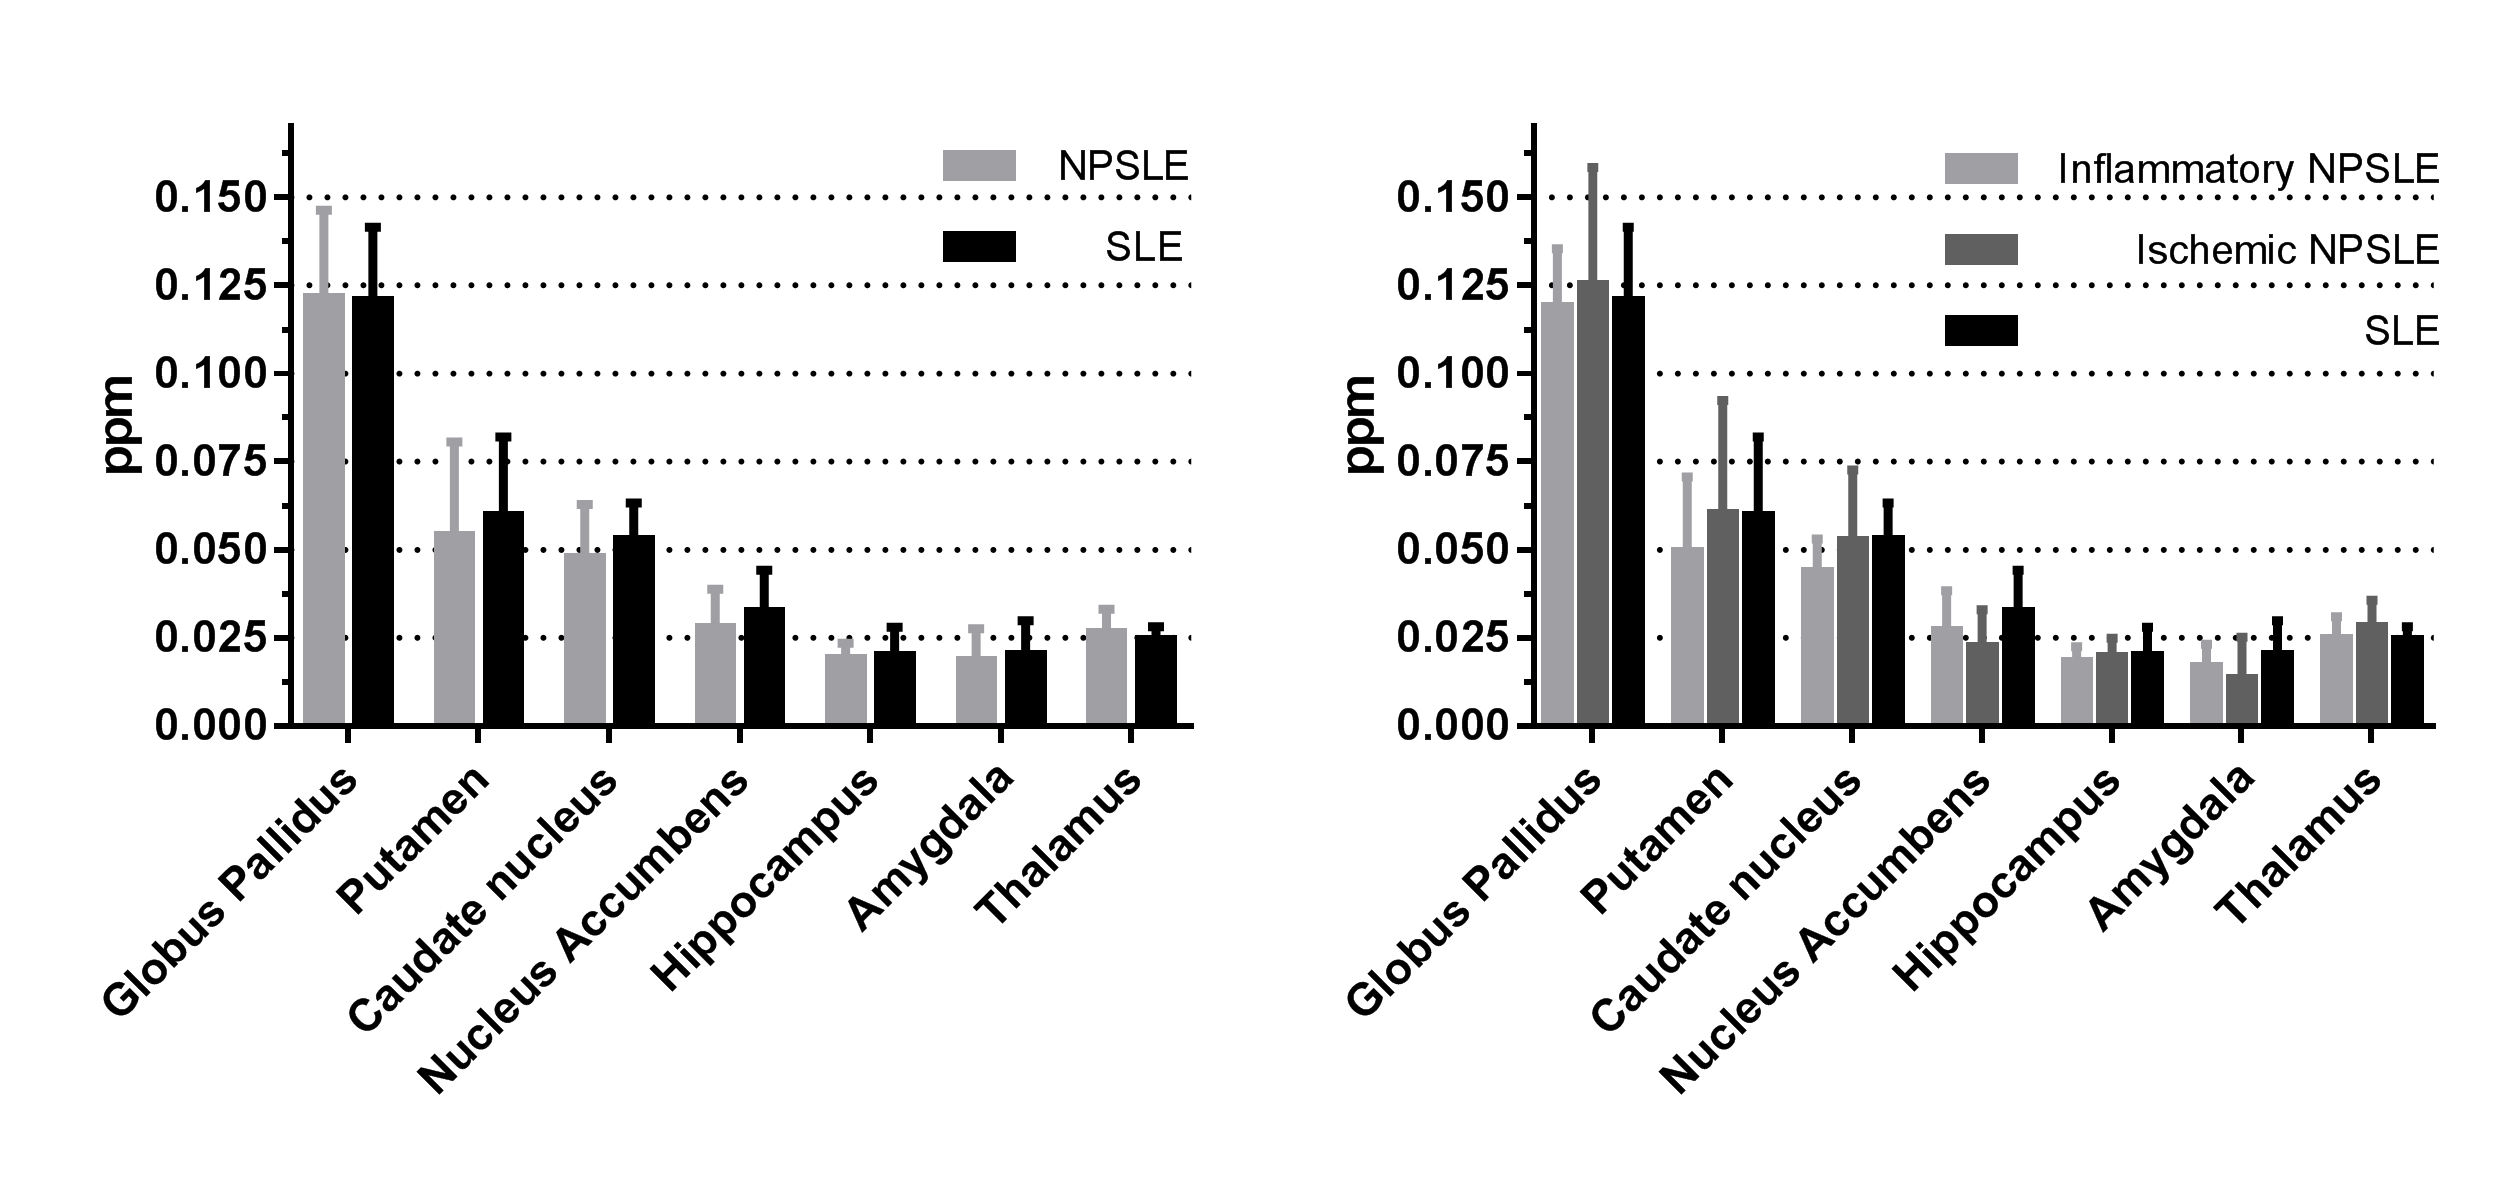
Figure 1 shows mean QSM values of seven subcortical structures in both NP-SLE and SLE patients. Consistent with previous studies, highest QSM values were found in the globus pallidus, followed by the putamen and caudate nucleus14,15. No significant differences were found between NP-SLE and SLE patients or when NP-SLE phenotypes were compared.
Stratifying all patients for SLE antibodies (Lupus anticoagulant, anticardiolipin IgG and IgM, β 2-glycoprotein I IgG and IgM, anti-dsDNA, anti-Ro, anti-La, anti-Sm and anti-RNP), SLE activity measured with the SLE disease activity index 2000 (SLEDAI-2K), cumulative SLE damage measured with SDI (SLICC damage index), and complement components C1q, C3 and C4 showed no significant differences in any subcortical structure. A subanalysis in inflammatory NP-SLE patients show a residual correlation between QSM values in the globus palidus and low C1q levels, which may warrant further investigation (Figure 2).
Discussion and Conclusion
This is the first study investigating inflammation using QSM in a clinically well characterized cohort of active inflammatory NP-SLE, ischemic NP-SLE and SLE patients. We failed to show an association between these groups and QSM values which may indicate that other mechanisms than inflammation may lead to inflammatory NP-SLE. Our results suggest that QSM may detect inflammation in the globus pallidus of inflammatory NP-SLE patients with low C1q levels, however, further investigation in a larger sample size is needed. Current work is underway to analyse this technique in a bigger sample of our cohort and to combine MTI and QSM data to further investigate the potential of QSM in identifying NP-SLE patients and to extend the QSM analysis to cortical gray matter as well as to white matter. In addition, regions showing higher QSM values will be selected for histological confirmation in post-mortem NP-SLE brain tissue using both ex-vivo high resolution MRI and histopathology of iron and neuroinflammatory markers.Acknowledgements
No acknowledgement found.References
1. Magro-Checa, C et al.Management of Neuropsychiatric Systemic Lupus Erythematosus: Current Approaches and Future Perspectives. Drugs, 2016
2. Zirkzee, E.J., et al., Prospective study of clinical phenotypes in neuropsychiatric systemic lupus erythematosus; multidisciplinary approach to diagnosis and therapy. J Rheumatol, 2012.
3. Ercan, E., et al., A multimodal MRI approach to identify and characterize microstructural brain changes in neuropsychiatric systemic lupus erythematosus. Neuroimage Clin, 2015.
4. Magro-Checa, C., et al., Changes in White Matter Microstructure Suggest an Inflammatory Origin of Neuropsychiatric Systemic Lupus Erythematosus. Arthritis Rheumatol, 2016.
5. Sibbitt, W.L., Jr., et al., Magnetic resonance imaging and brain histopathology in neuropsychiatric systemic lupus erythematosus. Semin Arthritis Rheum, 2010.
6. Haacke, E.M., et al., Imaging iron stores in the brain using magnetic resonance imaging. Magn Reson Imaging, 2005.
7. Langkammer, C., et al., Quantitative susceptibility mapping in multiple sclerosis. Radiology, 2013. 8. Mehta, V., et al., Iron is a sensitive biomarker for inflammation in multiple sclerosis lesions. PLoS One, 2013.
9. Ogasawara, A., et al., Quantitative susceptibility mapping in patients with systemic lupus erythematosus: detection of abnormalities in normal-appearing basal ganglia. Eur Radiol, 2016.
10. Woolrich, M.W., et al., Bayesian analysis of neuroimaging data in FSL. Neuroimage, 2009.
11. Jenkinson, M., et al., Improved optimization for the robust and accurate linear registration and motion correction of brain images. Neuroimage, 2002.
12. Jenkinson, M. and S. Smith, A global optimisation method for robust affine registration of brain images. Med Image Anal, 2001.
13. Patenaude, B., et al., A Bayesian model of shape and appearance for subcortical brain segmentation. Neuroimage, 2011.
14. Acosta-Cabronero, J., et al., The whole-brain pattern of magnetic susceptibility perturbations in Parkinson's disease. Brain, 2017.
15. van Bergen, J.M., et al., Quantitative Susceptibility
Mapping Suggests Altered Brain Iron in Premanifest Huntington Disease. AJNR Am
J Neuroradiol, 2016.
Figures