1818
MR Spectroscopic evaluation of brain white matter metabolite abnormalities in Psychotic Spectrum Disorders1Department of Radiology, Bernard and Irene Schwartz Center for Biomedical Imaging, New York University School of Medicine, New York, NY, United States, 2Department of Rehabilitation Medicine, New York University School of Medicine, New York, NY, United States, 3Department of Radiology, Center for Advanced Imaging Innovation and Research (CAI2R), New York University School of Medicine, New York, NY, United States, 4Department of Psychiatry, New York University School of Medicine, New York, NY, United States
Synopsis
1H-MRS has been widely applied in studies with Psychotic Spectrum Disorders, however, findings are mixed and the exact cause of these disorders remains to be elucidated.The preliminary results of the present study show increased Gln/Cr levels in schizophrenia and schizoaffective patients in central WM reaching statistical significance in the bipolar group. The increase in Gln/Cr levels has been proposed to occur in the early stages of the disorder which is consistent with the population included here. The current study brings WM as a relevant area susceptible to damage into focus, which is likely to be involved in the early stages of PSD.
BACKGROUND
Psychotic Spectrum Disorders (PSD), including schizophrenia (SZ), schizoaffective disorder (SZA), and bipolar disorder with psychotic features (BP) are chronic complex disabling disorders, which usually develop in adolescence or early adulthood (1) and have a profound impact on psychological, interpersonal and sociocultural factors both over the lifetime and in daily functioning. Although the exact cause of these disorders remains to be elucidated, 1H-MRS studies have been increasingly performed and have provided a great body of neurochemical data. However, most of the previous research focused on identifying metabolic abnormalities in grey matter (GM) with less attention given to white matter (WM), despite its relevance to cognitive dysfunction, a core feature of these disorders. This study aimed to measure relevant neurochemical markers, including N-acetyl-aspartate (NAA), total creatine (tCr), total choline (tCho), glutamine (Gln), glutamate (Glu) and myo-inositol (mI), which are reflective of neuronal health and glial activation. Mean WM values of these metabolites were obtained using whole brain MRSI at 3T.
METHODOLOGY
Participants
Patients diagnosed with PSD (SZ or SZA, n=12) or BP (n=5) and healthy age-matched control subjects (n=17) were recruited from the community and clinician referrals. All participants were aged 18 to 30 years old with most patients diagnosed within the last five years. For diagnosis confirmation, all subjects provided a structured clinical interview (Diagnostic Interview for Genetic Studies). Age-matched controls were recruited from advertisements within the community and through the `ResearchMatch` website and had no personal or family history of psychosis and no known neurological or psychiatric disorders.
Imaging protocol
All MR examinations were performed at 3T (Siemens Medical Solutions, Erlangen, Germany) using a 64-channel phased array head and neck coil. The MR imaging protocol included a T1-weighted MPRAGE based on the Human Connectome Protocol (0.8 mm isotropic voxels) and whole brain volumetric MRSI, acquired using echo-planar acquisition with spin-echo excitation; TR/TE = 1710/17.6ms; non-selective lipid inversion nulling with TI = 198ms; an FOV of 280 × 280 × 180mm3 ; matrix size of 50 × 50 with 18 slices; ETL 1000 points; bandwidth 2500 Hz; reduced k-space sampling (acceleration factor = 0.7), a nominal voxel volume of 0.313 cm3, and acquisition time of 17 min. Acquisition included a water reference measurement that was interleaved with the metabolite signal acquisition.
Data Analyses
MRSI data were analyzed using the MIDAS software (Maudsley et al., 2009, 2006). Processing included; corrections for B0 shifts, generation of white-, gray-matter, and CSF tissue segmentation maps using SPM12, lipid k-space extrapolation, and linear registration between T1-weighted MR and whole-brain MRSI. Metabolite maps (NAA, tCho, tCre, Glu, Gln and mI) were interpolated to 64 × 64 × 32 points and where spatially transformed and interpolated to a standard spatial reference in MNI space at 2 mm isotropic resolution. The ROI that included the central WM was defined in subject space using inverse spatial transformation of the ROIs defined in the John Hopkins WM brain atlas. To improve detection of the metabolites, spectra were averaged by summing voxels within the central WM ROI. Group comparisons for imaging measures were performed using one way ANOVA with Bonferroni correction for multiple comparisons (SPSS 23).
RESULTS & DISCUSSION
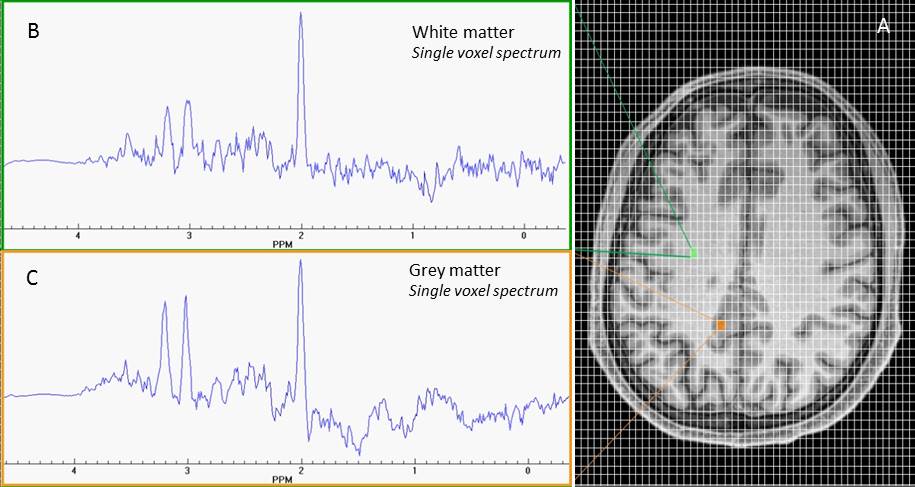
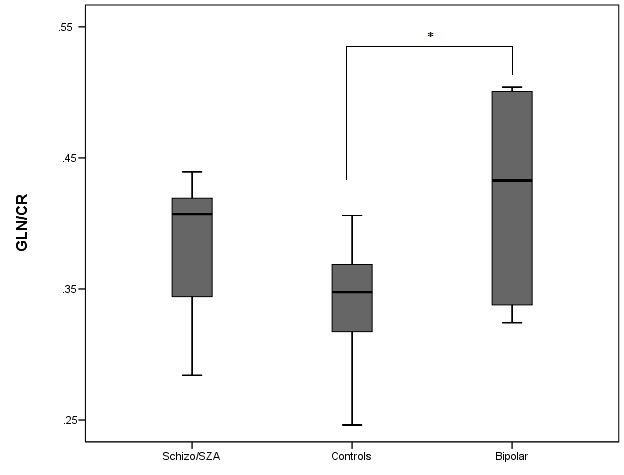
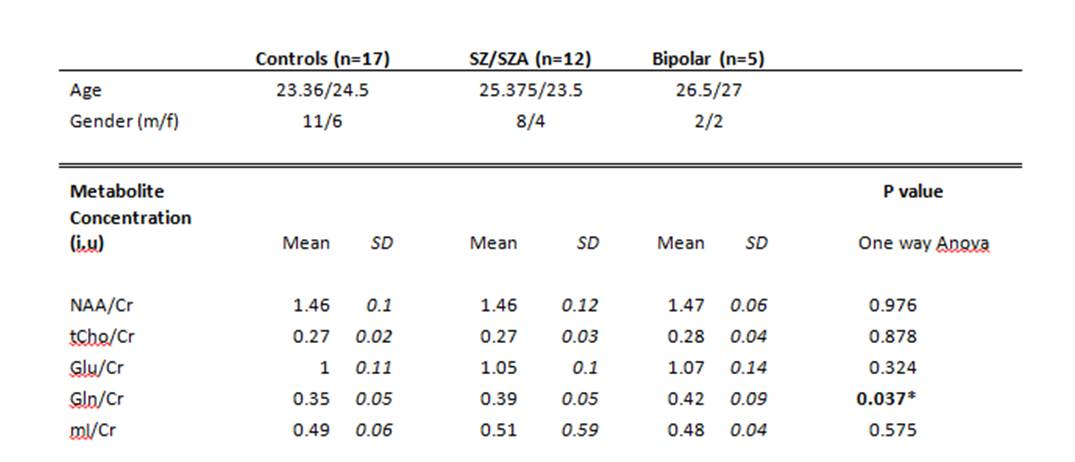
Figure 1 shows a representative axial T1-weighted MRI image from a healthy subject superimposed by an MRSI grid and example single voxel spectra obtained in GM and WM. An example of summed spectra for the central WM is shown in Figure 2. Mean NAA, tCho, tCre, Glu, Gln, mI relative to Cr for the central WM are shown in Table 1. Preliminary statistical analyses show increased Gln/Cr in patients in central WM reaching statistical significance in the BP group (p=0.05) and at trend level in the SZ/SZA group (p=0.06) (Figure 3; Table 1). Previous research has consistently shown WM abnormalities in SZ, SZA and BP (1, 5-6). The glutamine increase observed in these preliminary data supports the glutamatergic hypothesis, a prevalent theory in PSD research, and may reflect an early neural insult that affects primarily astrocytes, which protect neurons and glial cells. When damage is not severe or destructive, astrocytes in affected brain regions may produce more glutamine (3, 4). The increase in Gln/Cr levels has been proposed to occur in the early stages of the disorder which is consistent with the population included here. The current study brings white matter as a relevant area susceptible to damage into focus, which is likely to be involved in the early stages of PSD. Optimized methods to assess glutamatergic dysfunction in PSD may lead to improved treatment strategies of these disorders.Acknowledgements
This work has been funded by National Institute of Mental
Health.
We would like to thank Andrew A. Maudsley and Sulaiman
Sheriff for their help and support concerning the MIDAS software.
References
1. Cariaga-Martinez A, et al. (2016) From Linkage Studies to Epigenetics: What we know and what we need to know in the neurobiology of schizophrenia. Front Neurosci (11);10: 202
2. Schwerk A, et al. (2014) Metabolic alterations associated with schizophrenia: a critical evaluation of proton magnetic resonance spectroscopy studies. J Neurochem (1): 1-87
3. Xu H, et al. (2016) Evaluation of neuron-glia integrity by in vivo proton magnetic resonance spectroscopy: Implications for psychiatric disorders. Neurosci Biobehav Rev (71): 563-577
4. Pereira FC, et al. (2008) Acute increase of the glutamate-glutamine cycling in discrete brain areas after administration of a single dose of amphetamine. Ann N Y Acad Sci (1139): 212-221
5. Kumar J, et al. (2015) Shared white-matter dysconnectivity in schizophrenia and bipolar disorder with psychosis. Psychol Med (4): 759-770
6. Bustillo JR, et al. (2017) Glutamatergic and neuronal dysfunction in gray and white matter: A spectroscopic imaging study in a large schizophrenia sample. Schizophr Bull (3): 611-619
Figures