1817
Histoarchitectonically distinct regions of anterior cingulate show altered glutamatergic metabolism in major depressive disorder1Department of Psychiatry and Psychotherapy, University of Tübingen, Tübingen, Germany, 2High-Field Magnetic Resonance, Max Planck Institute for Biological Cybernetics, Tübingen, Germany, 3Otto von Guericke University, Magdeburg, Germany, 4Clinical Affective Neuroimaging Laboratory (CANLAB), Magdeburg, Germany, 5Leibniz Institute for Neurobiology, Magdeburg, Germany, 6School of Psychology and Cognitive Science, East China Normal University, Shanghai, China, 7Department of Psychiatry and Psychotherapy, Otto von Guericke University, Magdeburg, Germany, 8Biomagnetical Resonance, Otto von Guericke University, Magdeburg, Germany
Synopsis
Increasing evidence suggests a hypoglutamatergic state in major depressive disorder (MDD), however spatial- and metabolite specific abnormalities have not been fully characterized. Using short TE/TM STEAM MRS, we evaluated Glu, Gln, Gln/Glu and GABA metabolism in two histoarchitectonically distinct subdivisions of the anterior cingulate cortex (ACC). The pregenual ACC, involved in emotion processing, showed altered glutamine-glutamine cycling but not altered GABAergic metabolism in MDD, whereas no differences between patients and controls were found in the anteromedial ACC. Increased Gln/Glu in MDD in pgACC but not aMCC confirms a regionally specific role of altered glutamatergic metabolism and neuronal-glial interaction.
Introduction
Increasing evidence suggests a hypoglutamatergic state in major depressive disorder (MDD).1,2,3. At field strengths of 3T or lower, these findings are usually reported as “glx”, a compound measure of glutamate (Glu) and its precursor, glutamine (Gln).1,2 Spatial- and metabolite specific abnormalities in MDD have thus far not been characterized. At an ultra-high field strength of 7 Tesla, it is possible to separately evaluate Glu, Gln, but also GABA in a single measurement. Higher spatial resolution at 7 Tesla also allows for evaluation of glutamatergic and GABAergic metabolism in subdivisions of the anterior cingulate cortex (ACC).4 The pregenual part of ACC is involved in emotion processing and has been implicated in the pathophysiology of depression.3,5 Together with pgACC, we also investigated the dorsal anteromedial cingulate cortex (aMCC), considering with its histoarchitectonic delineation, inverse patterns of AMPA and NMDA receptor densities6 and metabolite concentrations.7 In this study, for the first time we investigated altered glutamatergic and GABAergic metabolism in biologically meaningful subdivisions of the anterior cingulate cortex in depression.Methods
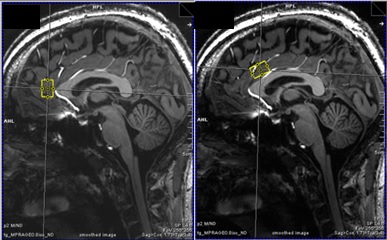
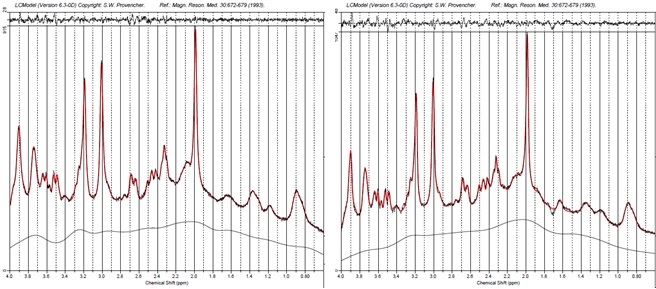
27 patients with MDD (12 male) and 27 age- and sex-matched healthy control subjects (12 male) were recruited in this study. All measurements were carried out on a 7T MR scanner (Siemens Magnetom, Siemens, Erlangen, Germany) using a 24-channel head array coil (Nova Medical, Siemens, Erlangen, Germany). Single voxel MRS measurements were planned on MPRAGE images reconstructed in AC-PC orientation (TE = 2.73 ms, TR = 2300 ms, TI = 1050 ms, flip angle = 5°, bandwidth = 150 Hz/pixel, voxel size = 0.8 mm3). We used a previously established 1H-MRS protocol to simultaneously measure Glu, Gln and GABA relative to Creatine in two histoarchitectonically distinct ACC subregions. A STEAM sequence with short TE/mixing time (20 ms/10 ms) was used to achieve high SNR and low CRLBs for measuring GABA, Glu and Gln. The pgACC voxel (20 x 15 x 10 mm3) was prescribed using the following landmarks: anterior border of the genu of the corpus callosum perpendicular to AC-PC marked the posterior boundary of the voxel; lower boundary of the genu in AC-PC orientation was aligned with the ventral border of the voxel.[M1] The aMCC voxel prescription (25 x 15 x 10 mm3) was such that in the sagittal plane, the voxel was centered around an axis perpendicular to AC-PC at the posterior border of the genu and the ventral boundary of the voxel was parallel to the curve of the corpus callosum. Spectra were fit using LCModel V.6.3.0.8 We performed univariate analyses of covariance for Glu/tCr, Gln/tCr, and GABA/tCr for both regions separately to investigate metabolic differences between MDD patients and controls. Sex, age, and voxel grey matter ratio were used as covariates.Results
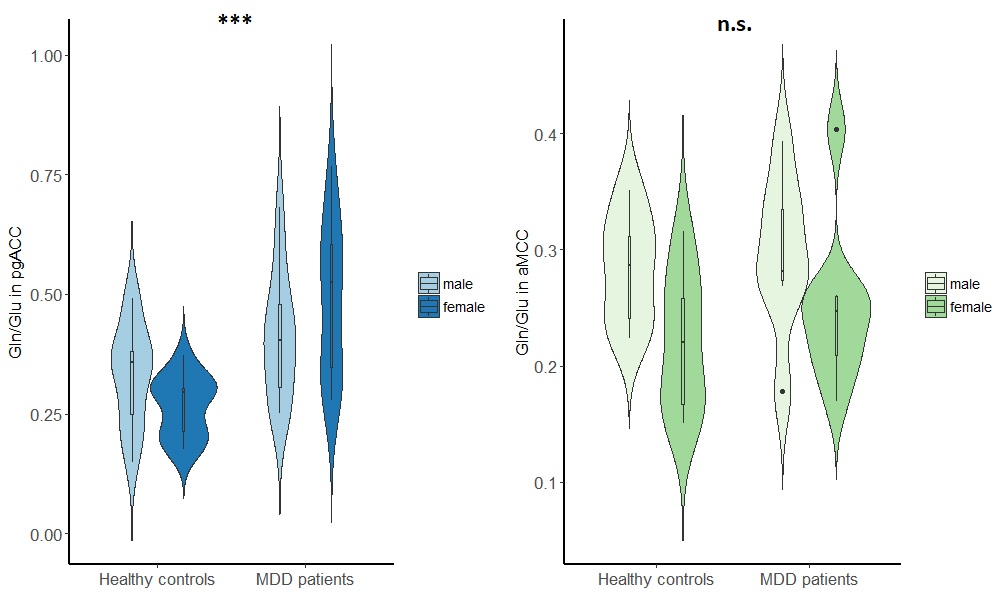
In MDD patients in the pgACC, Glu/tCr was significantly reduced compared to healthy controls, F(1,49) = 6.16, p = .017, while Gln/tCr in this region was significantly increased in patients versus controls, F(1,47) = 6.71, p = .013. Moreover, the pgACC Gln/Glu ratio was significantly altered in MDD patients, F(1,47) = 12.62, p = 0.001. In contrast, GABAergic metabolism in pgACC was not affected in MDD (GABA/tCR, F(1,43) = 0.135, p = .715. Identical analyses revealed no significant differences in glutamatergic (Glu/tCR, Gln/tCr, Gln/Glu) or GABAergic metabolism in the aMCC.Discussion
Our findings are in accord with previous findings of altered glutamate and glutamine levels and ratio in the MDD in the pgACC.2 Moreover, the increased glutamine and decreased glutamate indicate that the turnover of glutamine to glutamate is reduced at rest. Rather than reporting glx, a compound measure of Glu and Gln, a short TE/TM STEAM sequence7 allowed us to simultaneously assess Glu, Gln and GABA levels. Ultra-high field strengths of 7T, and concomitant increased SNR, ensured the reliable measurement of these metabolites in small voxels. This allowed us to capture spatial specificity at sub-region level of abnormal glutamatergic metabolism in depression. Sex-independent altered glutamatergic metabolism was found only in the pgACC, a region crucial in emotional regulation, but not in the aMCC.Conclusion
An increase of Gln/Glu in MDD, in the pgACC but not the aMCC confirms a regionally specific role of altered glutamatergic metabolism and neuronal-glial interaction.Acknowledgements
References
1. Auer, D. P., Pütz, B., Kraft, E., Lipinski, B., Schill, J., & Holsboer, F. (2000). Reduced glutamate in the anterior cingulate cortex in depression: an in vivo proton magnetic resonance spectroscopy study. Biological psychiatry, 47(4), 305-313.
2. Yüksel, C., & Öngür, D. (2010). Magnetic resonance spectroscopy studies of glutamate-related abnormalities in mood disorders. Biological psychiatry, 68(9), 785-794.
3. Walter, M., Henning, A., Grimm, S., Schulte, R. F., Beck, J., Dydak, U., ... & Northoff, G. (2009). The relationship between aberrant neuronal activation in the pregenual anterior cingulate, altered glutamatergic metabolism, and anhedonia in major depression. Archives of general psychiatry, 66(5), 478-486.
4. Vogt, B. A., Berger, G. R., & Derbyshire, S. W. (2003). Structural and functional dichotomy of human midcingulate cortex. European Journal of Neuroscience, 18(11), 3134-3144.
5. Horn, D. I., Yu, C., Steiner, J., Buchmann, J., Kaufmann, J., Osoba, A., ... & Biswal, B. (2010). Glutamatergic and resting-state functional connectivity correlates of severity in major depression–the role of pregenual anterior cingulate cortex and anterior insula. Frontiers in systems neuroscience, 4.
6. Palomero‐Gallagher, N., Vogt, B. A., Schleicher, A., Mayberg, H. S., & Zilles, K. (2009). Receptor architecture of human cingulate cortex: evaluation of the four‐region neurobiological model. Human brain mapping, 30(8), 2336-2355.
7. Dou, W., Palomero-Gallagher, N., van Tol, M. J., Kaufmann, J., Zhong, K., Bernstein, H. G., ... & Walter, M. (2013). Systematic regional variations of GABA, glutamine, and glutamate concentrations follow receptor fingerprints of human cingulate cortex. Journal of Neuroscience, 33(31), 12698-12704.
8. Provencher, S. W. (2001). Automatic quantitation of localized in vivo1H spectra with LCModel. NMR in Biomedicine, 14(4), 260-264.
Figures