1815
Diffusion kurtosis imaging and white matter model analysis of the brains of patients with major depressive disorder1Department of Radiology, the University of Tokyo, Tokyo, Japan, 2Department of Radiology, Juntendo University, Tokyo, Japan, 3Department of Neuropsychiatry, the University of Tokyo, Tokyo, Japan, 4Department of Radiology, the University of Tokyo Hospital, Tokyo, Japan, 5Department of Radiology, the Institute of Medical Science, the University of Tokyo, Tokyo, Japan
Synopsis
We investigated the brain microstructural changes in major depressive disorder (MDD) using DKI and biophysical modelling. Twenty-six patients with MDD and 42 healthy control subjects were enrolled. TBSS whole brain analyses showed decrease of MK and RK in the patients as compared to the controls, predominantly in the frontal lobe, but widely distributed in the cerebral white matter. Model analysis revealed smaller intra-axonal volume fraction in the corpus callosum. The present results indicate the ability of DKI to demonstrate MDD pathology that are not fully depicted by DTI, and possibly to provide a new insights into the pathophysiology of MDD.
Introduction
Major depressive disorder (MDD) is a globally prevalent psychiatric disorder, and is related to a combination of genetic and environmental factors, leading to alterations in the biochemistry, neuroplasticity, and structure of the brain. Although the previous DTI studies found smaller FA in patients with MDD compared to the controls predominantly in the frontal lobe1, studies using DKI are scarce. This study investigated the brain microstructural changes in MDD, using DKI whole-brain analysis with tract-based spatial statistics (TBSS) and a biophysical model.Methods
Study subjects: Twenty-six patients with MDD (39.2 ± 9.9 years old) and 42 age- and sex-matched control subjects (38.0 ± 8.8 years old) were enrolled.
Data acquisition: Diffusion MRI data were acquired using a 3-T unit (Discovery MR750w, GE Healthcare). A single-shot EPI sequence was used with three diffusion weightings (b = 1000, 1500, and 2000 s/mm2) along 30 non-collinear directions, and 5 b = 0 s/mm2 volumes (TR = 13,000 ms; TE = 86.1 ms; voxel size = 1.88 × 1.88 × 2.50 mm3; δ/Δ = 35.1/44.7 ms).
TBSS: Voxel-wise statistical analysis of the DTI and DKI metrics was carried out using the FSL TBSS routine. Permutation test was performed (FSL’s randomise) to examine differences between the groups, with age and sex as nuisance covariates.
Biophysical model: We adopted a widely used
two-compartment model2,3, that consists of narrow impermeable “sticks”
(representing axons) and extracellular matrix. The signal is given by $$S(b,\hat{g}) = \int_{S_2} d\hat{n}{\cal P}(\hat{n}){\cal K}(b,\hat{g}\cdot\hat{n}) ~~~~~ (1) $$ with $${\cal K}(b,\hat{g}\cdot\hat{n}) = fe^{-bD_a(\hat{g}\cdot\hat{n})^2}+(1-f)e^{-bD_{e\perp}-b(D_{e\parallel}-D_{e\perp})(\hat{g}\cdot\hat{n})^2} ~~~~~ (2) $$, where $$$S$$$ denotes
the signal normalized to that of
$$$b=0$$$, $$$f$$$
the intra-axonal volume fraction,
$$${\cal P}(\hat{n})$$$
the fiber ODF,
$$$D_a$$$
the
intra-axonal diffusivity,
$$$D_{e\parallel}$$$ and $$$D_{e\perp}$$$
the
axial and radial extra-axonal diffusivity, respectively. We used the recently
introduced rotationally invariant framework2,3, where the
parameter estimation becomes the following non-linear least squares problem $$\hat{x} = {\rm arg~min} \sum_{l=0,2,...}^{L}\sum_{j=1}^{N_b} \{ S_l(b_j) - p_lK_l(b_j,\hat{x}) \}^2 ~~~~~ (3) $$
with
$$$\hat{x}=\{ f, D_a, D_{e\parallel}, D_{e\perp}, p_l \}$$$,
the model parameters to be estimated.
$$$K_l$$$ are the projections of kernel
$$${\cal K}(b,\hat{g}\cdot\hat{n})$$$
onto Legendre polynomials. The rotational
invariants
$$$S_l$$$ and $$$p_l$$$ are defined as: $${S_l}^2=\sum_{m=-l}^{l}{S_{lm}}^2 / 4\pi(2l+1), ~~~ {\rm and} ~~~{p_l}^2=\sum_{m=-l}^{l}{p_{lm}}^2 / 4\pi(2l+1) ~~~~~ (4) $$ ,
where $$$S_{lm}$$$ and $$$p_{lm}$$$ are the spherical harmonic coefficients. Here, we solved the problem (3) for
$$$L=2$$$ 2,3.
We used 25 random initializations within the
biophysically plausible range ($$$0~{\le}~f~{\le}~1$$$, $$$0~{\le}~p_2~{\le}~1$$$, and $$$0~{\le}~D~{\le}~3$$$
for all
diffusivities), and adopted the most prevalent solution found by kernel density
estimation. The accuracy of parameter estimation was examined with simulations
for a range of ground truth values with added noise (Figures 1 and 2).
Results
TBSS (Figure 3): The patients with MDD showed significantly smaller FA in the frontal portion of the corpus callosum compared to the controls. Regions with significantly smaller MK and RK were more widely distributed, predominantly in the frontal lobe, but extending into the parietal, occipital, and temporal lobes. Within the corpus callosum, the MK and RK abnormalities were located posterior to the that of FA.
Biophysical model (Figures 4 and 5): ROI-based analyses in the corpus callosum revealed smaller axonal volume fraction in the body of callosum in the patients with MDD. Also, smaller $$$p_2$$$ in the genu and smaller $$$D_{e\perp}$$$ in the sensory region were observed.
Discussion & Conclusion
- The present results show that DKI is capable of demonstrating microstructural alterations in the brain of patients with MDD that cannot be fully depicted by conventional DTI. The observed extensive DKI abnormalities are consistent with the recent concepts of MDD as a network disorder caused by disruption of multiple neuronal circuits4. Furthermore, the biophysical model provided possible interpretations for the observed DKI abnormalities. Though the pathological substrate of MDD is not yet completely understood, the present results are at least partly compatible with the post-mortem studies, which highlighted changes in the prefrontal white matter in terms of decreased oligodendrocyte density and function, as well as reduction of myelin and structural abnormalities of Ranvier nodes5-6. These changes affect axon physiological activities6, lead to disruption of axon maintenance, and will eventually result in axonal atrophy7.
- We note the model comes with numerous assumptions and simplifications; just for a few examples, the number of compartments, ignoring intra-axonal radial diffusivity, compartmental exchange, and differences in relaxation time between compartments8. Validation of the basic model picture9 and seek for effective additional independent measurements8 are the current topics. With careful and critical interpretations, the present results are expected to serve for both model improvement and elucidation of the pathophysiology of MDD.
Acknowledgements
This study was partly supported by Japan Society for the Promotion of Science (JSPS) KAKENHI [Grant Number 15K09937, 16H06395, 16H06399, 16K21720, 17H04244, and Advanced Bioimaging Support [Grant Number 16H06280]], the Brain Mapping by Integrated Neurotechnologies for Disease Studies (Brain/MINDS), Integrated Research on Depression, Dementia and Development disorders by the Strategic Research Program for Brain Sciences from the Japan Agency for Medical Research and Development, AMED, UTokyo Center for Integrative Science of Human Behavior (CiSHuB), and International Research Center for NeuroIntelligence (IRCN).
References
- Chen G, Guo Y, Zhu H, et al. Intrinsic disruption of white matter microarchitecture in first-episode, drug-naive major depressive disorder: A voxel-based meta-analysis of diffusion tensor imaging. Prog Neuropsychopharmacol Biol Psychiatry. 2017;76:179-187.
- Novikov DS, Veraart J, Jelescu IO, Fieremans E. Mapping orientational and microstructural metrics of neuronal integrity with in vivo diffusion MRI. eprint arXiv:160909144. September 2016.
- Reisert M, Kellner E, Dhital B, Hennig J, Kiselev VG. Disentangling micro from mesostructure by diffusion MRI: A Bayesian approach. NeuroImage. 2017;147:964-975.
- Gong Q, He Y. Depression, Neuroimaging and Connectomics: A Selective Overview. Biol Psychiatry. 2015;77:223-235.
- Tham MW, Woon PS, Sum MY, Lee TS, Sim K. White matter abnormalities in major depression: evidence from post-mortem, neuroimaging and genetic studies. J Affect Disord. 2011;132:26-36.
- Miyata S, Taniguchi M, Koyama Y, et al. Association between chronic stress-induced structural abnormalities in Ranvier nodes and reduced oligodendrocyte activity in major depression. Sci Rep. 2016;6:23084.
- Gao Y, Ma J, Tang J, et al. White matter atrophy and myelinated fiber disruption in a rat model of depression. J Comp Neurol. 2017;525:1922-1933.
- Veraart J, Novikov DS, Fieremans E. TE dependent Diffusion Imaging (TEdDI) distinguishes between compartmental T2 relaxation times. Neuromage. 2017. doi: 10.1016/j.neuroimage.2017.09.030. [Epub ahead of print].
- Veraart J, Fieremans E, Novikov DS. Universal power-law scaling of water diffusion in human brain defines what we see with MRI. eprint arXiv:160909144. September 2016.
- Hofer S, Frahm J. Topography of the human corpus callosum revisited--Comprehensive fiber tractography using diffusion tensor magnetic resonance imaging. NeuroImage. 2006;32:989-994.
Figures
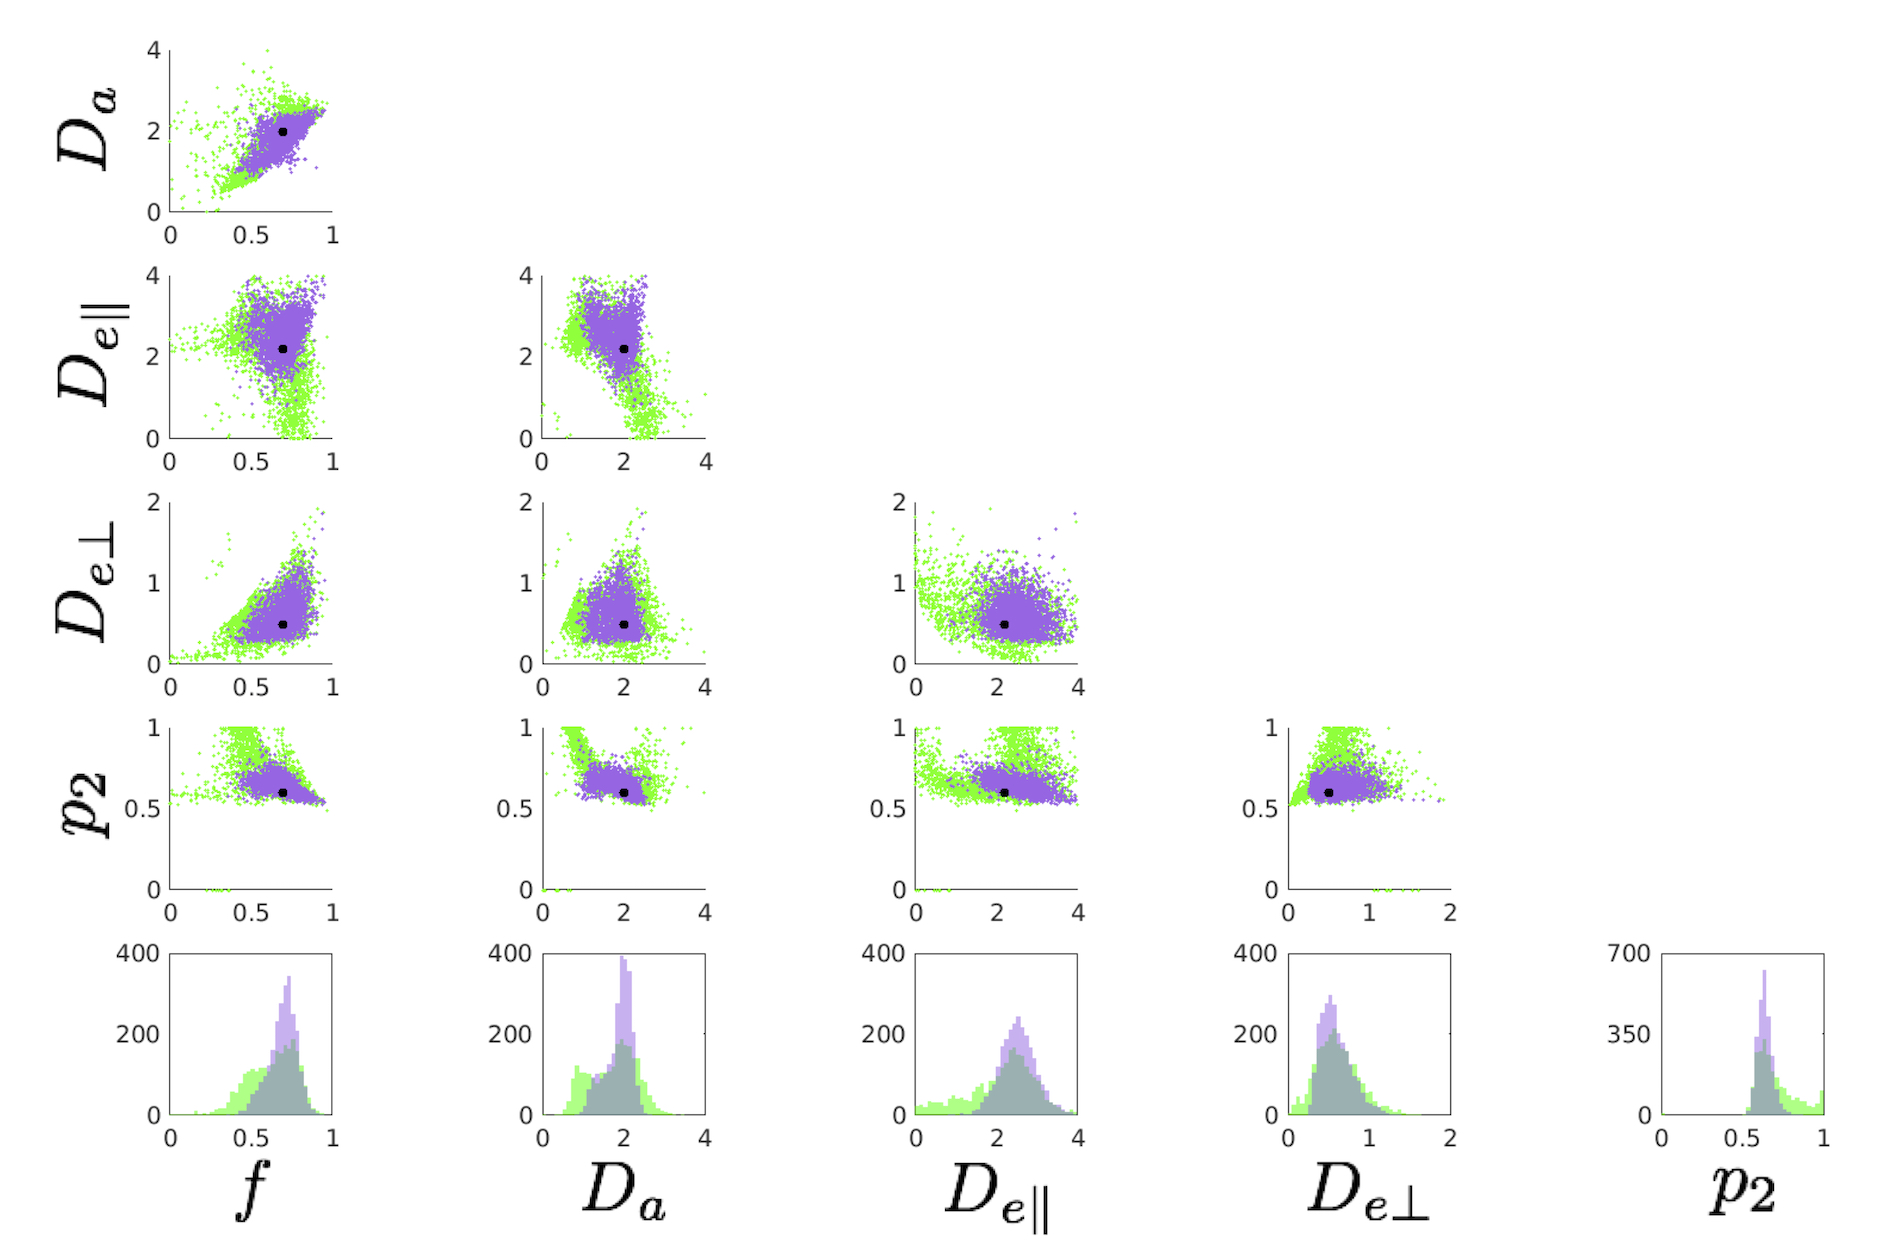
Figure 1. Single voxel simulation using 2500 noise realizations. The acquisition protocol matches to that of the human data. The underlying ground truth {f, Da, De,par, De,perp, p2} = {0.7, 2.0, 2.2, 0.5, 0.6}.The SNR is fixed to 25. Top: Scatter plots between all estimated parameters. We used 25 random initializations and adopted the most prevalent solution (purple). Outputs from single initialization are also shown (green). The black dots indicate the ground truth values. Bottom: Histograms of estimated model parameters. Increasing the number of initializations from 25 up to 200 did not largely change the accuracy.
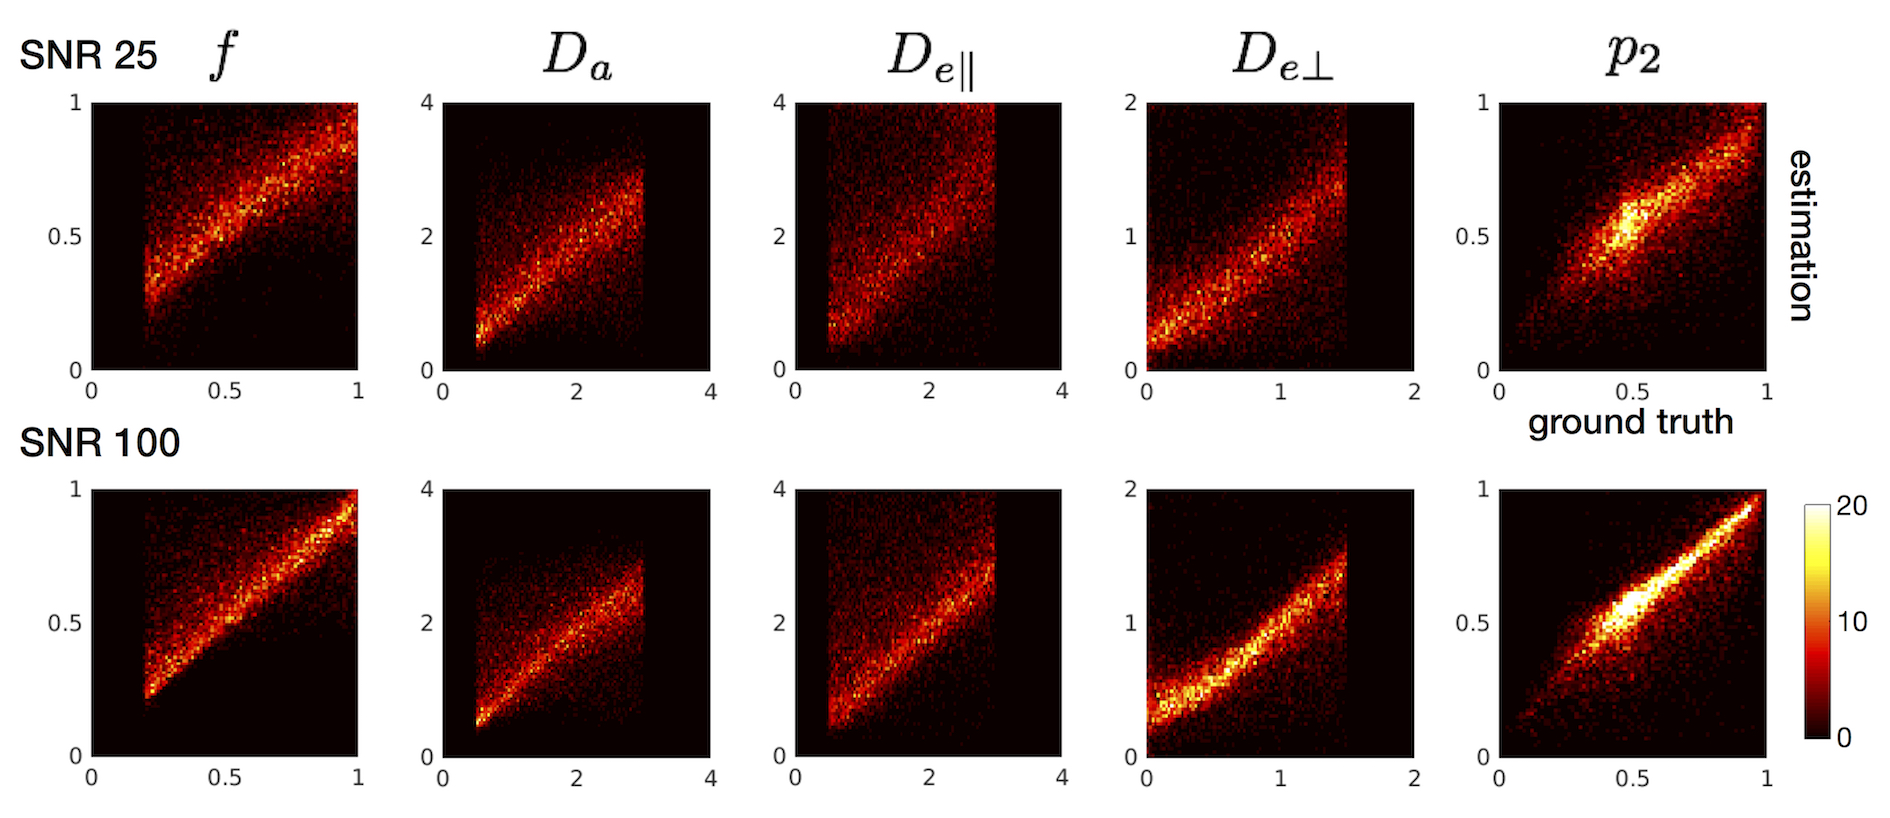
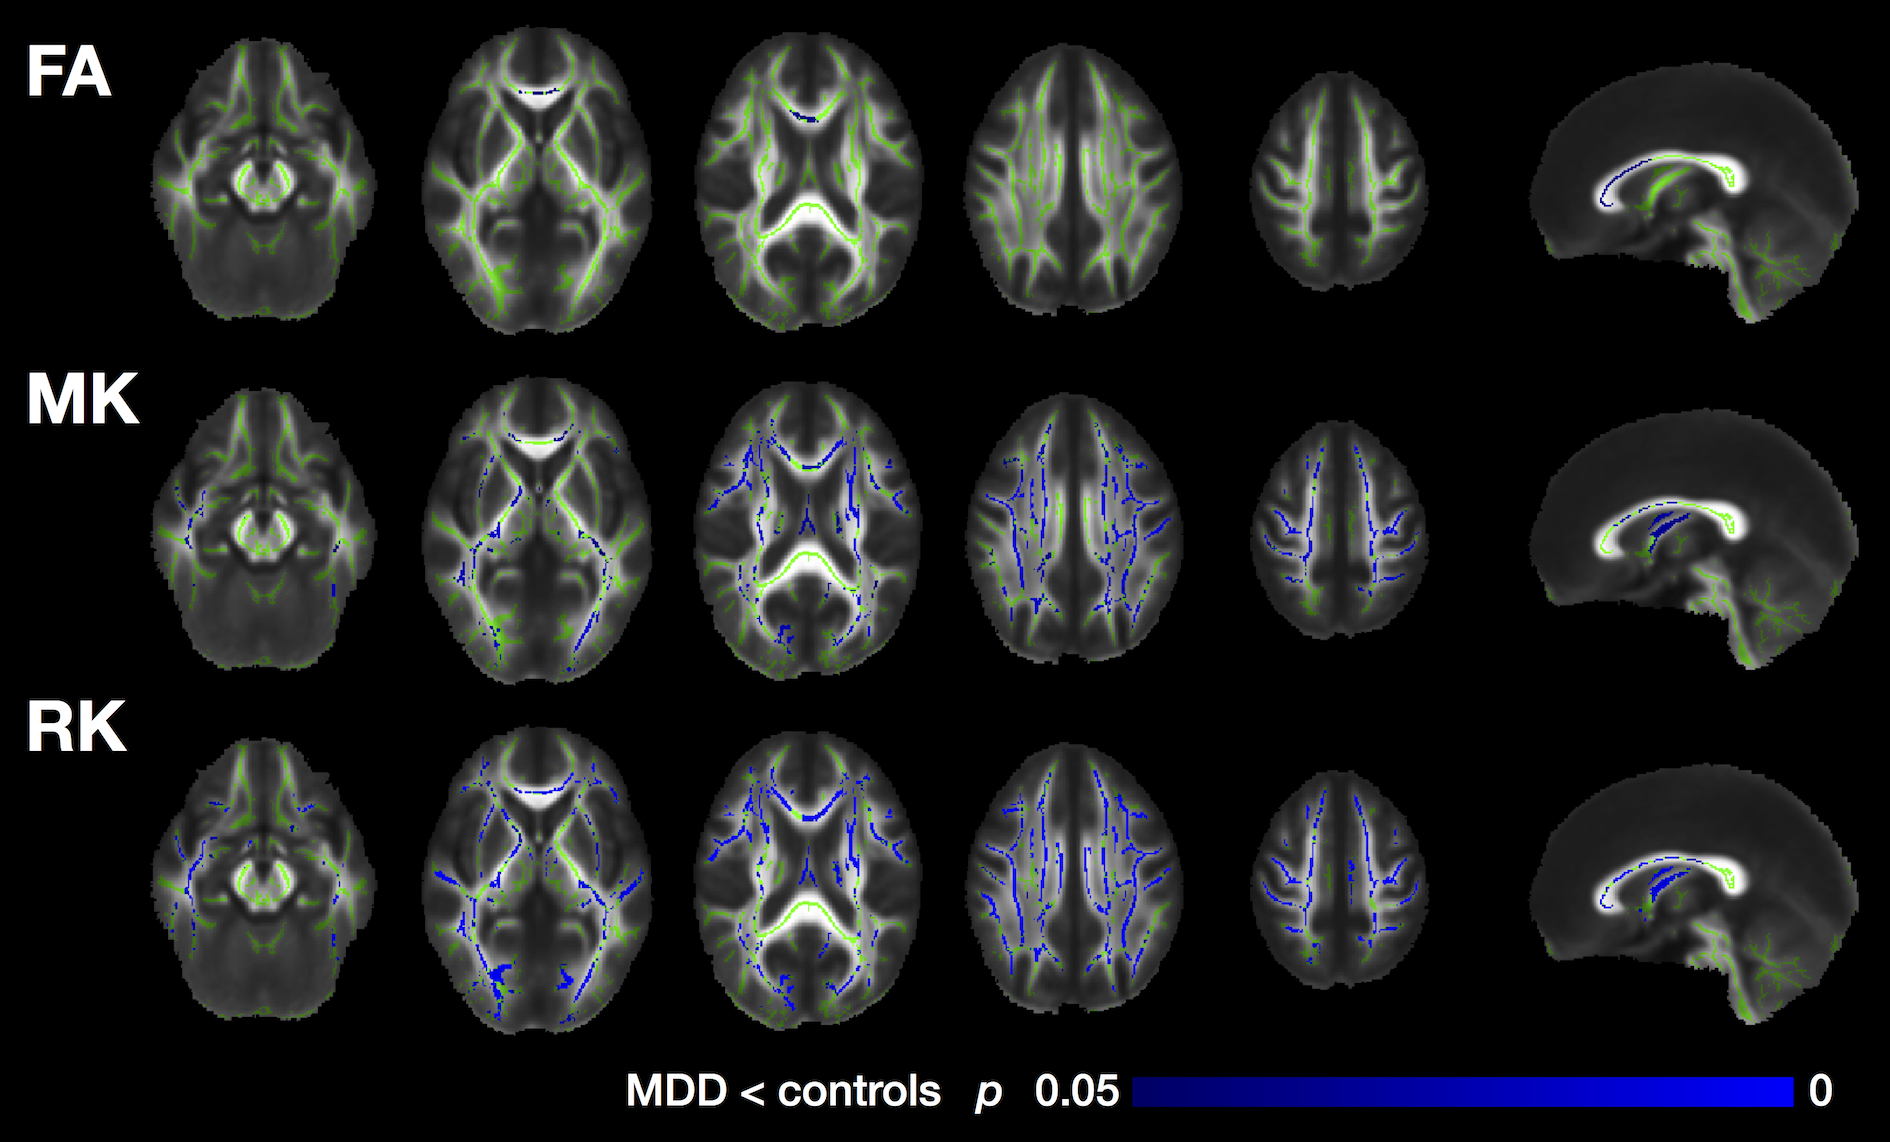
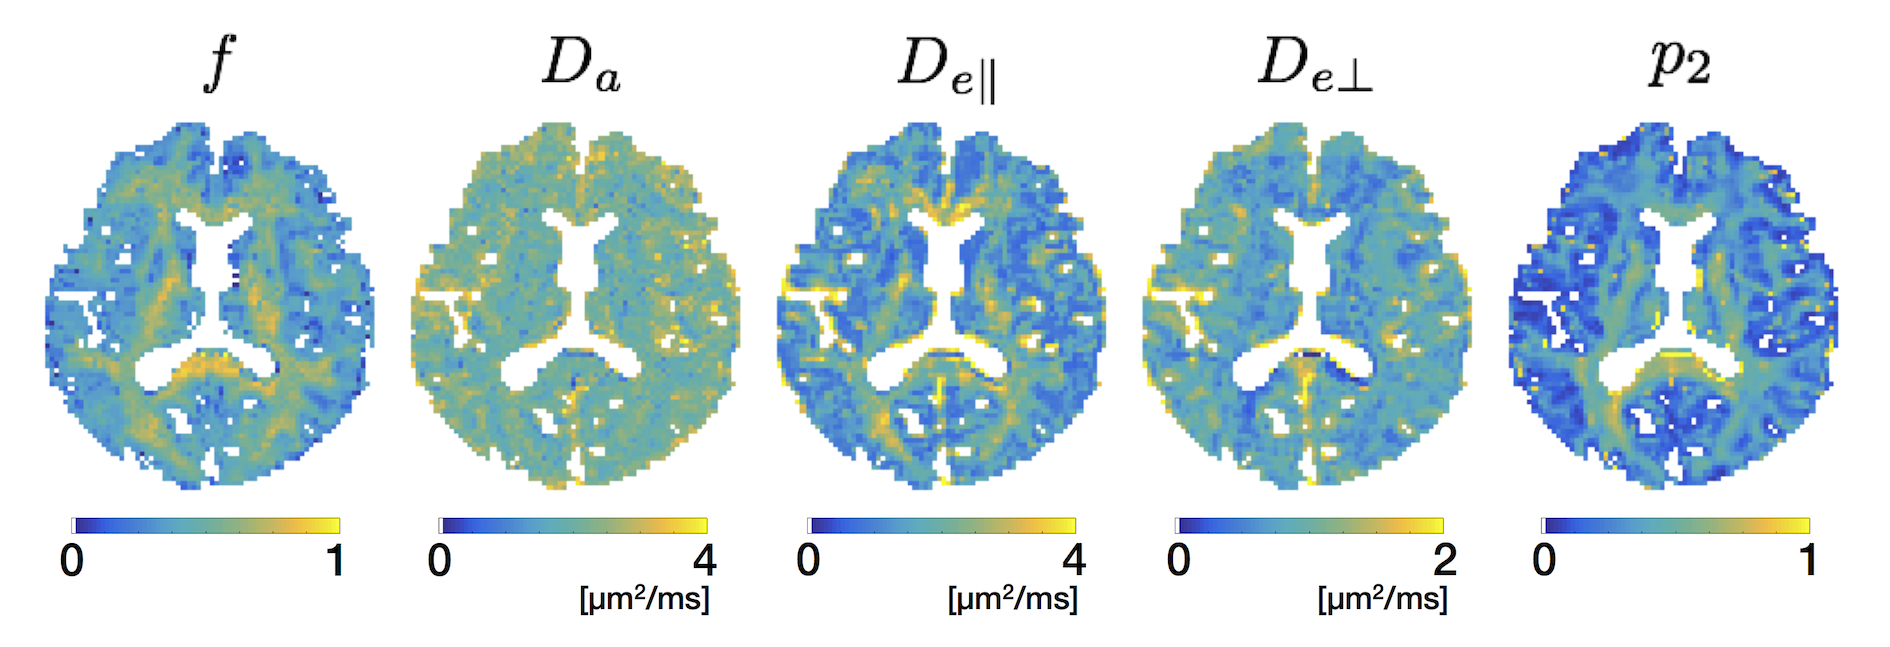
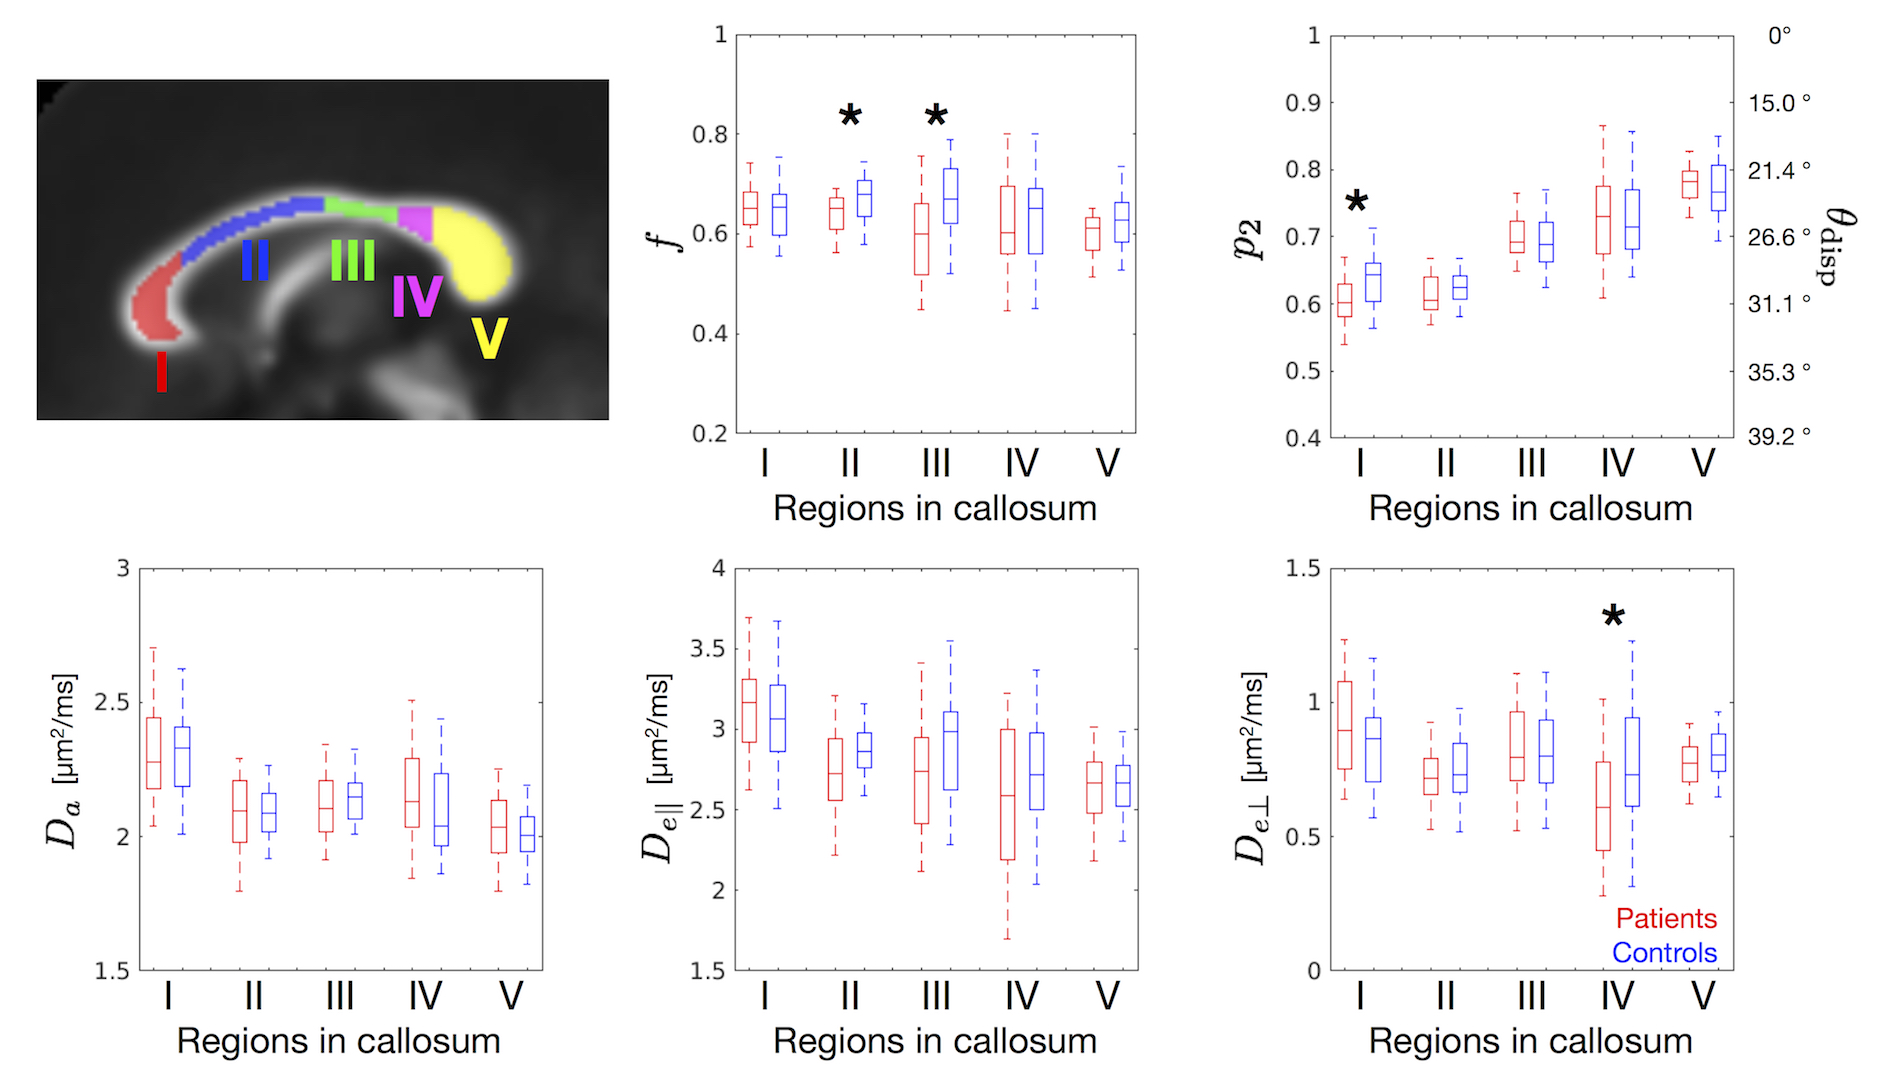
Figure 5. ROI-based analysis of the model parameters in the corpus callosum. ROIs were drawn on the mean FA template as defined by Hofer and Frahm10, and warped into the native space. To mitigate partial volume effects with CSF, FA threshold of FA ≥ 0.5 was also imposed. Box-and-whisker plots show comparison between the patients and the controls (* p < 0.05, Welch’s t-test). A representative ODF dispersion angle (θdisp) was computed2 as cos2θdisp = (2p2+1)/3.