1812
Measurements of rat hippocampus Glu, Gln and GABA using NMR, MRS and HPLC in animal models of autismPawel Senator1, Elzbieta Zieminska2, Wojciech Hilgier2, Jaroslaw Orzel2, and Beata Toczylowska1,3
1Nalecz Institute of Biocybernetics and Biomedical Engineering Polish Academy of Sciences, Warsaw, Poland, 2Mossakowski Medical Research Center Polish Academy of Sciences, Warsaw, Poland, 3Institute of Biochemistry and Biophysics Polish Academy of Sciences, Warsaw, Poland
Synopsis
The goal of our studies was to compare different measuring methods of glutamine, glutamate and GABA of rat hippocampus used for study of pathogenesis of autism. The methods under consideration were: in vivo MRS and two in vitro ones, NMR and HPLC. Univariate statistical analysis of ratios of tested amino acids with respect to glutamate concentration was performed using General Linear Model. This demonstrated statistically significant differences between the results from three methods for both, glutamine and GABA ratios. OPLS-DA analysis allowed build models for differentiation of two animal models of disease and control group in NMR and HPLC.
INTRODUCTION
An imbalance in excitatory/inhibitory neurotransmission has been implicated in the pathogenesis of autism. We tested this hypothesis by measuring changes in concentration of glutamate (Glu), glutamine (Gln) and GABA in the brain. Concentrations of tested compounds were evaluated in two rat models of pharmacologically-induced autism using Magnetic Resonance Spectroscopy (MRS), Nuclear Magnetic Resonance (NMR) and High Performance Liquid Chromatography (HPLC).MATERIALS AND METHODS
On the 11th day of gestation, female rats were orally administrated valproic acid (VPA, n=11) or thalidomide (Thal, n=13) to induce autism in their offspring. There were 10 control subjects used in the test. 30-day old pups underwent MRS studies using the 7 T system. Spectra were acquired using short echo time PRESS sequence (TR/TE=2500/20 ms, 512 averages, 2048 points, scan time=17 min.) with VAPOR water suppression, the outer volume suppression, frequency drift correction (flip angle 5°) and eddy current correction. Metabolite concentrations were estimated using the LC-Model software. The amino acids from rat hippocampi were extracted for NMR studies using the HCl-Bligh and Dyer procedure. Three-trimethylsilyl propionic acid was used as an internal reference. NMR spectra were acquired at 25ºC using 500 MHz spectrometer. For chromatographic measurements. HPLC with fluorescence detection after derivatization in a timed reaction with o-phtalaldehyde plus mercaptoethanol was used. Derivatized samples were injected into a 250x4.6mm 5μm column with a mobile phase of 50mM phosphate buffer (KH2PO4/K2HPO4) containing 10% v/v methanol at pH 6.2 and methanol.Concentrations of Glu, Gln, GABA and their ratios with respect to Glu were used for statistical analysis. Univariate statistical analysis of the ratios was performed using General Linear Model (GLM) test. P value below 0.05 was considered as statistically significant. Orthogonal Partial Least Squares Discriminant Analysis (OPLS-DA) was used to build models for differentiation between the two animal models of autism and control groups for all methods.RESULTS
Ratios of concentrations of Glu, Gln and GABA were analyzed only for the control group. Hotelling test showed significant differences for Gln/Glu and GABA/Glu ratios between all methods: MRS, NMR and HPLC (Fig.1). OPLS-DA analysis of amino acid concentrations per 1mg of protein for the three groups, the control and two animal models of autism, allowing to build models only for NMR and HPLC data. For the NMR data, models consisted of one predictive and one orthogonal component for both VPA and Thal vs. the control groups (Fig.2). For model of VPA vs. control group R2cum was at 95% and Q2cum was at 57%, while for Thal vs. control group, 80% and 77% respectively. For VPA vs. control group, 87.5% samples were classified correctly (p=0.004), while for Thal vs. control 100% (p<0.0001). Both models were validated using CV-ANOVA, p=0.04 and p=0.0001, respectively for VPA and Thal groups vs. control. For HPLC studies, the model consisted of one predictive and one orthogonal component for both VPA and Thal vs. control groups (Fig.3). For the model of VPA vs. control group, R2cum was at 96% and Q2cum was at 58%, while for Thal vs. control, 92% and 75% respectively. For VPA vs. control group 88.9% samples were classified correctly (p=0.001), while for Thal vs. control 100% (p<0.0001). Both models were validated using CV-ANOVA, p=0.02 and p=0.0001, respectively for VPA and Thal groups vs. control.DISCUSSION
The differences between two in vitro methods could have resulted from measuring errors, which were assumed to be at 10% and 5% for NMR and HPLC, respectively. NMR measured concentration of free forms of amino acids, while HPLC measured their derivatives. The size of voxel used for MRS was large enough to measure the spectra. The measuring error could be 20-25% because spectra also included signals from CSF and blood. We expected similar results for the ratios of amino acids in all methods but due to measuring errors and limitation of each method they were not.CONCLUSION
In vitro and in vivo methods could not be compared directly because of different measurement units and because we used post mortem extraction procedure of the tissue for the in vitro studies and live ones for the in vivo. OPLS-DA analysis of amino acid concentrations allowed to build a model to differentiate control and diseased groups in the in vitro studies.Acknowledgements
This study was supported by the Polish National Science Centre, grant no. 2014/15/B/NZ4/04490References
No reference found.Figures
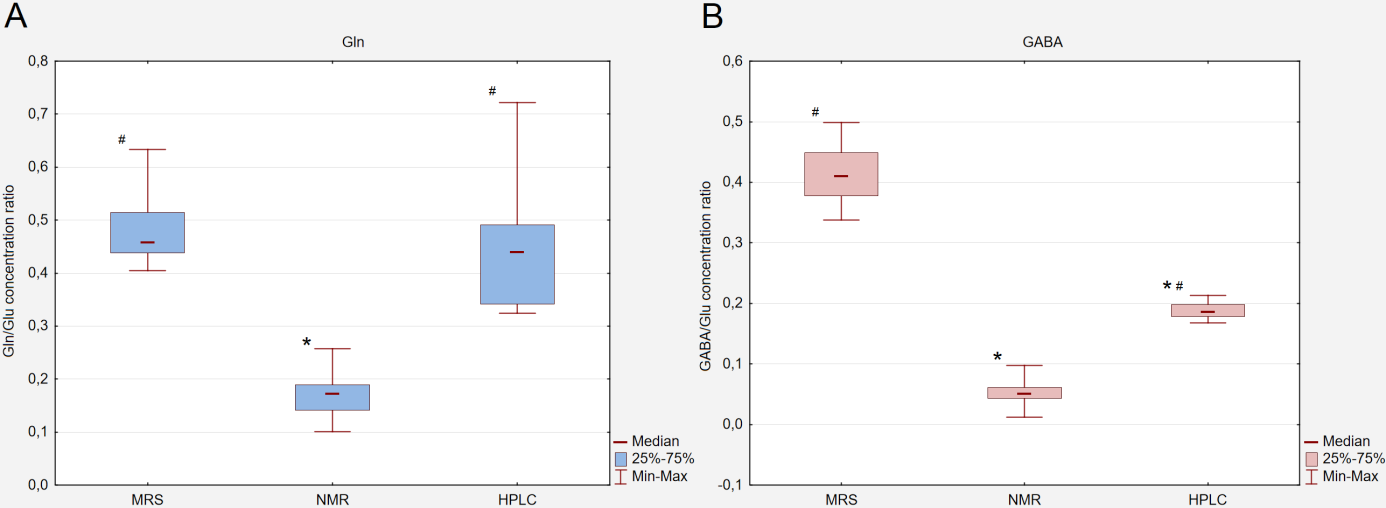
Fig.1 The Box and Whisker plots of Gln/Glu (A) and GABA/Glu (B) ratios calculated for each method used for control group. Results are statistically significant (Hotelling test): * p<0.05 HPLC, NMR vs. MRS method; # p<0.05 MRS, HPLC vs. NMR method.
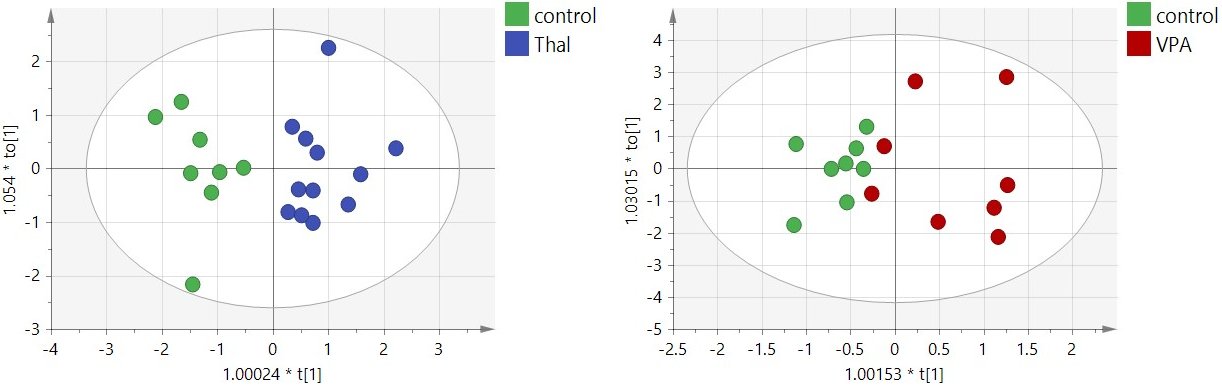
Fig.2 The scores plots of the two-component OPLS-DA model for NMR data; to[1] represents within class variation in the first orthogonal component, whereas t[1] represents between class variation in the first predictive component. Ellipse represents Hotelling T2 with 95% confidence in score plots.
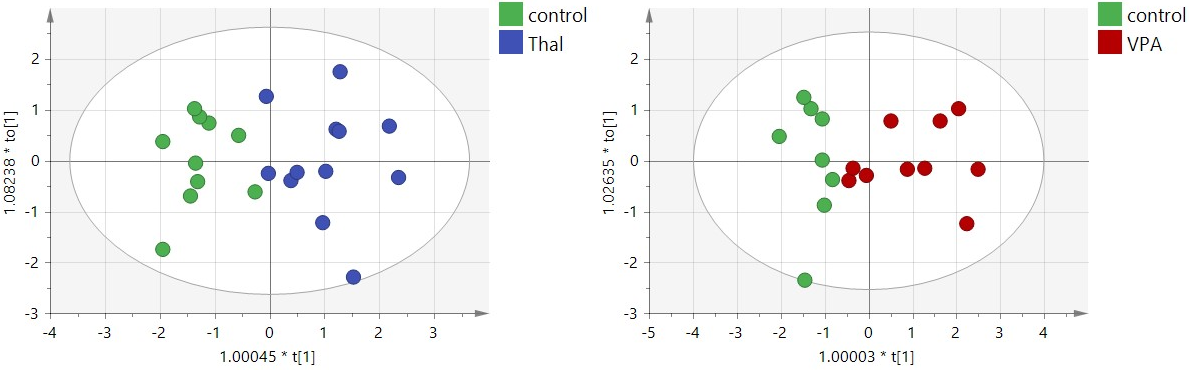
Fig.3 The scores plots of the two-component OPLS-DA model for HPLC data; to[1] represents within class variation in the first orthogonal component, whereas t[1] represents between class variation in the first predictive component. Ellipse represents Hotelling T2 with 95% confidence in score plots.