1811
Connectome analysis of brain functional network alterations in depressed patients with and without self-harm1Department of Medical Imaging and Radiological Sciences, Chung Shan Medical University, Taichung, Taiwan, 2School of Medicine, Chang Gung University, Taoyuan, Taiwan, 3Department of Psychiatry/ Health Information and Epidemiology Laboratory, Chang Gung Memorial Hospital, Chiayi, Taiwan, 4Department of Diagnostic Radiology, Chang Gung Memorial Hospital, Chiayi, Taiwan, 5Department of Medical Imaging and Radiological Sciences, Chang Gung University, Taoyuan, Taiwan
Synopsis
We aimed to use resting-state fMRI (rs-fMRI) to investigate the functional connectivity difference between depressed patients with and without self-harm history as well as healthy participants. The graph theoretical analysis (GTA) and network-based statistic (NBS) analysis were also used to find the network difference between each group. In GTA and NBS analyses revealed different topological organization and poor global integration of the brain network in depressed participants compared with healthy participants. We suggested that depressed patients with or without self-harm history may affect their brain functional connectivity.
Introduction
According to Ministry of Health and Welfare of Taiwan, the complete suicide ranked 12th in the cause of death. The reason for suicide included emotional/interpersonal relationships, mental health, substance abuse, work, and physical diseases. A large number of studies investigated the functional connectivity in major depressive disorder using functional magnetic resonance imaging (fMRI), however, few of them discussed the difference between depressed patients with and without self-harm history 1. Therefore, we aimed to use resting-state fMRI (rs-fMRI) to investigate the functional connectivity difference between depressed patients with and without self-harm history as well as healthy participants. The graph theoretical analysis (GTA) and network-based statistic (NBS) analysis were also used to find the network difference between each group.Methods
In the study, 107 participants were divided into three groups, 46 healthy subjects (HC), 33 depressed patients with self-harm history (SH), and 28 depressed patients without self-harm history (NS). All participants were scanned using 3T MRI (Verio, Siemens, Germany) imaging system with echo planar image (EPI) sequence to obtain resting-state functional images. The parameters of images were: TR/TE = 2000/30 ms, in-plane resolution (pixel size) = 3.4 x 3.4 mm2, thickness =4 mm, number of repetition = 300, and 31 axial slices aligned along AC-PC lines. All subjects were asked to be relaxation, closing their eyes, and thinking of nothing but could not fall asleep.
In data analysis, Statistical Parametric Mapping (SPM) was used to perform pre-processing for images, including slice-timing, realignment, normalization, and smoothness. The functional connectivity analysis was performed after removing physiological noises. Then ROI correlation was used to calculate the activation on the opposite side of seed between each group. The GTA was used to calculate the topological parameters of the brain network, including clustering coefficient (C), normalized clustering coefficient (γ), local efficiency (Elocal), characteristic path length (L), normalized characteristic path length (λ), global Efficiency (Eglobal), smal-worldness (σ), modularity, assortativity, and transitivity. The NBS analysis was then applied to find the difference of cerebrum functional connectivity between each group.
Results
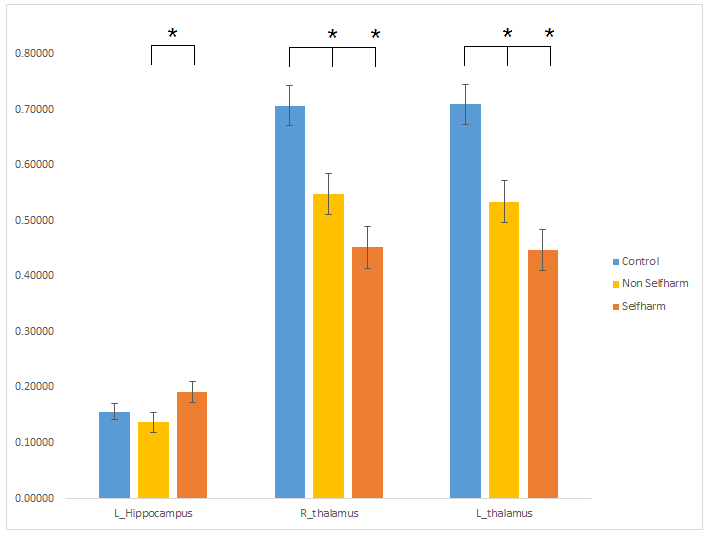
In functional connectivity analysis (Fig. 1), ROI correlation was used to calculate the activation on the opposite side of the seed. The results showed that higher functional connectivity of left hippocampus in SH compared with NS. Higher functional connectivity of bilateral thalamus in HC compared with SH and NS (p-value < 0.05).
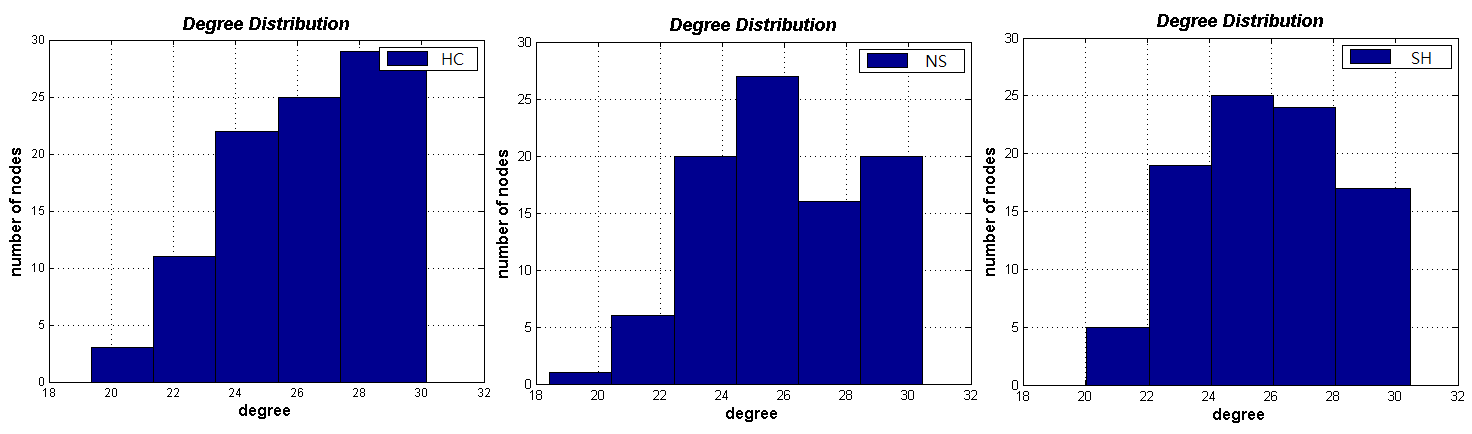
In the GTA, lower degree in the high regime of degree distribution was observed in each group of depressed participants compared with HC (Fig. 2). In the topological parameter, we found higher assortativity, transitivity, but lower Eglobal in HC compared with NS. And found higher transitivity in HC compared with SH (Fig. 3, p-value < 0.05).
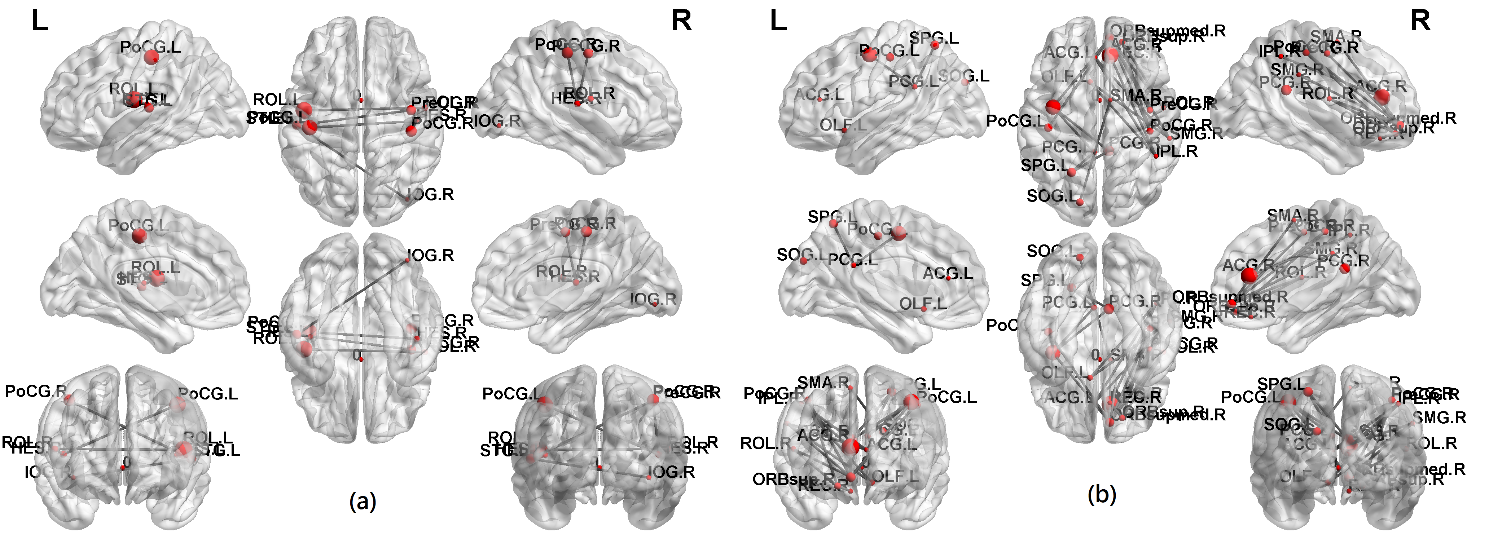
In NBS analysis, we compared the edges of the brain networks between each group. More edges were found in the HC compared with SH (Fig. 4a, p-value < 0.05). The edges included the bilateral connections between rolandic operculum, heschl, precentral, postcentral, superior temporal and inferior occipital gyrus. More edges were also found in the NS compared with SH (Fig. 4b, p-value < 0.05). The edges included the connections between superior orbital frontal gyrus, rolandic operculum, rectus, inferior operculum frontal gyrus, supplementary motor area, precentral, medial orbital frontal gyrus, posterior cingulate gyrus, superior occipital gyrus, postcentral, superior parietal gyrus, orbital frontal gyrus, olfactory cortex, anterior cingulate gyrus, inferior parietal gyrus, and supramarginal gyrus.
Discussion
In functional connectivity analysis, the previous study showed that the decrease of hippocampal volume in major depressive disorders compared with heathy participants 2. The previous study also mentioned that lower regional homogeneity of left thalamus in major depression patients compared with HC 3, which was consistent with our results. In the GTA, transitivity is a classic type of clustering coefficient. Higher clustering coefficient indicated subjects have better segmentation in brain function. The previous study concluded that depressed participants decreased local connectivity compared with healthy subjects 4. In NBS analysis, the previous study showed that more edges were found in healthy participants compared with major depressive disorder participants in DTI analysis 5, which was consistent with our results.Conclusion
GTA and NBS analyses revealed different topological organization and poor global integration of the brain network in depressed participants compared with healthy participants. We suggested that depressed patients with or without self-harm history may affect their brain functional connectivity.Acknowledgements
This study was supported by the research programs MOST106-2314-B-182-040-MY3 and MOST105-2314-B-182-028, which were sponsored by the Ministry of Science and Technology, Taipei, Taiwan. This work was also supported by the research program CLRPG6G0041, which was sponsored by the Health Information and Epidemiology Laboratory, Chang Gung Memorial Hospital, Chiayi, Taiwan.References
1. Brakowski J, Spinelli S, Dörig N, et al. Resting state brain network function in major depression-Depression symptomatology, antidepressant treatment effects, future research. Journal of Psychiatric Research. 2017;92:147-159.
2. Lorenzetti V, Allen NB, Fornito A, et al. Structural brain abnormalities in major depressive disorder: A selective review of recent MRI studies. Journal of Affective Disorders. 2009;117:1-17.
3. Peng DH, Jiang KD, Fang YR, et al. Decreased regional homogeneity in major depression as revealed by resting-state functional magnetic resonance imaging. Chinese Medical Journal. 2011;124:369-373.
4. Singh MK, Kesler SR, Hadi Hosseini SM, et al. Anomalous Gray Matter Structural Networks in Major Depressive Disorder. Biological Psychiatry. 2013;74:777–785.
5. Korgaonkar MS, Fornito A, Williams LM, et al. Abnormal Structural Networks Characterize Major Depressive Disorder: A Connectome Analysis. Biological Psychiatry. 2014;76:567–574.
Figures