1804
Quantitative magnetization transfer imaging in schizophrenia: a closer look at myelin dysfunction1Bernard and Irene Schwartz Center for Biomedical Imaging, Department of Radiology, New York University School of Medicine, New York, NY, United States, 2Department of Rehabilitation Medicine, New York University School of Medicine, New York, NY, United States, 3Department of Psychiatry, New York University School of Medicine, New York, NY, United States, 4Department of Radiology, University of Wisconsin at Madison, Madison, WI, United States
Synopsis
Myelin dysfunction has frequently been identified as one of the neural abnormalities in schizophrenia, yet systematic in vivo examination of myelin content in patients is lacking. The current study compared the degree of myelination in schizophrenia patients and comparison healthy controls. Myelin content was estimated by constructing quantitative whole-brain maps of macromolecular proton fraction, which is believed to be one of the biomarkers for myelination in neural tissues. Statistical analysis revealed that SZ patients were associated with a significant reduction in myelin content throughout white matter, as well as in several grey matter regions including cingulate cortex and hippocampus.
Introduction
In recent years, alterations in brain circuits and abnormalities in brain maturation such as myelin dysfunction have been often indicated in schizophrenia research [1]. However, most of the myelin-related hypotheses are largely based on results from animal models and histological studies, while reliable in vivo approaches for myelin measurement are still being tested. The current study employed a quantitative magnetization transfer mapping technique (qMT) [2,3,4] to estimate myelin content in both healthy controls and patients on the schizophrenia disorder spectrum (SZ), which included schizophrenia and schizoaffective disorder diagnoses.Methods
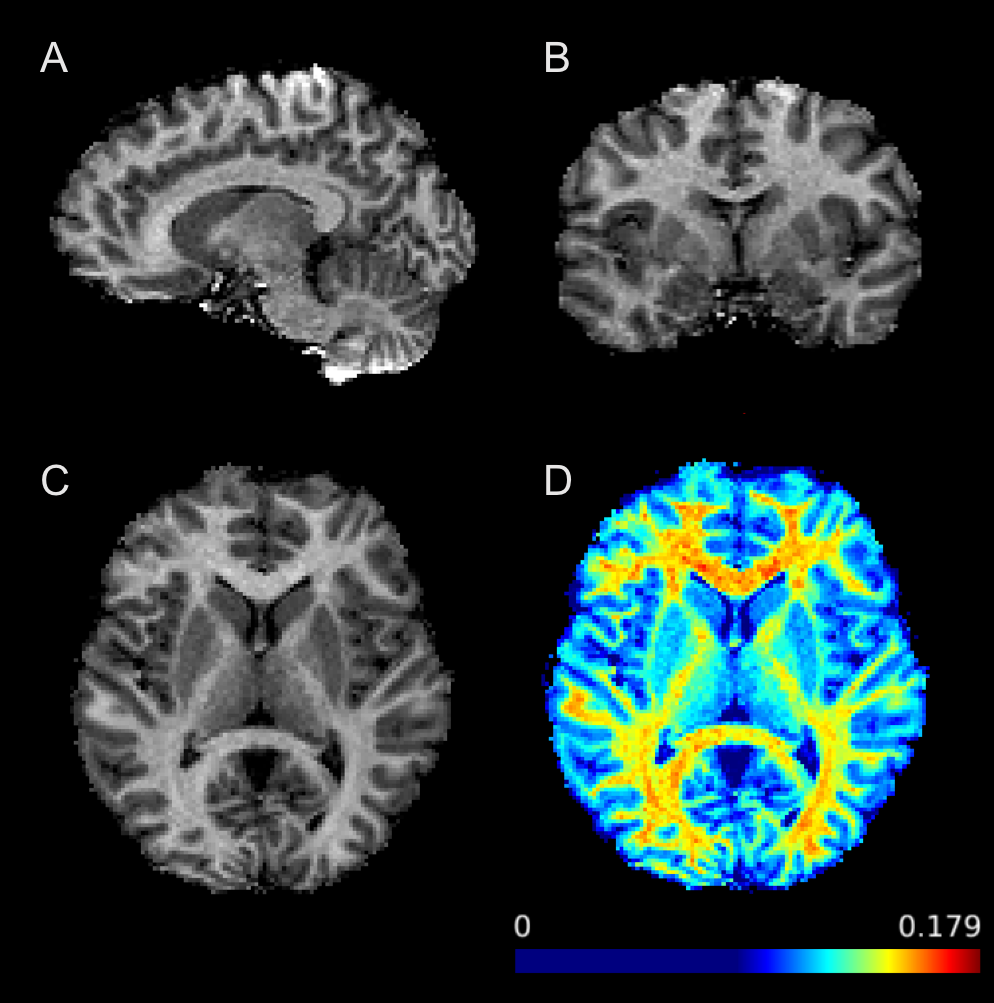
Fifteen healthy controls and nine age-matched SZ patients participated in the study. Patients’ diagnosis of a schizophrenia spectrum disorder and the lack of an Axis I diagnosis in controls was confirmed using the Diagnostic Interview for Genetic Studies. All participants were scanned on Siemens Prisma 3T scanner using a three-dimensional gradient echo MT-weighted sequence with a voxel size of 1.5x1.5x1.5mm and approximately full brain coverage. One MT-weighted (TR = 29 ms; FA = 10°) and two variable flip angle datasets (TR = 21ms; FA = 4° and 25°) were collected. Off resonance saturation was achieved by applying a Gaussian pulse with effective saturation FA = 560°, pulse duration = 12.288 ms, and offset frequency = 4 kHz. The total imaging time was around nine minutes. The images were used to calculate macromolecular proton fraction (MPF) as previously described [4]. A high-resolution T1-weighted MPRAGE image was also obtained for each participant to perform brain segmentation using FreeSurfer. Mean MPF data from regions previously indicated to be involved in schizophrenia [5] were extracted according to the Destrieux Atlas provided by the FreeSurfer, which include both white and grey matter regions such as the corpus callosum, cingulate cortex, dorsolateral prefrontal cortex (dlPFC), thalamus, and hippocampus. FSL, Matlab, and SPSS were used for ROI data analysis. Between-group comparisons were performed for demographic characteristics and MPF values.Results
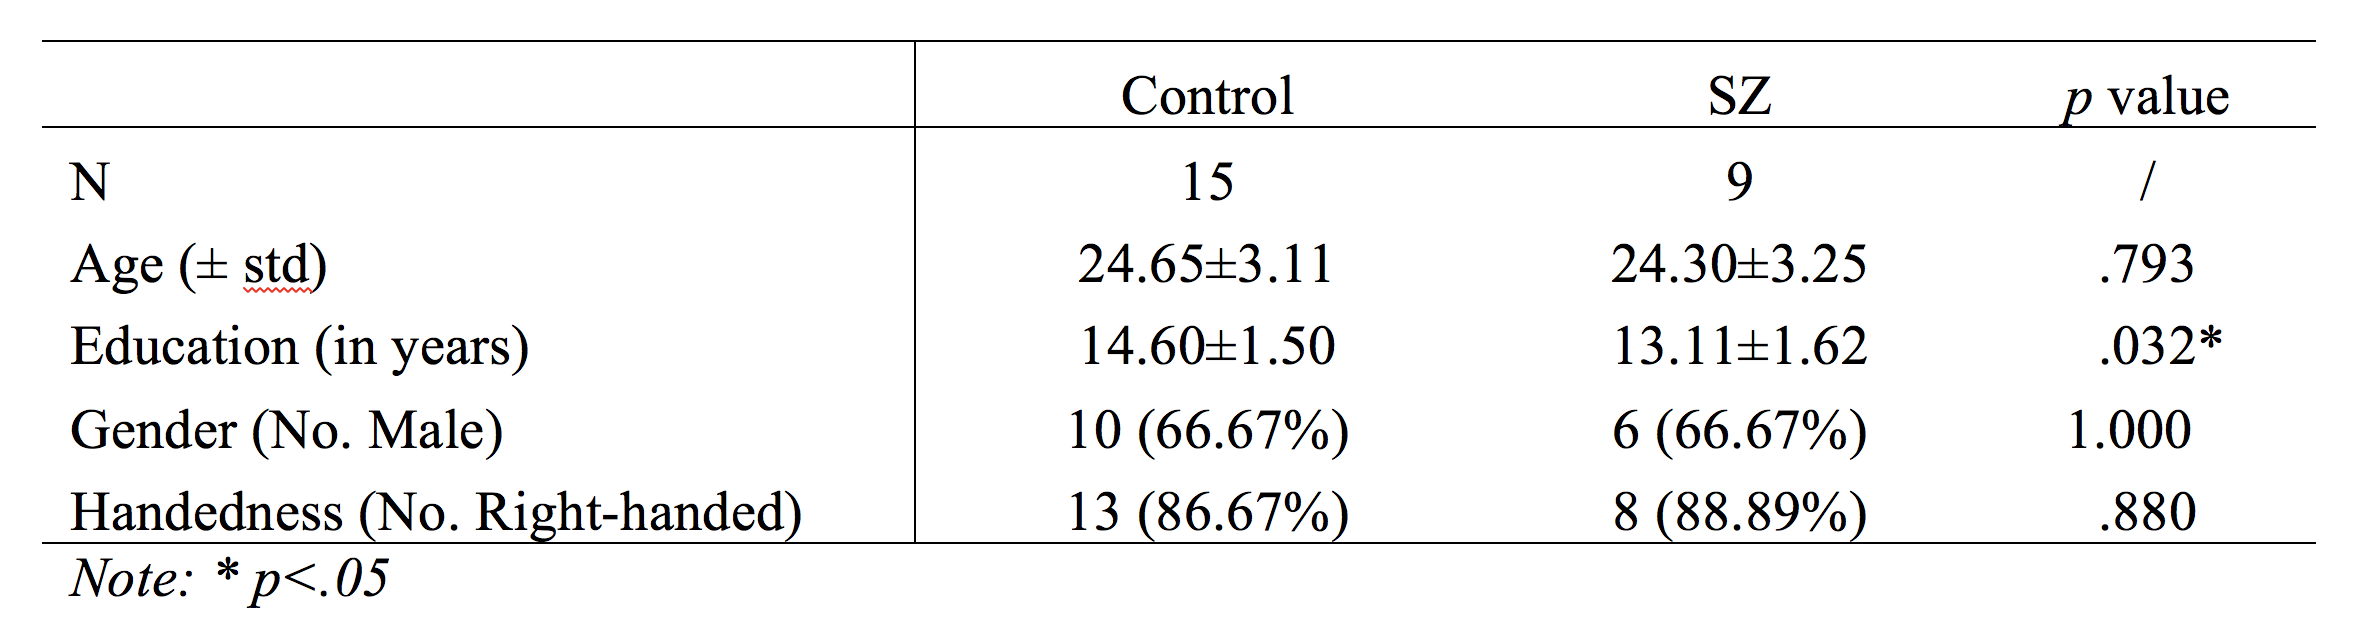
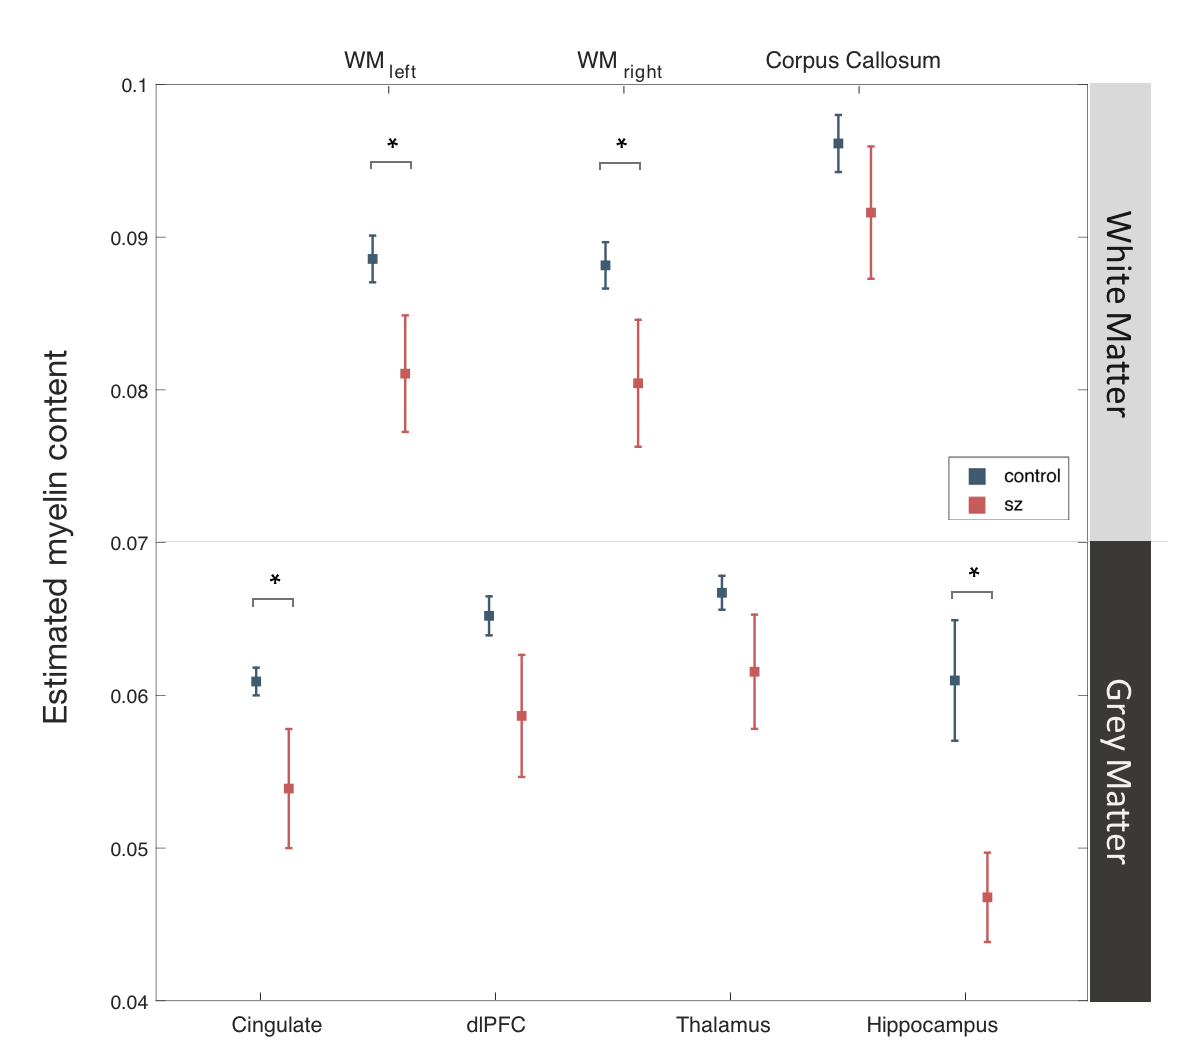
No significant group difference was found for demographic features including subjects’ age, gender, and handedness (Table 1), except for years of education where SZ group had a slightly lower average compared to healthy controls. For MPF data, myelin content estimation was predominantly higher in white matter compared to grey matter across subject groups (Figure 2). More importantly, SZ group showed significantly decreased myelin content as estimated by MPF values in cingulate cortex (p=.039), hippocampus (p=.019), and overall cerebral white matter (p=.041) (Figure 2).Discussion
The current study suggest that SZ is associated with a pervasive reduction in myelin content throughout white matter, which might interfere with local neuronal signaling and ultimately disrupt neural communication. This loss of myelin was also found in cingulate cortex and hippocampus – grey matter structures that are critical in higher-order cognitive functions including emotion and memory. These results may provide valuable insight into the specific white and grey matter deficits related to SZ, and shed light on the developmental trajectory of the disorder given the distinct time course of myelin maturation. Furthermore, it is also worth noting that although dysmyelination in schizophrenia has been often suggested by diffusion imaging studies [1], diffusion imaging in itself only offers an indirect assessment of myelination that cannot distinguish among dysmyelination, axonal loss, or combined pathologies [6]. Previous studies have also employed magnetization transfer ratio (MTR), a semi-quantitative approach, to estimate myelination with mixed results [7,8], likely due to the lack of specificity of MTR to myelin and its dependence on various additional parameters including tissue T1 and B1 excitation field. Here we used a more direct approach of myelin estimation using a novel, quantitative, fast processing method [4] based on single point MPF mapping methodology [2]. Although MPF measurements may be affected by other factors, such as inflammation [9], the magnitude of observed between group differences here suggest that these differences are likely to be largely reflective of changes in myelin content. Future work is needed to integrate qMT and diffusion imaging, and further discriminate between myelin deficits from dysmyelination or axonal loss.Conclusion
The current study employed a direct, quantitative approach of in vivo myelin estimation, supporting that white and gray matter abnormalities in SZ are likely due, at least in part, to myelin deficits. This improved accuracy in characterizing myelin loss in patients may potentially encourage more refined categorization of schizophrenia patients, which may lead to more specific therapeutic approaches for the disorder.Acknowledgements
This study was funded by National Institute of Mental HealthReferences
1. Uranova, N. A., Vostrikov, V. M., Orlovskaya, D. D., & Rachmanova, V. I. (2004). Oligodendroglial density in the prefrontal cortex in schizophrenia and mood disorders: a study from the Stanley Neuropathology Consortium. Schizophrenia research, 67(2), 269-275.
2. Yarnykh, V. L. (2012). Fast macromolecular proton fraction mapping from a single off‐resonance magnetization transfer measurement. Magnetic resonance in medicine, 68(1), 166-178.
3. Mossahebi, P., Yarnykh, V. L., & Samsonov, A. (2014). Analysis and correction of biases in cross‐relaxation MRI due to biexponential longitudinal relaxation. Magnetic resonance in medicine, 71(2), 830-838.
4. Samsonov, A. A., Mossahebi, P., Anderson, A., Velikina, J. V., Johnson, K. M., Johnson, S. C., Fleming, J. O., & Field, A. S. (2014). High Resolution, Motion Corrected Mapping of Macromolecular Proton Fraction (MPF). Clinically Acceptable Time Using 3D Undersampled Radials. In Proc of ISMRM (p. 3337).
5. Takahashi, N., Sakurai, T., Davis, K. L., & Buxbaum, J. D. (2011). Linking oligodendrocyte and myelin dysfunction to neurocircuitry abnormalities in schizophrenia. Progress in Neurobiology, 93(1), 13–24. http://doi.org/10.1016/j.pneurobio.2010.09.004
6. Kubicki, M., McCarley, R., Westin, C. F., Park, H. J., Maier, S., Kikinis, R., ... & Shenton, M. E. (2007). A review of diffusion tensor imaging studies in schizophrenia. Journal of psychiatric research, 41(1), 15-30.
7. De Weijer, A. D., Mandl, R. C. W., Diederen, K. M. J., Neggers, S. F. W., Kahn, R. S., Pol, H. H., & Sommer, I. E. C. (2011). Microstructural alterations of the arcuate fasciculus in schizophrenia patients with frequent auditory verbal hallucinations. Schizophrenia research, 130(1), 68-77.
8. Palaniyappan, L., Al-Radaideh, A., Mougin, O., Gowland, P., & Liddle, P. F. (2013). Combined white matter imaging suggests myelination defects in visual processing regions in schizophrenia. Neuropsychopharmacology, 38(9), 1808-1815.
9. Harrison, N. A., Cooper, E., Dowell, N. G., Keramida, G., Voon, V., Critchley, H. D., & Cercignani, M. (2015). Quantitative magnetization transfer imaging as a biomarker for effects of systemic inflammation on the brain. Biological psychiatry, 78(1), 49-57.
Figures