1803
Morphological interrelationships in mid-line white-matter structures are altered in individuals carrying rare neuropsychiatric copy number variants.1CUBRIC, Cardiff University, Cardiff, United Kingdom, 2Neuroscience and Mental Health Research Institute, Cardiff University, Cardiff, United Kingdom
Synopsis
Neuropsychiatric copy number variants (CNVs) provide unique insights into the genetic basis of neuropsychiatric disorders. This study utilised a novel approach for characterising morphology of white-matter fibres and combines them with more traditional volumetric and microstructural indices of white-matter to study their relation to penetrance for psychopathology in a CNV cohort. Results show cingulum morphology is significantly affected by the presence of CNVs with high-penetrance for schizophrenia and developmental disorders. Additionally, volumetric interrelationships across several white-matter structures are also altered. In particular, the ratios of tract volumes across segments of the corpus callosum are altered. It is likely that both these effects stem from a single neurodevelopmental trajectory characteristic of neuropsychiatric CNVs.
Introduction
Rare copy number variants (CNVs) with high penetrance for psychopathology provide unique insights into understanding the genetic aetiology of these disorders [1]. Morphology of white matter pathways has previously been shown to be affected in mental illness [2] but not in relation to genetic vulnerability. Here we characterise the morphological and microstructural properties of white-matter fibres in carriers of CNVs which confer high penetrance for schizophrenia and developmental disorders and identify principal components of these features that are associated with high penetrance scores.Methods
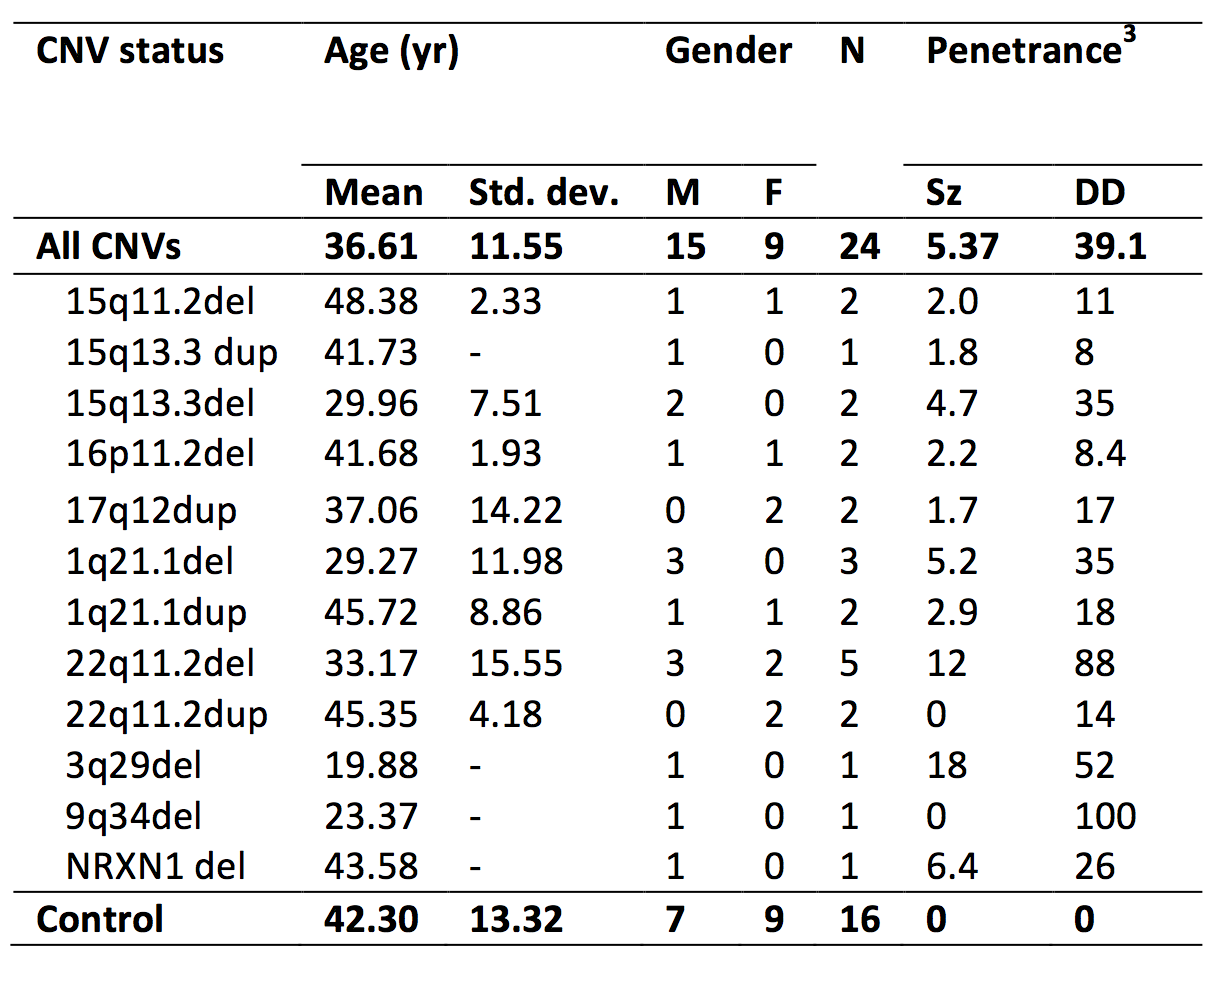
A selection of CNVs were targeted for their high penetrance for schizophrenia (PSz) and developmental disorders (PDD) [3]. 22 CNV patients (table 1) and 15 non-CNV controls (CNV/control status confirmed via post-hoc CNV calling) were scanned in a 3T GE HDx system with an EPI HARDI acquisition: TE=106ms, 60 gradient orientations, 6 b=0smm-2 images, 60 b=2000 smm-2, FOV=96×96mm, 60 slices, voxel-size=1.6×1.6×2.4mm. Data were corrected for motion, eddy current distortions and field inhomogeneities in ExploreDTI [4]. Whole-brain tractography was performed with the damped Lucy-Richardson algorithm [5] with RESDORE correction [6] (3×3×3mm grid of seed points in white matter, 0.5mm step size, 45° threshold). Streamlines were automatically segmented into 17 main fibre populations: Shape analysis was performed using principal components analysis (PCA) applied to the spline points of the segmented streamlines to identify mutually orthogonal descriptors that explain the most variance in shape [2]. Descriptors explaining >95% of variance in each model were retained, yielding a total of 194 descriptors across the 17 models. Various other microstructural and macrostructural metrics of WM and GM were derived using DTI, NODDI [7] and Freesurfer. All macro- and micro-structural measurement across the 17 fibre populations were analysed with PCA to derive principle components (PCs) across all measurements. Effects of PSz and PDD on each measurement and PC was assessed using a general linear model, controlling for effects of age, gender and intra-scan head motion. Multiple comparisons were corrected for with permutation tests (5000 iterations).Results
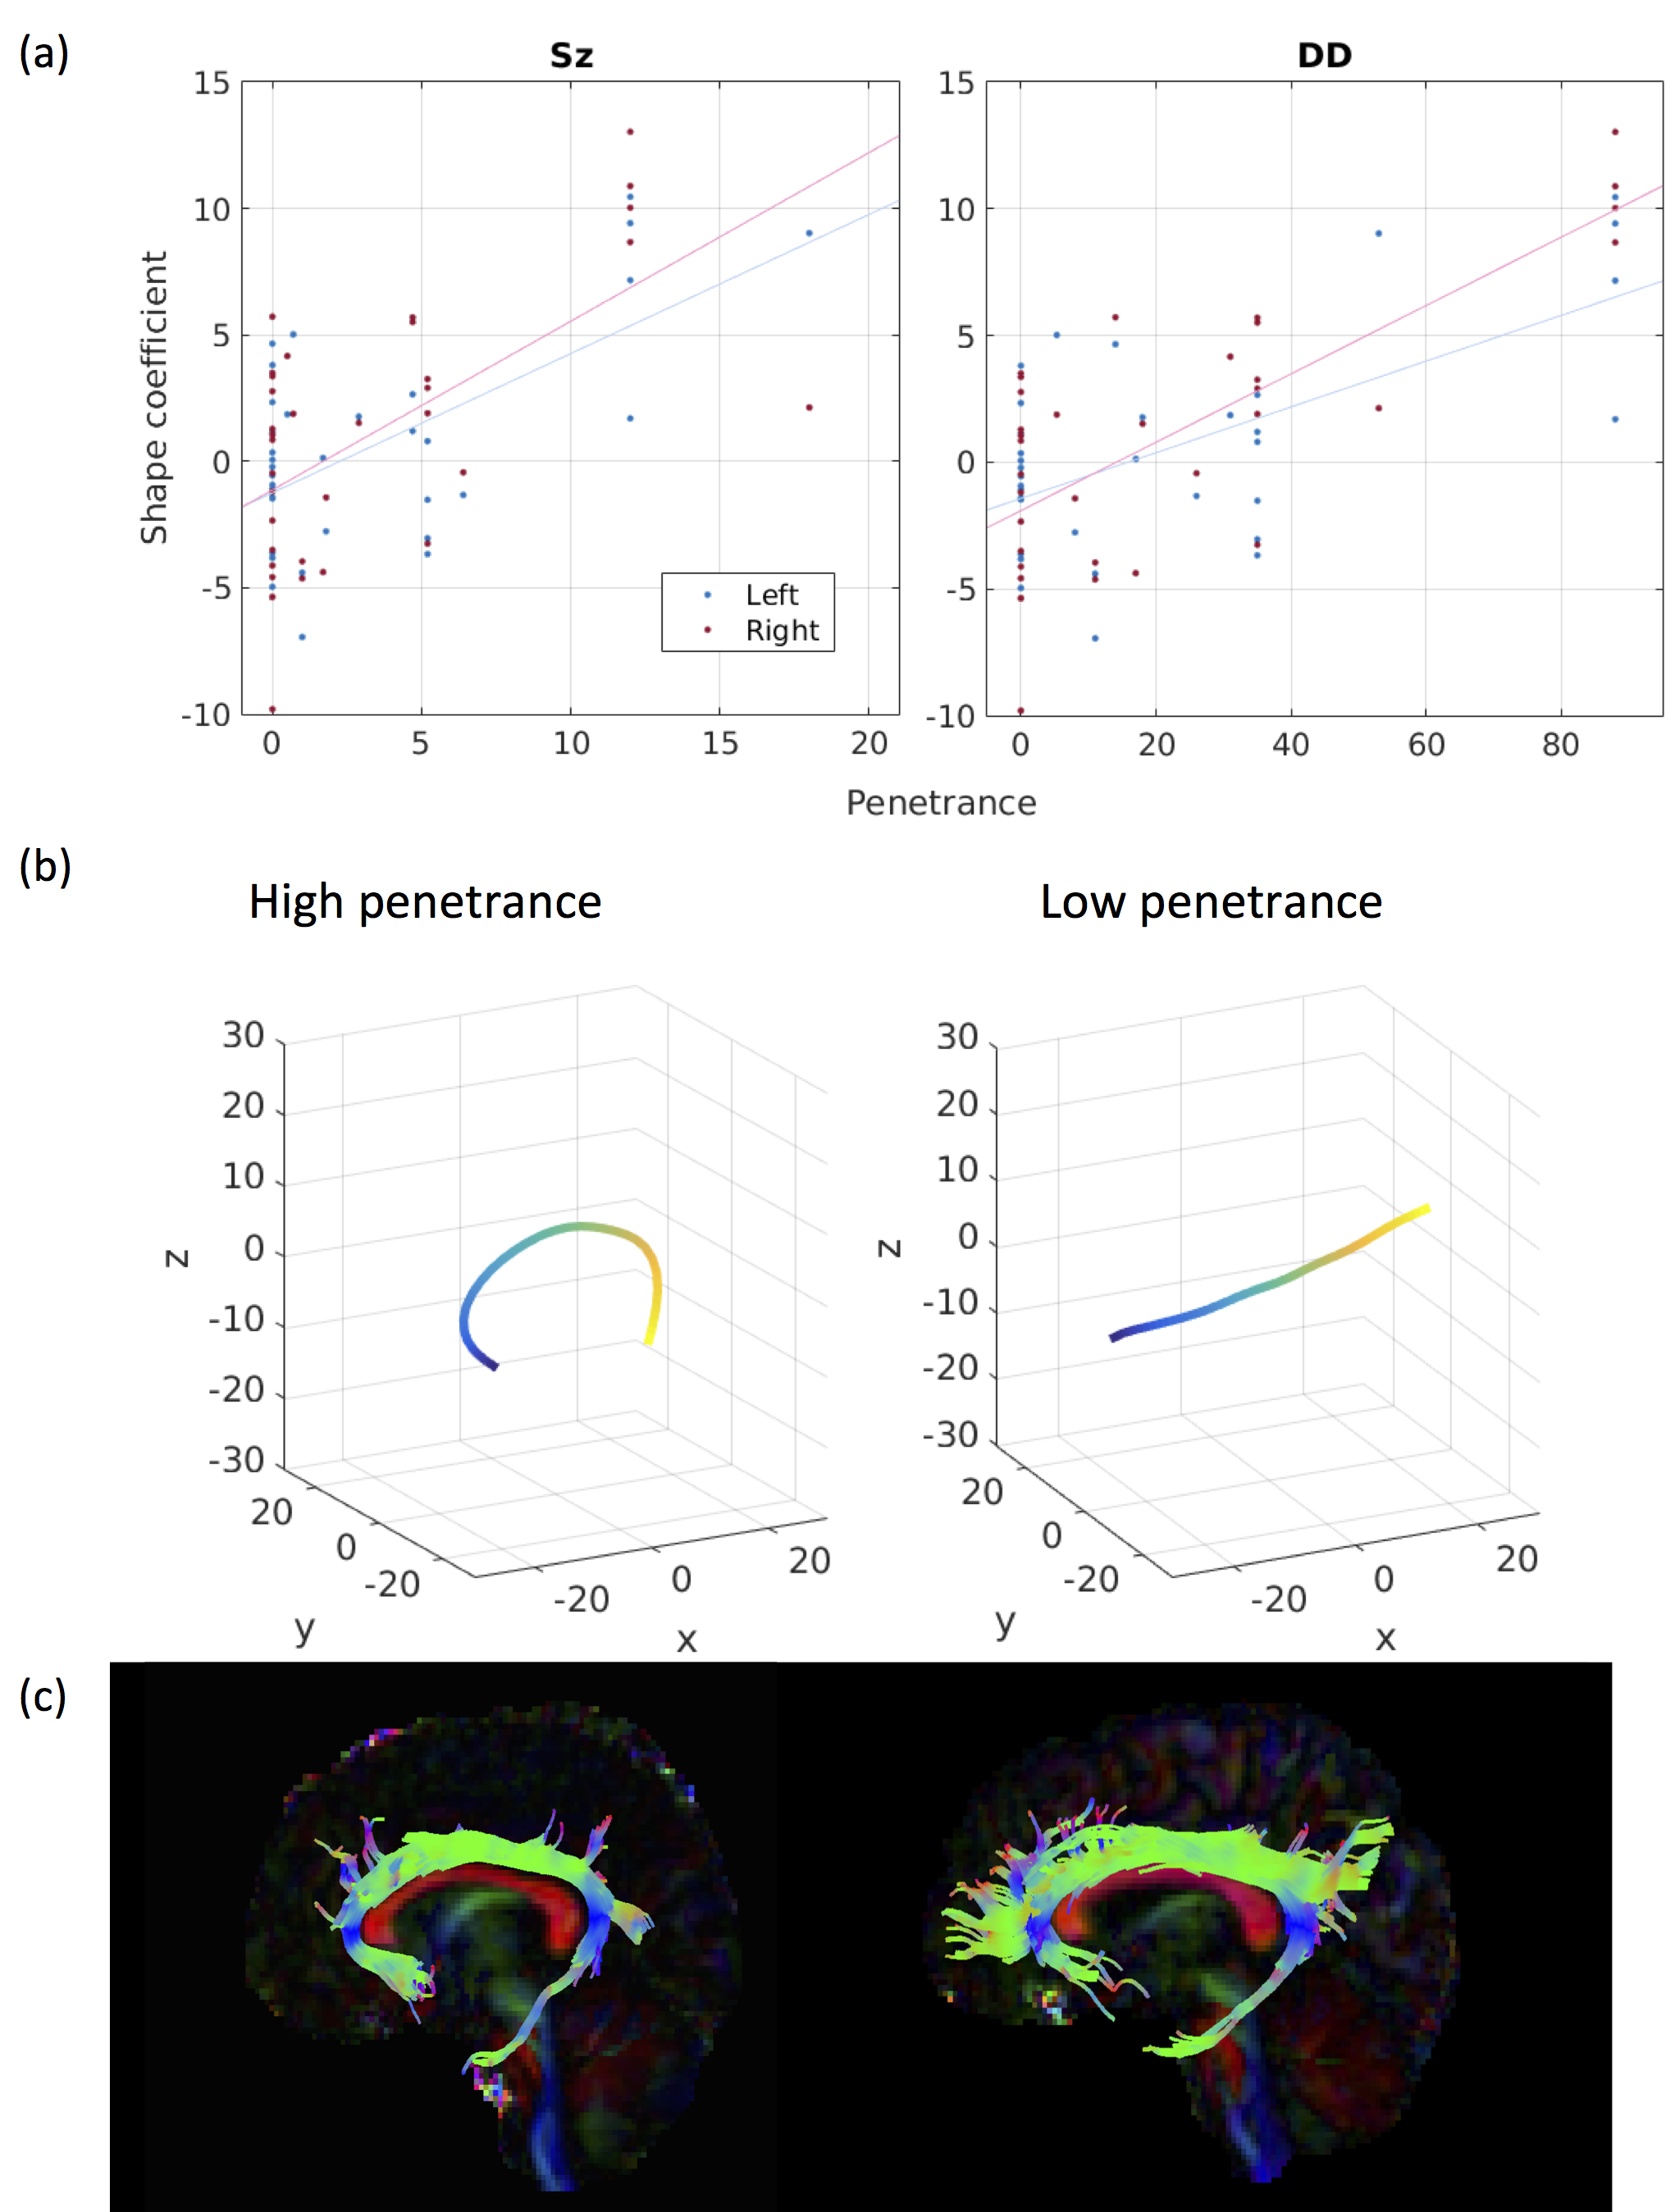
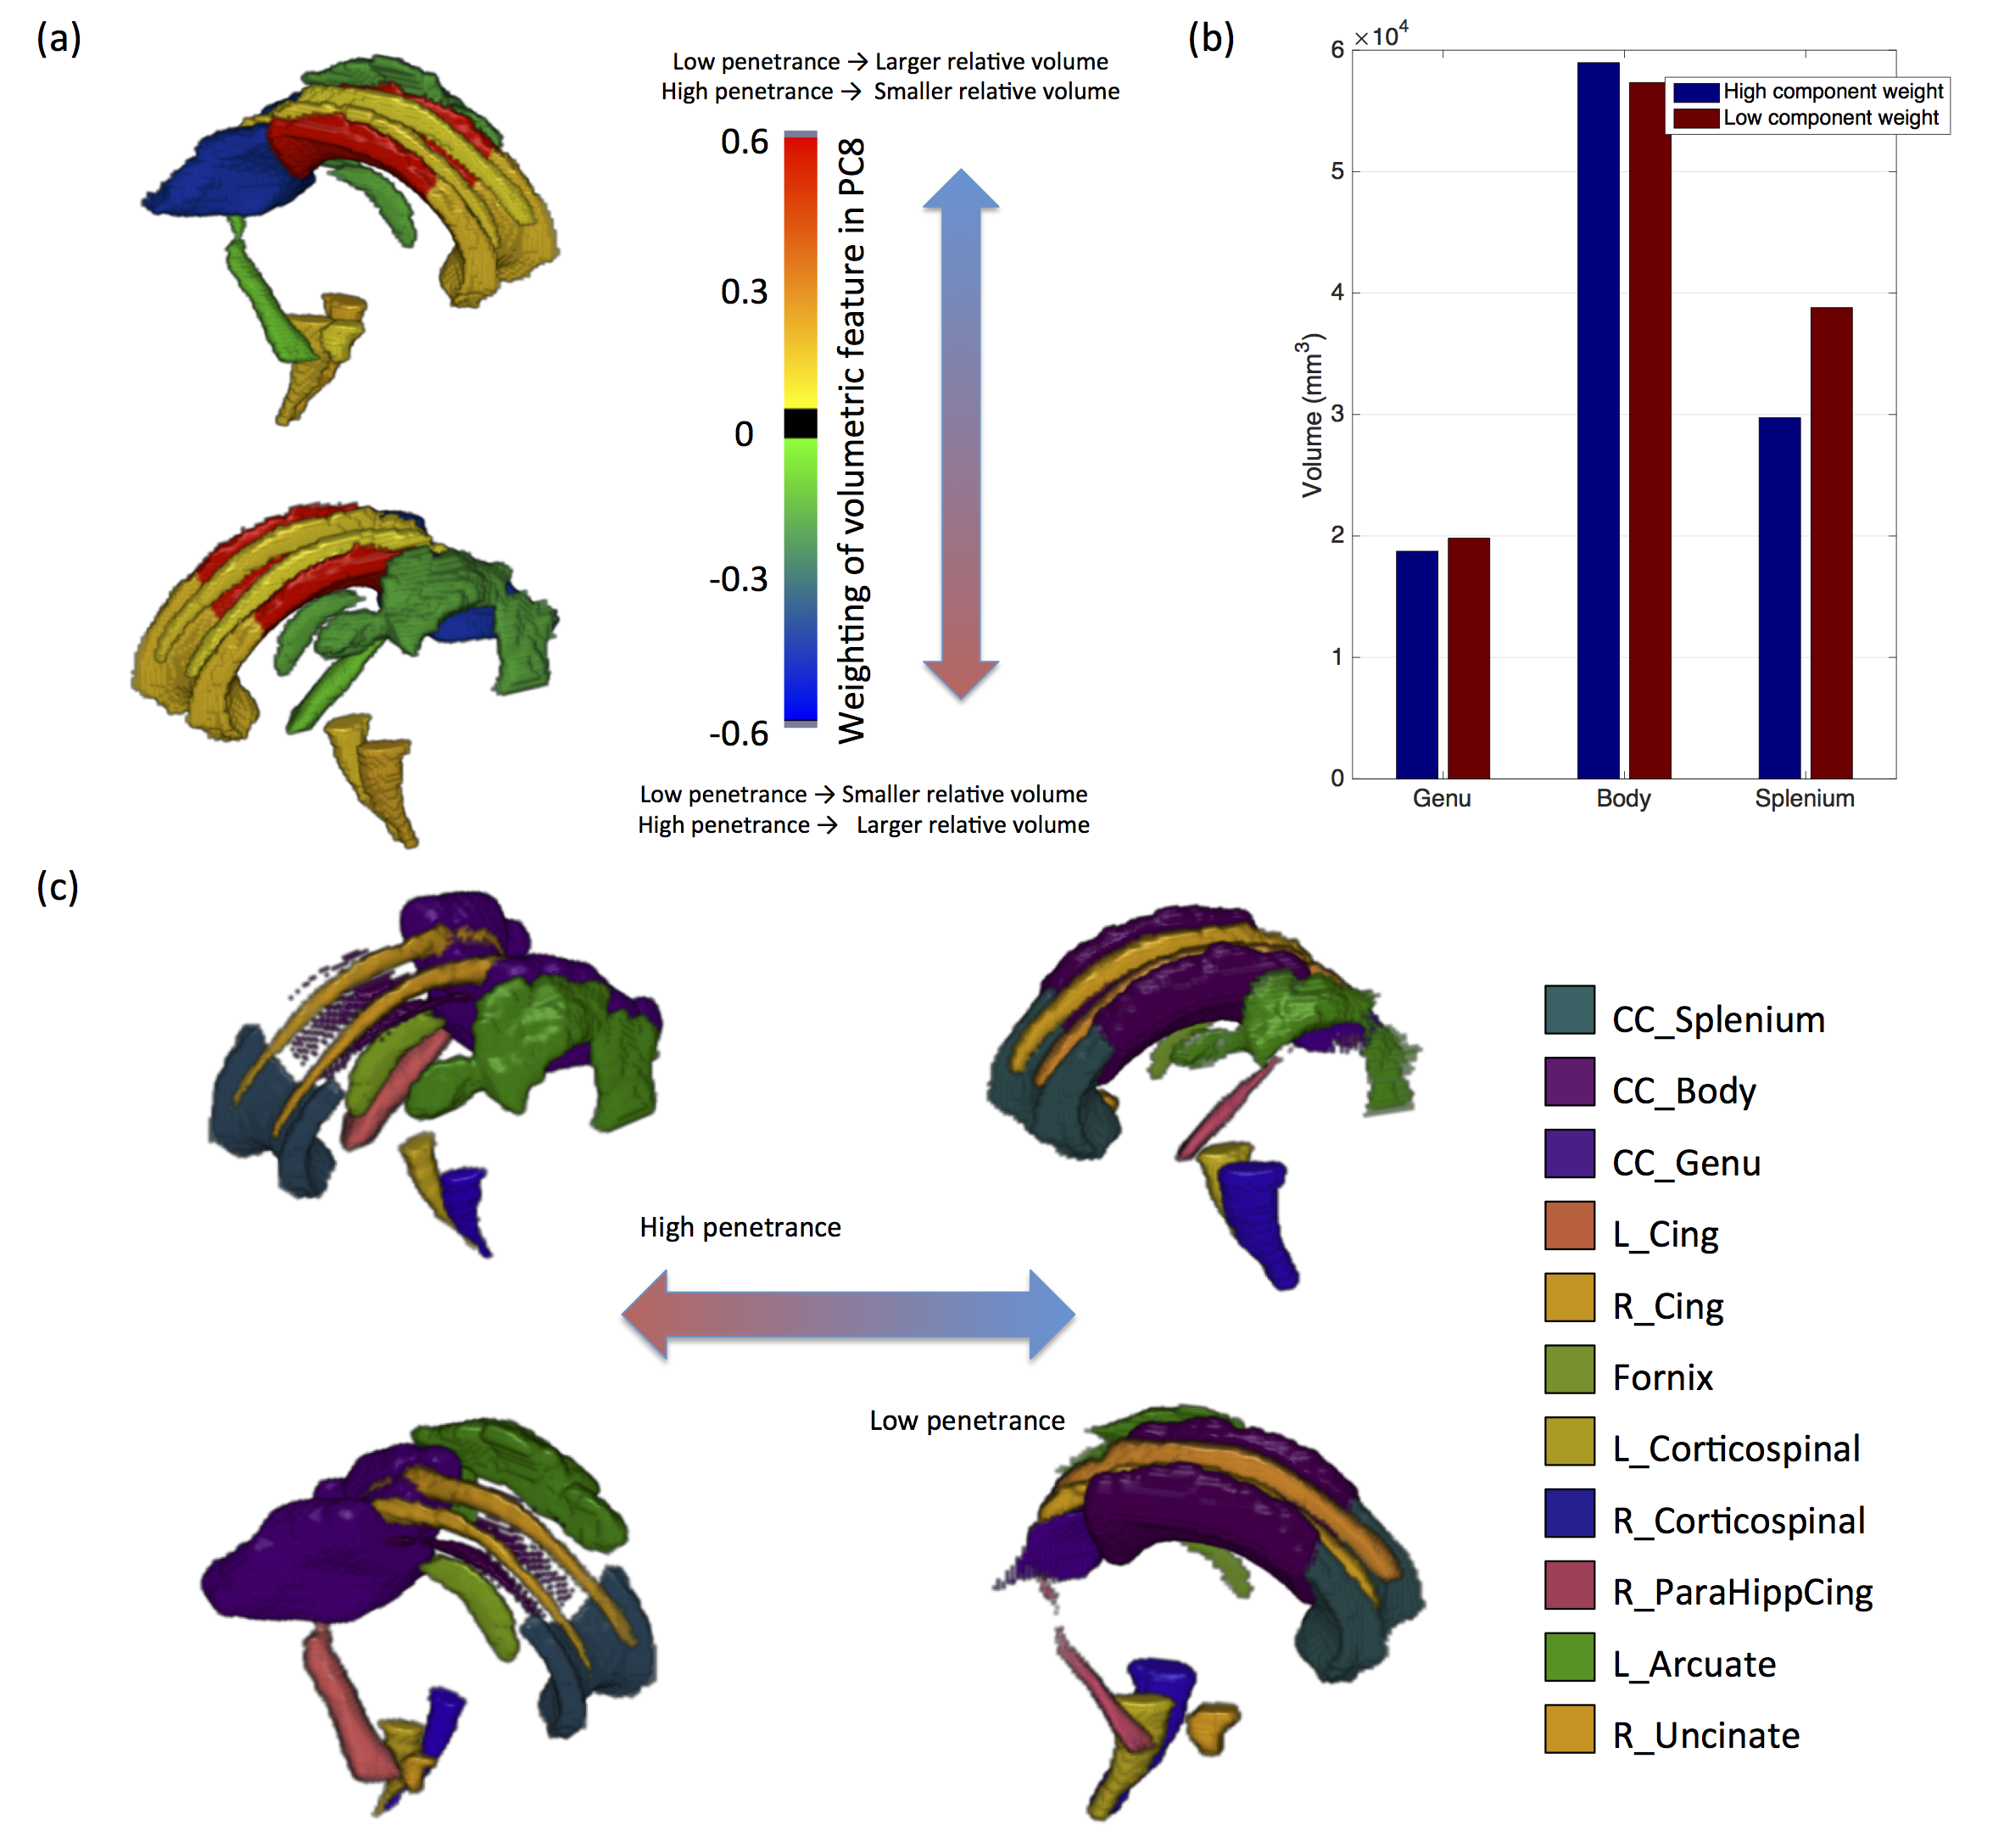
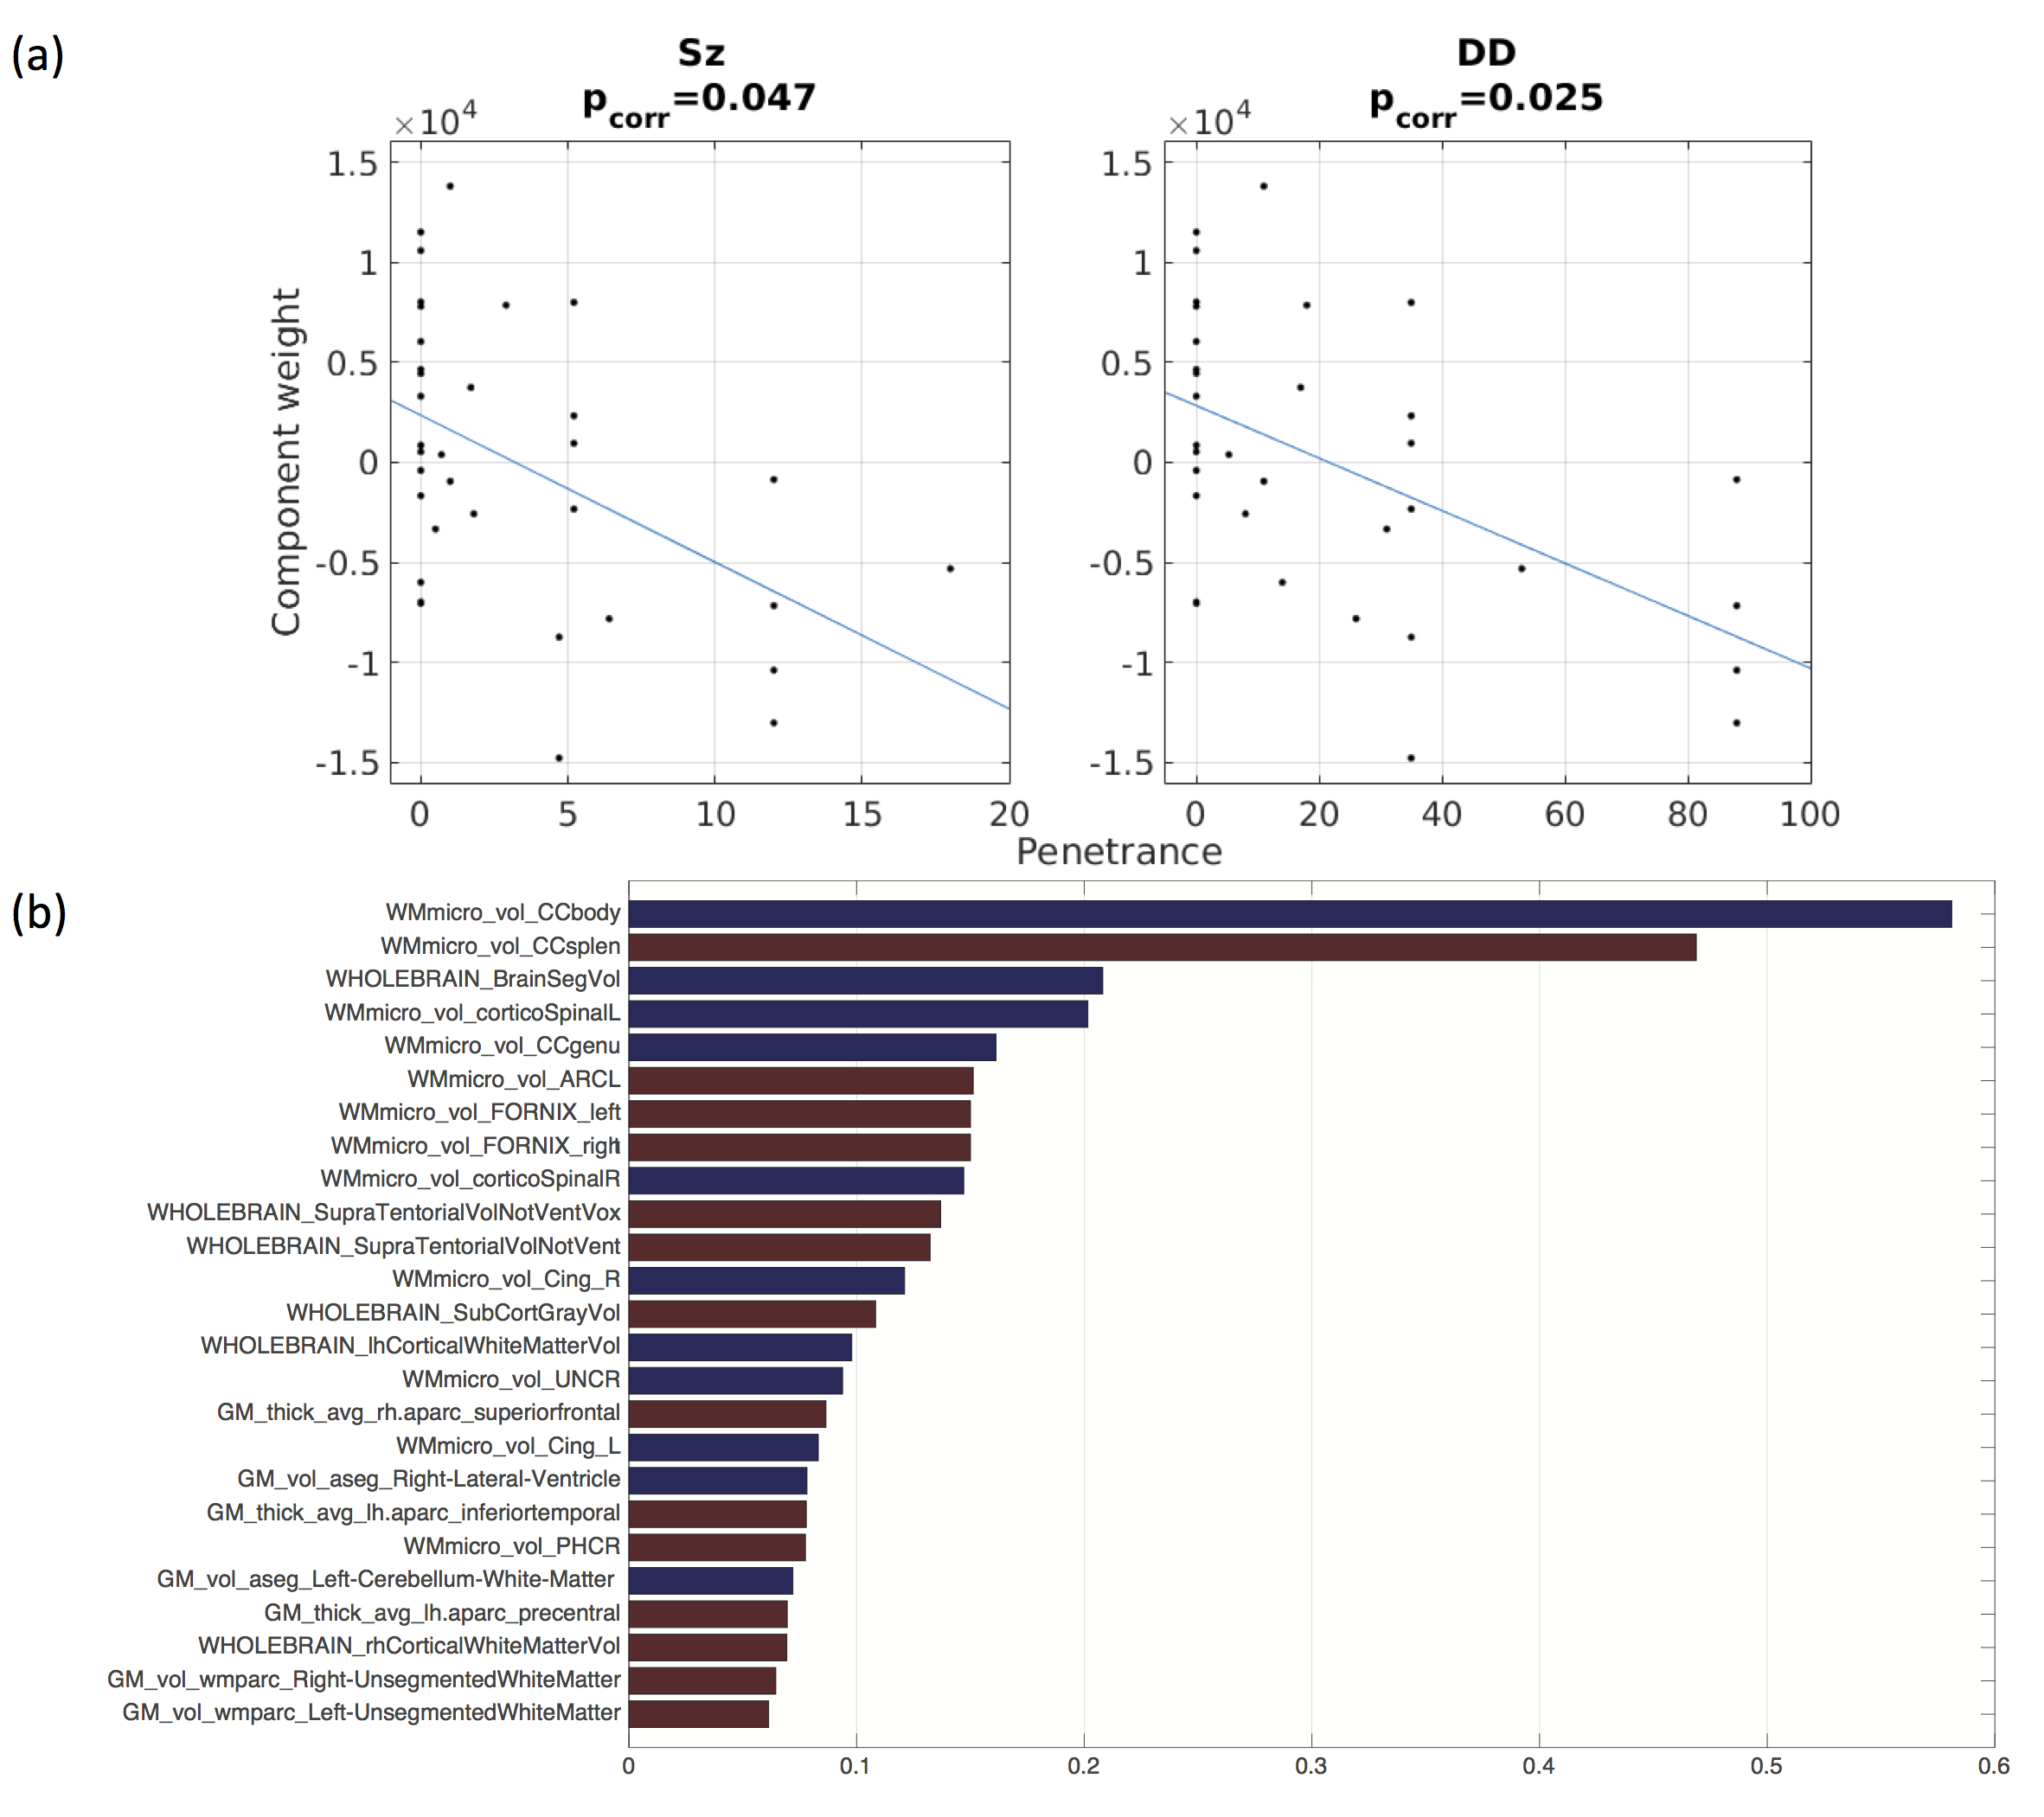
PSz and PDD were significantly related to 2 analogous descriptors in the left and right cingulum bundles (Figure 1a), (all pcorr<0.05, except for PSz in the right cingulum). Both descriptors relate to the curvature of the cingulum along the AP axis, with high-penetrance participants showing greater cingulum curvature (Figure 1b and 1c). No significant effects were found for any other shape descriptors. There were corresponding microstructural effects with reductions in fractional anisotropy (FA) , increases in axial diffusivity and a marginal decrease in intra-cellular volume fraction (ICVF). No direct effects of volume were identified. However, of the components derived using PCA, the 8th component (PC8) showed a very strong effect of both PSz and PDD (figure 2). This component is heavily weighted towards volumes of white-matter fibre bundles, in particular subdevisions of the corpus callosum (splenium, body and genu). There is also weighting towards volumes of the cingulum bundles and some association fibre bundles. Figure 3 visualises the relative volumetric changes associated with PC8. Interestingly, the volumes of the body and splenium are weighted in opposite directions. A post-hoc test on the ratio of volumes between the body and splenium of the corpus callosum shows a negative correlation with both penetrance scores (PSz: t=-2.193, p=0.036; PDD; t=-2.931, p=0.006).Conclusion
Results indicate cingulum morphology and volumetric interrelationship in mid-line white-matter structures are associated with penetrance for schizophrenia and developmental disorders. Given that the dorsal cingulum bundles wrap around the corpus callosum, it likely that the increased curvature of the cingulum and the altered volumetric interrelationships between segments of the corpus calosum stem from the same altered neurodevelopmental trajectory. Although altered morphology of the cingulum does not imply dysconnectivity of the cingulum, the same cohort shows evidence of reduced axon density in the cingulum (evidenced by recuded FA and increased ICVF) of high-penetrance CNV carriers, suggesting that macroscopic morphology of white-matter is related to its microstructure, and therefore its functional connectivity. This may be due to abnmoral forces acting on the cingulum during development altering its morpology and axonal density. The implication of both Sz and DD suggesting that this effect is not specific to a particular domain of illness, but more likely reflective of general neurodevelopmental alterations common in carriers of neuropsychiatric CNVs [8].Acknowledgements
This work was funded by a Wellcome Trust Strategic Award and a Wellcome Trust New Investigator Award.References
1. Doherty JL, Owen MJ. Genomic insights into the overlap between psychiatric disorders: implications for research and clinical practice. Genome Med. BioMed Central; 2014;6:29.
2. Parker GD, Evans GJA, Jones DK. A novel framework for global comparison of tract-topology between subjects reveals callosum shape variations in first episode psychosis. Proc. Int. Soc. Magn. Reson. Med. Singapore; 2016. p. 4131.
3. Kirov G, Rees E, Walters JTR, Escott-Price V, Georgieva L, Richards AL, et al. The Penetrance of Copy Number Variations for Schizophrenia and Developmental Delay. Biol. Psychiatry. Elsevier; 2014;75:378–85.
4. Leemans A, Jeurissen B, Sijbers J, Jones DK. ExploreDTI: a graphical toolbox for processing, analyzing, and visualizing diffusion MR data. Proc. Int. Soc. Magn. Reson. Med. Honolulu, Hawai’i, USA; 2009. p. 3537.
5. Dell’acqua F, Scifo P, Rizzo G, Catani M, Simmons A, Scotti G, et al. A modified damped Richardson-Lucy algorithm to reduce isotropic background effects in spherical deconvolution. Neuroimage. Elsevier Inc.; 2010;49:1446–58.
6. Parker GD, Marshall D, Rosin PL, Drage N, Richmond S, Jones DK. RESDORE: Robust Estimation in Spherical Deconvolution by Outlier Rejection. Proc. Int. Soc. Magn. Reson. Med. Salt Lake City, USA.; 2013. p. 3148.
7. Zhang H, Schneider T, Wheeler-Kingshott C a, Alexander DC. NODDI: practical in vivo neurite orientation dispersion and density imaging of the human brain. Neuroimage. Elsevier Inc.; 2012;61:1000–16.
8. Zackai EH, Gur RC, Emanuel BS, Gur RE. Incidental Radiologic Findings in the 22q11 . 2 Deletion Syndrome. 2014;1–6.
Figures