1802
Structural MRI derived connectivity in Paediatric Mild Traumatic Brain Injury: Acute Neuroimaging and its relationship with executive function outcomes1Aston Brain Center & School of Life and Health Sciences, Aston University, Birmingham, United Kingdom, 2Clinical Sciences, Murdoch Childrens Research Institute, Melbourne, Australia, 3Department of Psychology, University of Montreal, Montreal, QC, Canada, 4Murdoch Childrens Research Institute, Melbourne, Australia
Synopsis
The aim of the current study was to identify acute differences in the topology of the structural covariance network of children after a mild traumatic brain injury (TBI). This was to assess the potential utility of this connectivity analysis applied to T1-weighted MR images, novel in the TBI literature. The main findings of this study were i) both patients and controls exhibited typical frequency distribution of few, highly connected nodes, ii) at a group level, patients exhibited connections between nodes a greater distance apart, iii) these differences were not associated with differences in executive function outcome. Future work will have to move to individual-level SCNS to allow for more complex analyses and to enable investigation of more subtle individual differences in structural covariance.
Introduction
There is a paucity of neuroimaging biomarkers with which to model effects of and recovery from TBI1, particularly paediatric TBI (pTBI), where there exists the added complexity of accounting for changes associated with the healthy developing brain2. Changes to the morphometry of the brain after an injury, beyond expected age-related changes, could reflect ‘brain-health’3, with reductions indicating neurodegeneration/atrophy due to injury4.
Changes to the relationship between regional morphometrics may be a promising way to capture this prognostic information after TBI. Differences in cerebro-cerebellar connectivity in pTBI, compared to controls, occur in the correlation of volumetric information between the cerebellum and the dorsolateral prefrontal cortex5. Recent work has suggested that this structural covariance (SC) between regions can be quantified at the level of the whole brain as a non-random network of ‘connections’6 which are sensitive to neurodevelopmental change7.
SC may better capture complex interactions of both development and the neurobiological consequences of injury, allowing for better outcome prediction. Thus, the current experiment aimed to investigate whether pTBI is associated with differences to the SC network, as a novel potential biomarker of pTBI, compared to controls.
Methods
MRI brain scans were acquired in the early post-injury period (19-88 days) in 45 child survivors of mild TBI (mTBI) and 29 typically developing (TD) controls. High resolution T1- weighted structural MR images were acquired for each participant and T2-FLAIR images (resolution matched in alignment to the 3D T1 weighted sequence). T1 images were preprocessed using the Freesurfer (v6.0) pipeline for skull-stripping and 3D segmentation with T2-sequences used to optimise tissue boundary classification. Cortical thickness measurements, corrected for age and gender, were calculated for regions of the Desikan-Killiany atlas8 subdivided into 308 cortical regions (500mm2).
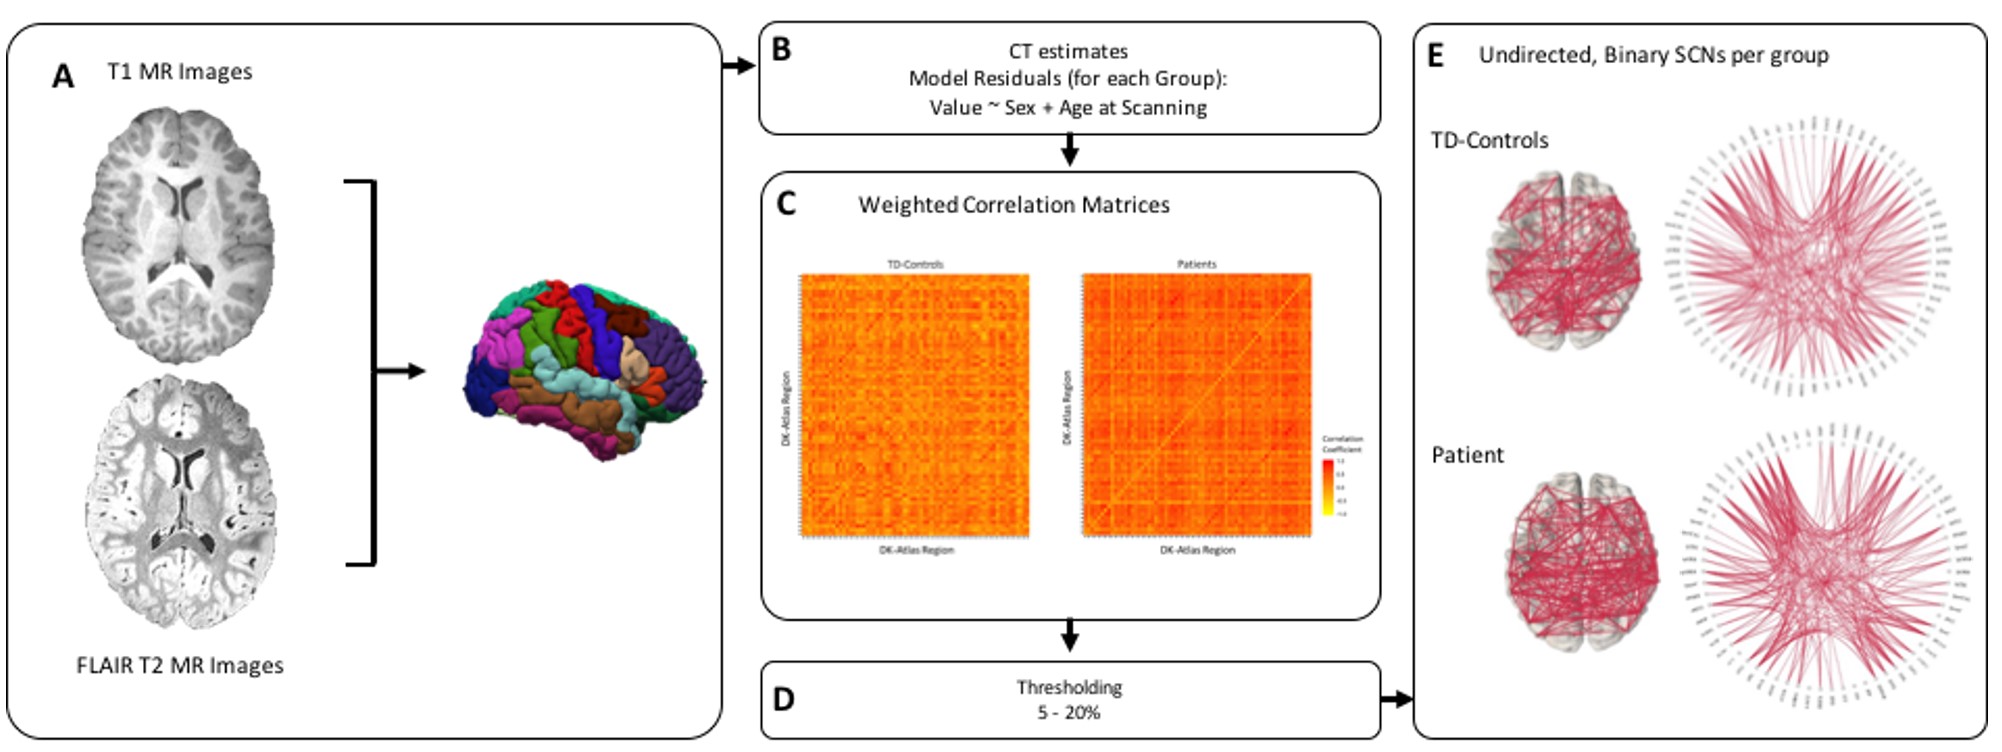
Using the brainGraph R package9, SCNs were constructed at the group-level, by cross-correlating all pairs of regional cortical thickness and thresholding the top 5-20% of correlations (see Figure 1). Network organization was assessed using a graph-theoretic framework.
Neuropsychological assessment of executive function (EF) was obtained two years post-injury for the TBI group. A subgroup analysis was performed on those with clinically relevant cognitive impairment (mTBI-CI+) and those without (mTBI-CI-), with the cutoff being set at performing less than 1SD below age-matched norms on two or more EF measures.
Results
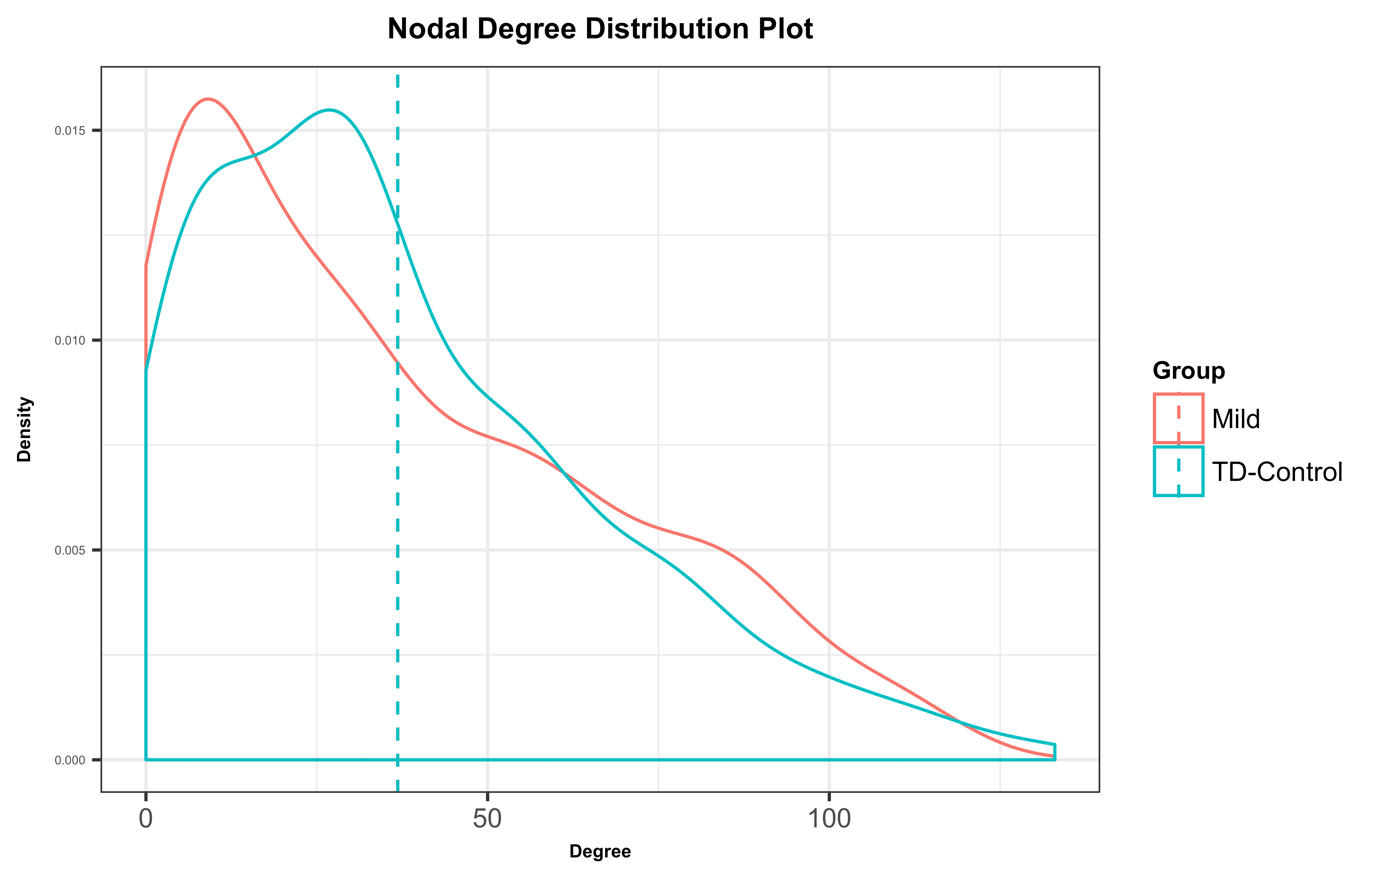
Both groups showed a typical frequency distribution of nodal degree (the number of connections from a node), with many nodes with low degree, and a small number of highly connected nodes (Figure 2).
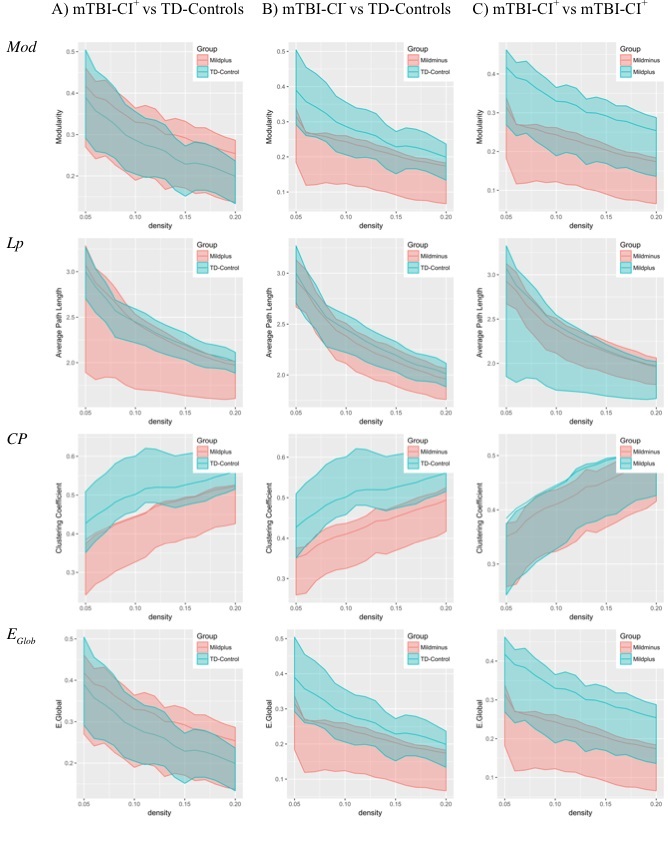
The mTBI group SC network did not differ significantly from that of TD-controls in terms of topological organization on measures of modularity, clustering coefficient, average path length and global efficiency, with large overlap between the bootstrapped 95% confidence intervals (10,000 resamplings). This was also true for when investigating subgroups based on EF outcome (Figure 3).
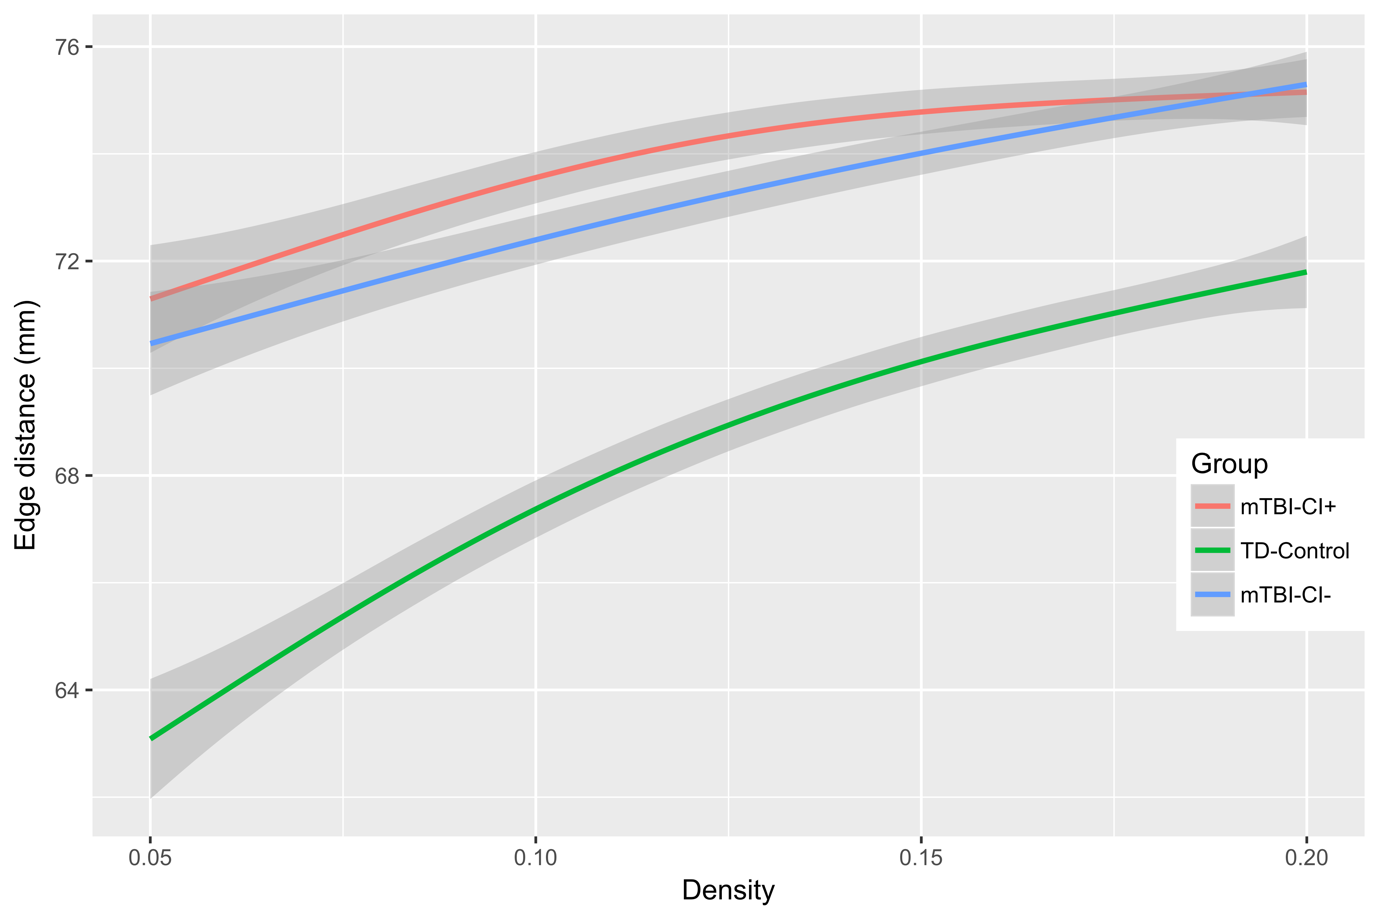
mTBI and TD control groups showed significantly different mean Euclidean distance of network edges across all network densities tested. This difference from controls persisted in both the mTBI-CI+ and mTBI-CI- groups, but no differences between subgroups were found (Figure 4).
Discussion
These findings suggest that the prognostic value of these SC networks is limited as, whilst some differences were found from controls, these differences did not differentiate between those with or without clinically relevant cognitive impairment. This would suggest that these differences are of lesser importance in the functioning of the brain post-injury, although the possibility that the study is underpowered to detect these effects cannot be ruled out.
Differences in mean Euclidean distance between connected nodes would suggest that the cortical thickness is most strongly correlated across more disparate regions of the cortex following injury, compared to TD controls. However, given the more widely found lack of differences between groups, it seems that the organization of these SC networks is similar acutely after TBI.
One potential explanation of these null findings could be the dilution of injury effects due to the SC network being derived at the group level. Some patients may experience damage to the core network hubs, likely resulting in disproportionately large network changes compared to patients whose injury avoided these critical regions. Therefore, individual modelling of SCNs will be necessary for future research, in order to better understand the potential biological underpinnings of parities in outcome following pTBI, and allow for more complex analyses. However, this is a non-trivial transition.
Conclusion
Our findings suggest that, at least at the group-level, the SCN acutely after a mild traumatic brain injury during childhood remains intact, with no significant differences between those who go on to exhibit marked executive function impairment at two years post-injury.Acknowledgements
No acknowledgement found.References
References
1. Hannawi Y, Stevens RD. Mapping the Connectome Following Traumatic Brain Injury. Current Neurology and Neuroscience Reports 2016;16(5).
2. Giza CC, Kolb B, Harris NG, Asarnow RF, Prins ML. Hitting a moving target: Basic mechanisms of recovery from acquired developmental brain injury. Dev Neurorehabil 2009;12(5):255-268.
3. Bigler ED. Traumatic brain injury, neuroimaging, and neurodegeneration. Frontiers in human neuroscience 2013;7.
4. Keightley ML, Sinopoli KJ, Davis KD, et al. Is there evidence for neurodegenerative change following traumatic brain injury in children and youth? A scoping review. Frontiers in human neuroscience 2014;8.
5. Spanos GK, Wilde EA, Bigler ED, et al. cerebellar atrophy after moderate-to-severe pediatric traumatic brain injury. AJNR American journal of neuroradiology 2007;28(3):537-542.
6. Alexander-Bloch A, Raznahan A, Bullmore E, Giedd J. The convergence of maturational change and structural covariance in human cortical networks. The Journal of neuroscience : the official journal of the Society for Neuroscience 2013;33(7):2889-2899.
7. Vasa F, Seidlitz J, Romero-Garcia R, et al. Adolescent Tuning of Association Cortex in Human Structural Brain Networks. Cerebral cortex 2017:1-14.
8. Desikan RS, Segonne F, Fischl B, et al. An automated labeling system for subdividing the human cerebral cortex on MRI scans into gyral based regions of interest. NeuroImage 2006;31(3):968-980.
9. Watson CG. brainGraph: Graph Theory Analysis of Brain MRI Data. Version 1.6.2; 2017.
Figures