1796
Quantitative subcortical morphometry in mTOR/AKT/PI3K pathway disorders: A novel clinical biomarker1Radiology and Biomedical Imaging, University of California, San Francisco, San Francisco, CA, United States
Synopsis
Subcortical volumes were quantitatively evaluated on clinical MRI exams of neurofibromatosis type 1 (NF1) and tuberous sclerosis complex (TSC) patients. Robustly larger volumes of several subcortical structures, including the thalamus, hippocampus and ventral diencephalon, were found in NF1; characteristic NF1 imaging abnormalities are found in these areas. In TSC, we found smaller cerebellar volumes; findings that have been associated with autistic phenotypes. Cluster analysis reveals three distinct clustering patterns, each corresponding to a patient class. These results show the feasibility of obtaining automatic quantitative measurements of anatomic structures from clinical MRI exams.
Introduction
Neurofibromatosis type 1 (NF1) and tuberous sclerosis complex (TSC) are both neurocutaneous genetic disorders caused by mutations of genes in the mTOR/AKT/P13K signaling pathway, a pathway that is critical to growth1, 2. Both mutated genes (NF1 in NF1 and TSC1/TSC2 in TSC) normally form proteins that inhibit the mTOR pathway, therefore both are multisystem disorders with myriad neural manifestations, ranging from benign hamartomatous overgrowth to neoplasias and neurocognitive impairment3.
Both diseases have characteristic, clinically apparent imaging abnormalities. Myelin vacuolization in NF1 is characteristically seen in the deep grey nuclei, brainstem, and cerebellar white matter appearing during the first decade of life and resolving by the second4. Enlargement of the thalami and caudates have also been reported5. TSC patients have multiple cerebral dysplastic and hamartomatous lesions including cortical tubers and subependymal nodules6. Decreased cerebellar cortical volumes are reported in TSC, associated with an autistic phenotype7, 8. We applied established, automated, morphometric MRI methods to clinical scans of NF1 and TSC patients performed at our institution to evaluate the volumetric abnormalities in the subcortical regions affected by these diseases.
Methods
We quantitatively evaluated brain morphometry using the Freesurfer 6.0 software package9 in 32 clinically diagnosed NF1 patients, 26 clinically diagnosed TSC patients, and 245 age and sex matched normal controls from the Pediatric Imaging Neurocognition Genetics (PING) study10. We compared ten intracranial volume (ICV) corrected subcortical regions of interest (ROIs), chosen a priori based on the characteristic location of imaging abnormalities, in NF1 and TSC patients, to controls and generated standard scores (z-scores) for each ICV corrected subcortical ROI. We then evaluated these differences as a function of age and used a hierarchical cluster analysis to evaluate the relationship between subcortical volumes in our three cohorts.Results
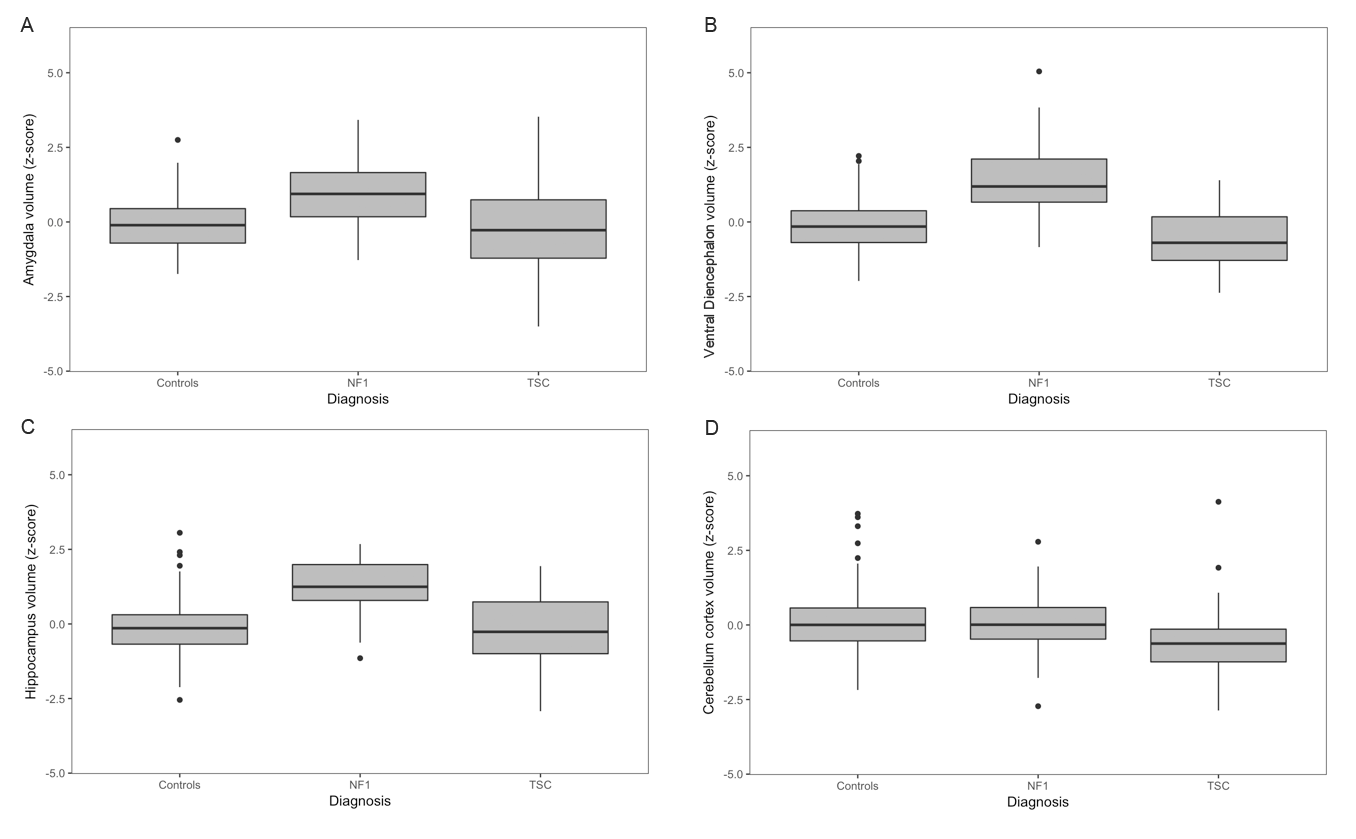
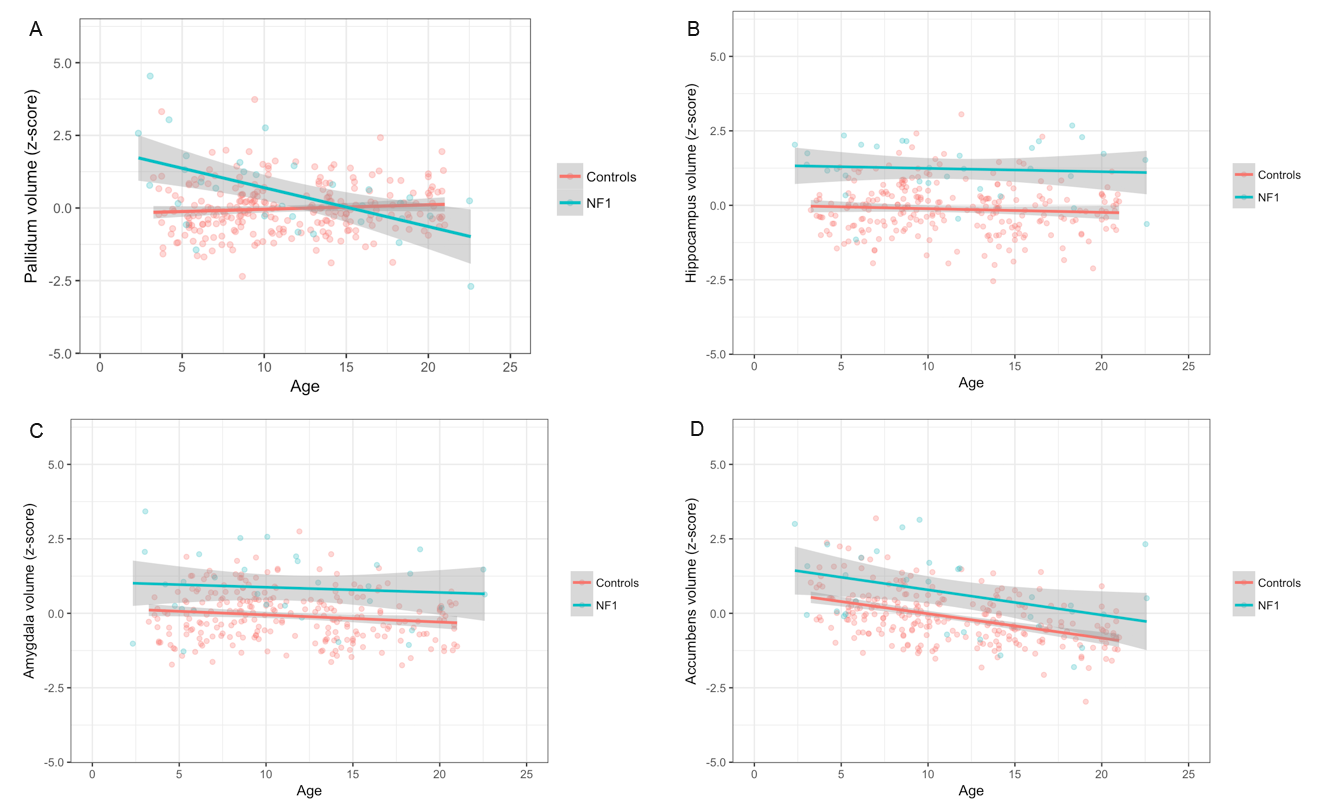
Compared to controls, we found NF1 patients to have significantly larger (Fig. 1) ICV-corrected volumes of the thalamus (β = 1.43, standard error (SE) = 0.16, p-value = 3.38 x 10⁻¹⁶), hippocampus (β = 1.34, SE = 0.16, p-value = 7.84 x 10⁻¹⁶), amygdala (β = 0.93, SE = 0.16, p-value = 1.96 x 10⁻⁸) and ventral diencephalon (β = 1.63, SE = 0.15, p-value = 9.06 x 10⁻²³). In TSC we found significantly smaller ICV-corrected volumes of the putamen (β = -0.54, SE = 0.20, p-value =0.00630), and cerebellar cortex (Fig. 1D) (β = -0.72, SE = 0.19, p-value =0.000261). Although the globus pallidi were significantly larger in NF1 patients (p-value = 0.00246), they showed a significant decrease in volume with respect to age in the NF1 cohort (p-value = 1.39 x 10⁻⁷) (Fig. 2A)Discussion
Both of the examined mTOR pathway disorders have significant volumetric differences from controls on measurements from clinically obtained MRI scans (Fig. 1). Building on prior NF1 morphometry analyses, subcortical volumes are larger in NF1 patients relative to controls in regions where characteristic myelin vacuolization occurs (deep grey nuclei). Also, although our study was not longitudinal, ICV corrected volumes of the globus pallidi in NF1 patients decreased with age, corresponding to the time course of myelin vacuolization (Fig 2A), an effect not seen in other structures or regions of NF1 patients, in TSC patients, or in normal controls. This suggests that there may be other dynamic effects of the NF1 that are not apparent on T2 weighted imaging.
TSC patients exhibit decreased cerebellar volumes (Fig. 1D) and volumetric differences in the basal ganglia. Diminished cerebellar volumes have been reported in TSC8, associated with the autistic TSC phenotype11.
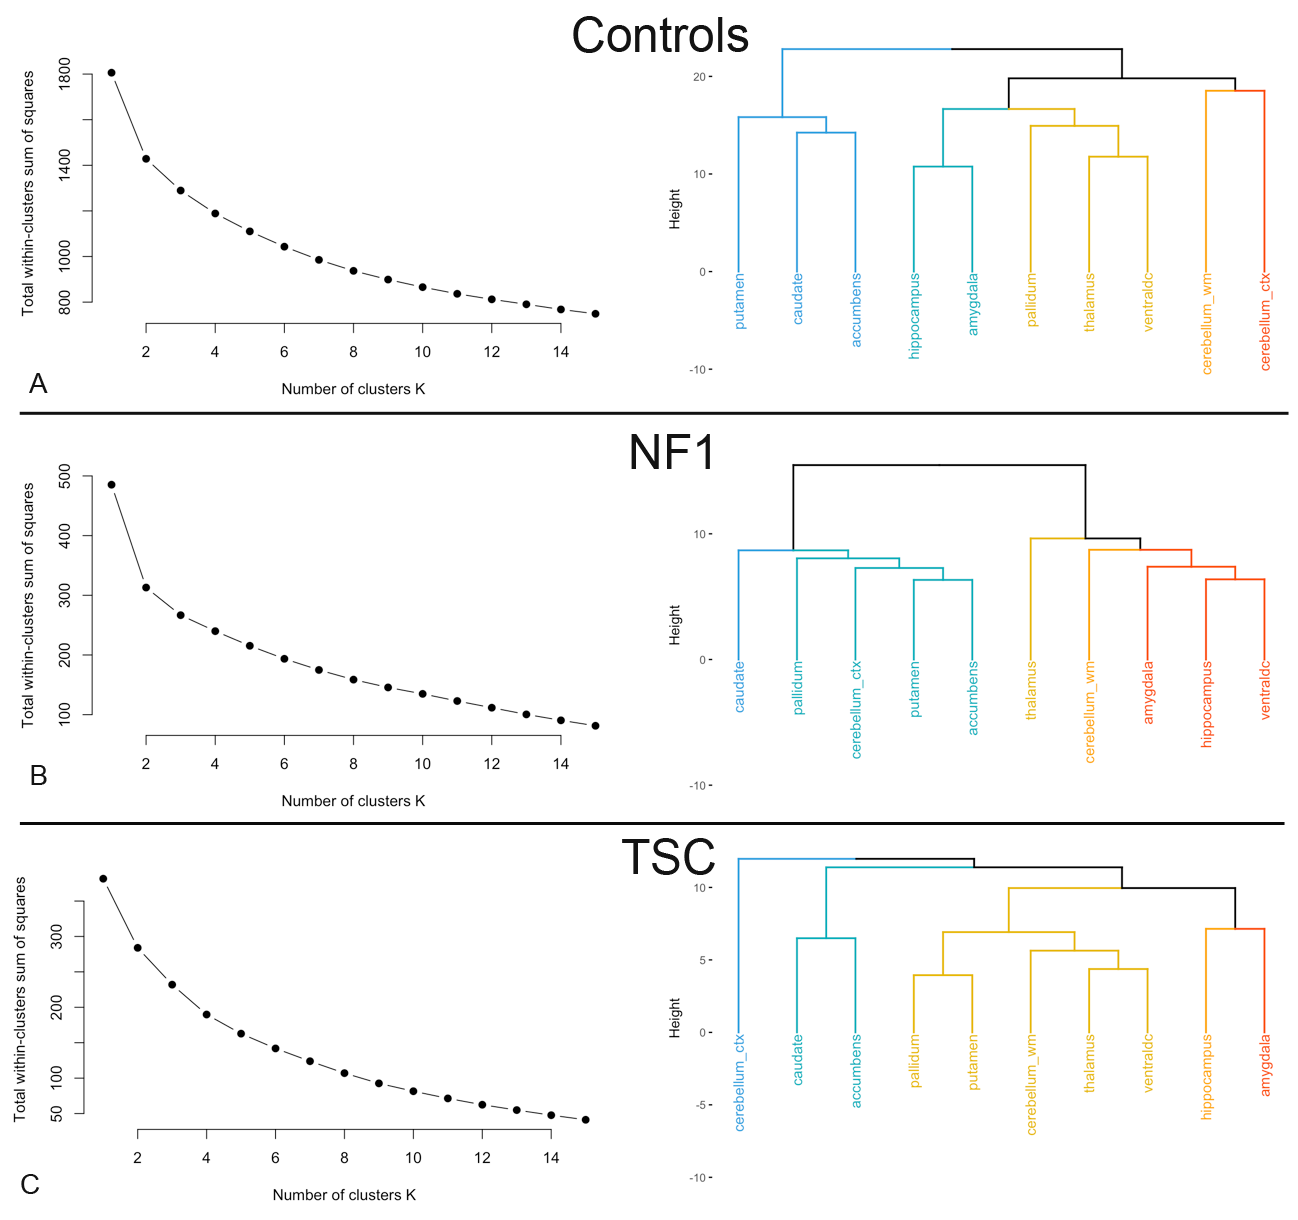
The cluster analysis (Fig. 3) shows three different patterns depending on phenotype. In controls the subcortical regions cluster into known anatomic subdivisions (basal ganglia, limbic system, medial temporal, etc.), whereas in NF1 regions cluster by magnitude of their volumetric effect, and in TSC the cerebellum stands apart from the remaining structures.
Conclusion
NF1 is characterized by robustly larger volumes of several subcortical structures including the thalamus, hippocampus, and ventral diencephalon, the same regions where characteristic myelin vacuolization occurs. In contrast, TSC patients exhibit smaller cerebellar volumes and volumetric changes in the basal ganglia. These results show the feasibility of obtaining automatic quantitative measurements of anatomic structures from clinical MRI exams.Acknowledgements
Dr. Matthew J. Barkovich was supported by the National Institutes of Health (NIBIB) T32 Training Grant, T32EB001631
The UCSD PING study for normative control data.
References
- Cawthon RM, Weiss R, Xu GF, et al. A major segment of the neurofibromatosis type 1 gene: cDNA sequence, genomic structure, and point mutations. Cell. 1990;62:193-201.
- Laplante M, Sabatini DM. mTOR signaling in growth control and disease. Cell. 2012;149:274-293.
- Payne JM, Moharir MD, Webster R, North KN. Brain structure and function in neurofibromatosis type 1: current concepts and future directions. J Neurol Neurosurg Psychiatry. 2010;81:304-309.
- Payne JM, Pickering T, Porter M, et al. Longitudinal assessment of cognition and T2-hyperintensities in NF1: an 18-year study. Am J Med Genet A. 2014;164A:661-665.
- Violante IR, Ribeiro MJ, Silva ED, Castelo-Branco M. Gyrification, cortical and subcortical morphometry in neurofibromatosis type 1: an uneven profile of developmental abnormalities. J Neurodev Disord. 2013;5:3.
- Sundberg M, Sahin M. Cerebellar Development and Autism Spectrum Disorder in Tuberous Sclerosis Complex. J Child Neurol. 2015;30:1954-1962.
- Weisenfeld NI, Peters JM, Tsai PT, et al. A magnetic resonance imaging study of cerebellar volume in tuberous sclerosis complex. Pediatr Neurol. 2013;48:105-110.
- Vaughn J, Hagiwara M, Katz J, et al. MRI characterization and longitudinal study of focal cerebellar lesions in a young tuberous sclerosis cohort. AJNR Am J Neuroradiol. 2013;34:655-659. 9. Fischl B. FreeSurfer. Neuroimage. 2012;62:774-781.
- Jernigan TL, Brown TT, Hagler DJ, Jr., et al. The Pediatric Imaging, Neurocognition, and Genetics (PING) Data Repository. Neuroimage. 2016;124:1149-1154.
- Weber AM, Egelhoff JC, McKellop JM, Franz DN. Autism and the cerebellum: evidence from tuberous sclerosis. J Autism Dev Disord. 2000;30:511-517.
Figures