1795
Investigation of sickle cell related changes in the basal ganglia of pediatric subjects using QSM and R2*.1Radiology, CHOA, Atlanta, GA, United States, 2Radiology, Emory University, Atlanta, GA, United States, 3Pediatrics, Emory University, Atlanta, GA, United States
Synopsis
In previous work on susceptibility differences between controls and subjects with sickle cell disease (SCD) receiving chronic transfusions we found no significant differences in the basal ganglia (BG). In this abstract we added a group of non-transfused SCD subjects and included an analysis of the R2* in order to better understand the nature of any observed changes. Significant differences between the groups were observed in the BG for both susceptibility and R2*, but the pattern of the changes was inconsistent, probably due to the multifactorial nature of R2* in tissues where iron is not the dominant contrast mechanism.
Methods
The susceptibility data for the transfused SCD (SCD-TR, n=25, age=13.23±2.88) and control (CTRL, n=23, age=14.45±3.37) groups was obtained on a 3T Siemens Trio scanner using 12 echoes (TE1=3.70, ΔTE=3.80), the data for the non-transfused SCD (SCD-NT, n=13, age=14.10±2.82) group was obtained on a 3T Philips Ingenia scanner using 5 echoes (TE1=7.21, ΔTE=8.52). For all subjects volumetric T1 weighted scans with an isotopic spatial resolution of ≤1mm were also obtained. 2D FLAIR scans were used to assess for the presence of anatomical abnormalities. The susceptibility data was processed using STI suite (http://people.duke.edu/~cl160/index.html) and cortical grey matter was used as the reference tissue for the susceptibility data (1). R2* values were derived by fitting ln(signal) against the echo time. The anatomical data was processed using Freesurfer (https://surfer.nmr.mgh.harvard.edu/fswiki) to derive patient specific regions of interest (ROIs) for Thalamus (TH), Putamen (PU), Caudate Nucleus (CN) and Globus Pallidus (GP). The ROIs were registered to the susceptibility data by registering the anatomical data to the first echo data using the BB register tool in Freesurfer. On review the Freesurfer GP ROIs were found to poorly match the susceptibility images, hence the Freesurfer ROIs for the GP were replaced with ROIs drawn manually on the susceptibility images. The susceptibility and R2* values from the left and right hemispheres were averaged for each subject. Separate ANOVA analyses were performed to control for age against susceptibility and R2* respectively in the basal ganglia ROIs for the three groups. For the limited age range used in thus study it was assumed that the changes in tissue iron content with age can be approximated by a linear function. The Tukey–Kramer method was used to perform post-hoc tests to determine significant differences between the group means.Results
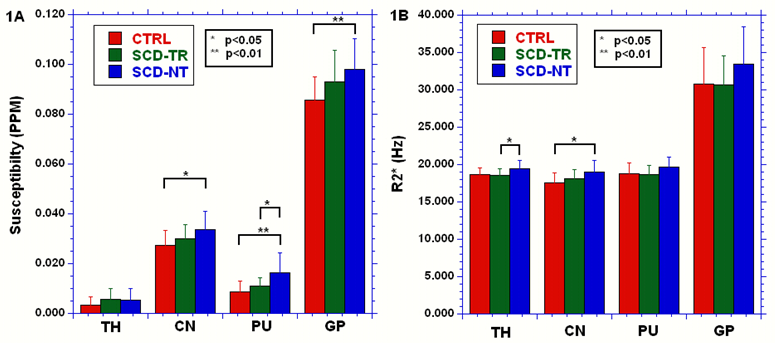
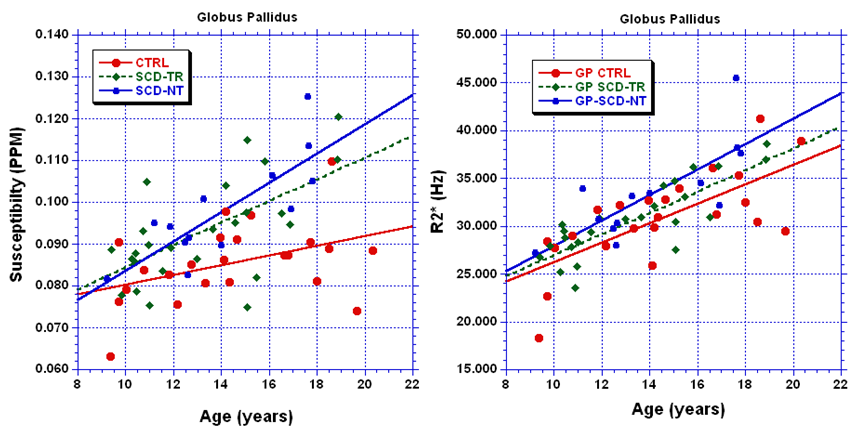
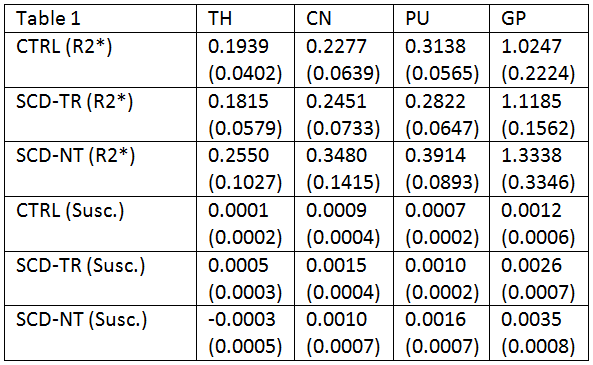
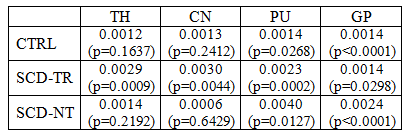
There were no significant differences between the ages of the groups. Figures 1A and 1B summarize the results for the susceptibility and R2* data respectively. The SCD-NT group had the highest susceptibility in all regions except the TH, and the highest R2* values in all four regions. The GP had the highest susceptibility and R2* due to its higher iron content, however, while the R2* values of the other three regions were very similar for all three groups, the susceptibility values were much higher in the CN than in either the PU or TH. Figure 2 show linear fits for the age dependence of the susceptibility and R2* values in the GP. Table 1 shows the age dependency of susceptibility and R2* values. A linear regression was performed between the QSM and the R2* values, the slope of the resulting fits, and the significance of the results, are shown in table 2.
Discussion
The susceptibility values in the GP were similar for the two SCD groups and higher than the control group (but only significantly so for the SCD-NT group), thus elevated iron content in the GP appears to be an intrinsic characteristic of sickle cell disease, rather than a product of transfusion therapy. The elevated susceptibility and R2* values in the SCD-NT may reflect increased tissue iron or other disease related effects. The correlation between R2* and susceptibility was strongest in the GP for two of the three groups, the exception being the SCD-TR group, however, two outliers accounted for much of the variance in this group and removing these reduced the p value to 0.0001. The SCD-TR group showed significant correlations in the TH, PU and CN, the other groups showed either no or low significance and had no obvious outliers. Susceptibility and R2* are known to have a similar age dependency (2). In our study the absolute susceptibility, but not R2*, values differed between the TH, PU and CN. The absence of differences between the tissues by R2* suggests iron content may be masked by other factors known to affect absolute R2* signal. This effect would appear to be most prevalent in tissues with lower iron content where such effects become more important. The reason for the stronger correlations between susceptibility and R2* in the SCD-TR group unclear. In the SCD-NT group disease related changes may reduce the correlation, as do the large errors in the slopes in TH and CN, but one would have expected the CTRL group to have similar characteristics to the SCD-TR group, assuming that the transfusions correct for the majority of the anemia induced by SCD.Conclusion
Both susceptibility and R2* measures were able to detect significant differences between the groups, however, more differences, and differences at a higher level of significance, were found using the susceptibility data.Acknowledgements
No acknowledgement found.References
1) Quantitative susceptibility mapping (QSM) and R2* in the human brain at 3T: Evaluation of intra-scanner repeatability. Feng X, Deistung A, Reichenbach JR. Z Med Phys. (16) 30114-3 (2017)
2) Differential Developmental Trajectories of Magnetic Susceptibility in Human Brain Gray and White Matter Over the Lifespan. Lei W, Wu B et al. Human Brain Mapping. 35:2698–2713 (2014)
Figures