1789
Longitudinal myelin development in children born very preterm compared with typically developing peers1Victorian Infant Brain Studies (VIBeS), Murdoch Children's Research Institute, Melbourne, Australia, 2Developmental Imaging, Murdoch Children's Research Institute, Melbourne, Australia, 3Department of Paediatrics, The University of Melbourne, Melbourne, Australia, 4Florey Institute of Neuroscience and Mental Health, Melbourne, Australia, 5Neuroscience Research, Murdoch Children's Research Institute, Melbourne, Australia, 6Department of Neurosurgery, The Royal Children's Hospital, Melbourne, Australia, 7Department of Pediatric Newborn Medicine, Brigham and Women’s Hospital, Harvard Medical School, Boston, MA, United States, 8Clinical Epidemiology & Biostatistics Unit, Murdoch Children's Research Institute, Melbourne, Australia, 9Neonatal Medicine, The Royal Children's Hospital, Melbourne, Australia, 10Department of Obstetrics and Gynaecology, The University of Melbourne, Melbourne, Australia, 11The Royal Women's Hospital, Melbourne, Australia, 12Monash Institute of Cognitive and Clinical Neurosciences, Monash University, Melbourne, Australia
Synopsis
Myelin development over time in preterm children remains unclear. This study compared T1/T2 myelin maps for 81 very preterm (VP) and 29 full-term children between 7 and 13 years of age. On average, VP children had higher T1/T2 ratios than full-term children in most white matter tracts and deep gray matter structures at both time points. This may reflect compensation or developmental catch-up. T1/T2 ratios increased from childhood to adolescence in both VP and full-term children, shedding light on typical and atypical myelin maturation.
Introduction
The long-term vulnerability of myelin in very preterm (VP) infants remains unresolved,1 particularly over the childhood to adolescence developmental period. The ratio of T1- and T2-weighted structural MRI images may provide insight into myelin maturity.2, 3 This technique is attractive because it requires only images routinely acquired in most clinical MRI examinations. The T1/T2 ratio may be more specific to myelin than microstructure measures from diffusion tensor imaging,3 and has not been previously applied to a longitudinal pediatric cohort.
This study aimed to use the T1/T2 ratio to (1) compare myelin in the white matter (WM) and deep gray matter (DGM) between VP and full-term (FT) children at 7 and 13 years of age; and (2) to describe the myelin development trajectory between 7 and 13 years of age, and whether this trajectory differs between VP and FT children.
Methods
One hundred and thirty-four children born VP (<30 weeks’ gestation) or very low birthweight (<1250g) and 35 children born FT (37-42 weeks’ gestation) had usable scans at 7 years, and 81 VP and 29 FT children were followed up at 13 years.
At 7 years, T1 (0.85 mm sagittal slices, TR/TE = 1900/2.27 ms) and T2-weighted images (0.9 mm sagittal slices, TR/TE = 3200/447 ms) were obtained using a 3T MRI, and similarly at 13 years (T1: 0.9 mm sagittal slices, TR/TEs = 2530/1.77, 3.51, 5.32, 7.2 ms; T2: 0.9 mm sagittal slices, TR/TE = 3200/532 ms).
Images were bias corrected4 and intensity calibrated against the mean image intensity values from two tissue masks with relatively homogeneous image intensities, cerebrospinal fluid and fat layer of the scalp, segmented in subject space. The ratio of the T1-to-T2 image was then calculated. T1/T2 myelin maps were non-linearly warped5 to standard atlases to obtain intensity values for 48 WM regions from the JHU ICBM-DTI-81 white-matter atlas and six DGM regions from the Harvard-Oxford atlas.
Group differences in mean T1/T2 intensity within brain regions at 7 and 13 years were assessed using separate linear regression models for each brain region, adjusting for age at MRI and sex. For each brain region, 2-level linear mixed effects regression models were used to examine the T1/T2 trajectory in VP and FT children from 7 to 13 years of age. Group was included as a predictor with a random intercept to allow for correlations between repeated observations within participants. Time was included as a continuous variable of age (in years) at assessment. An interaction term between group and time was included to determine whether the T1/T2 trajectory differed between groups, and models were adjusted for sex.
Results
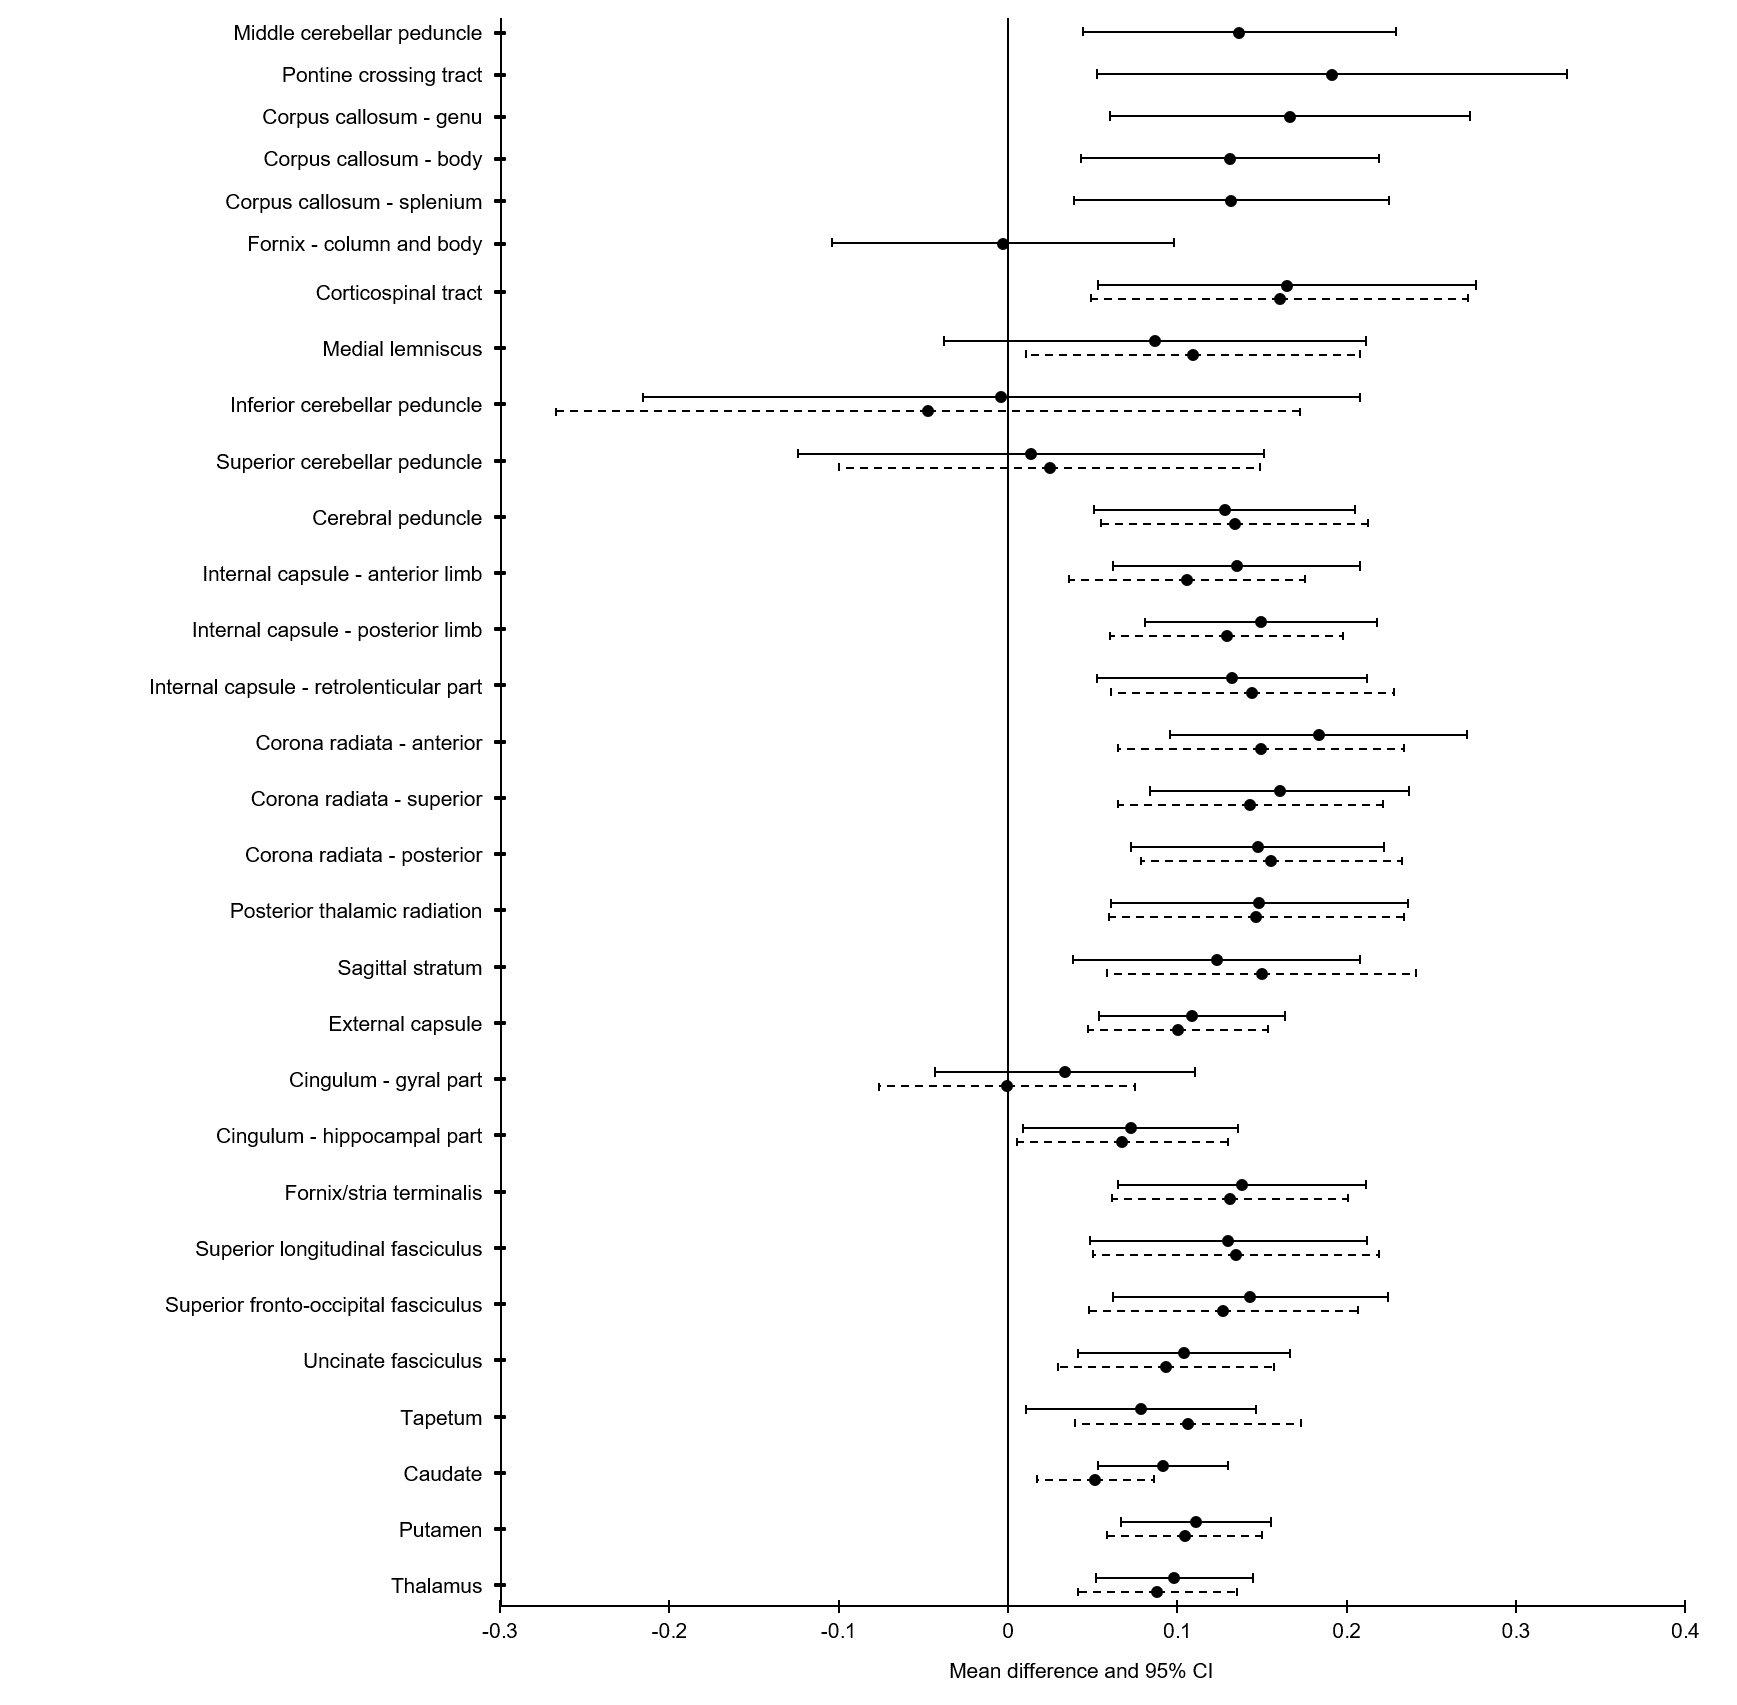
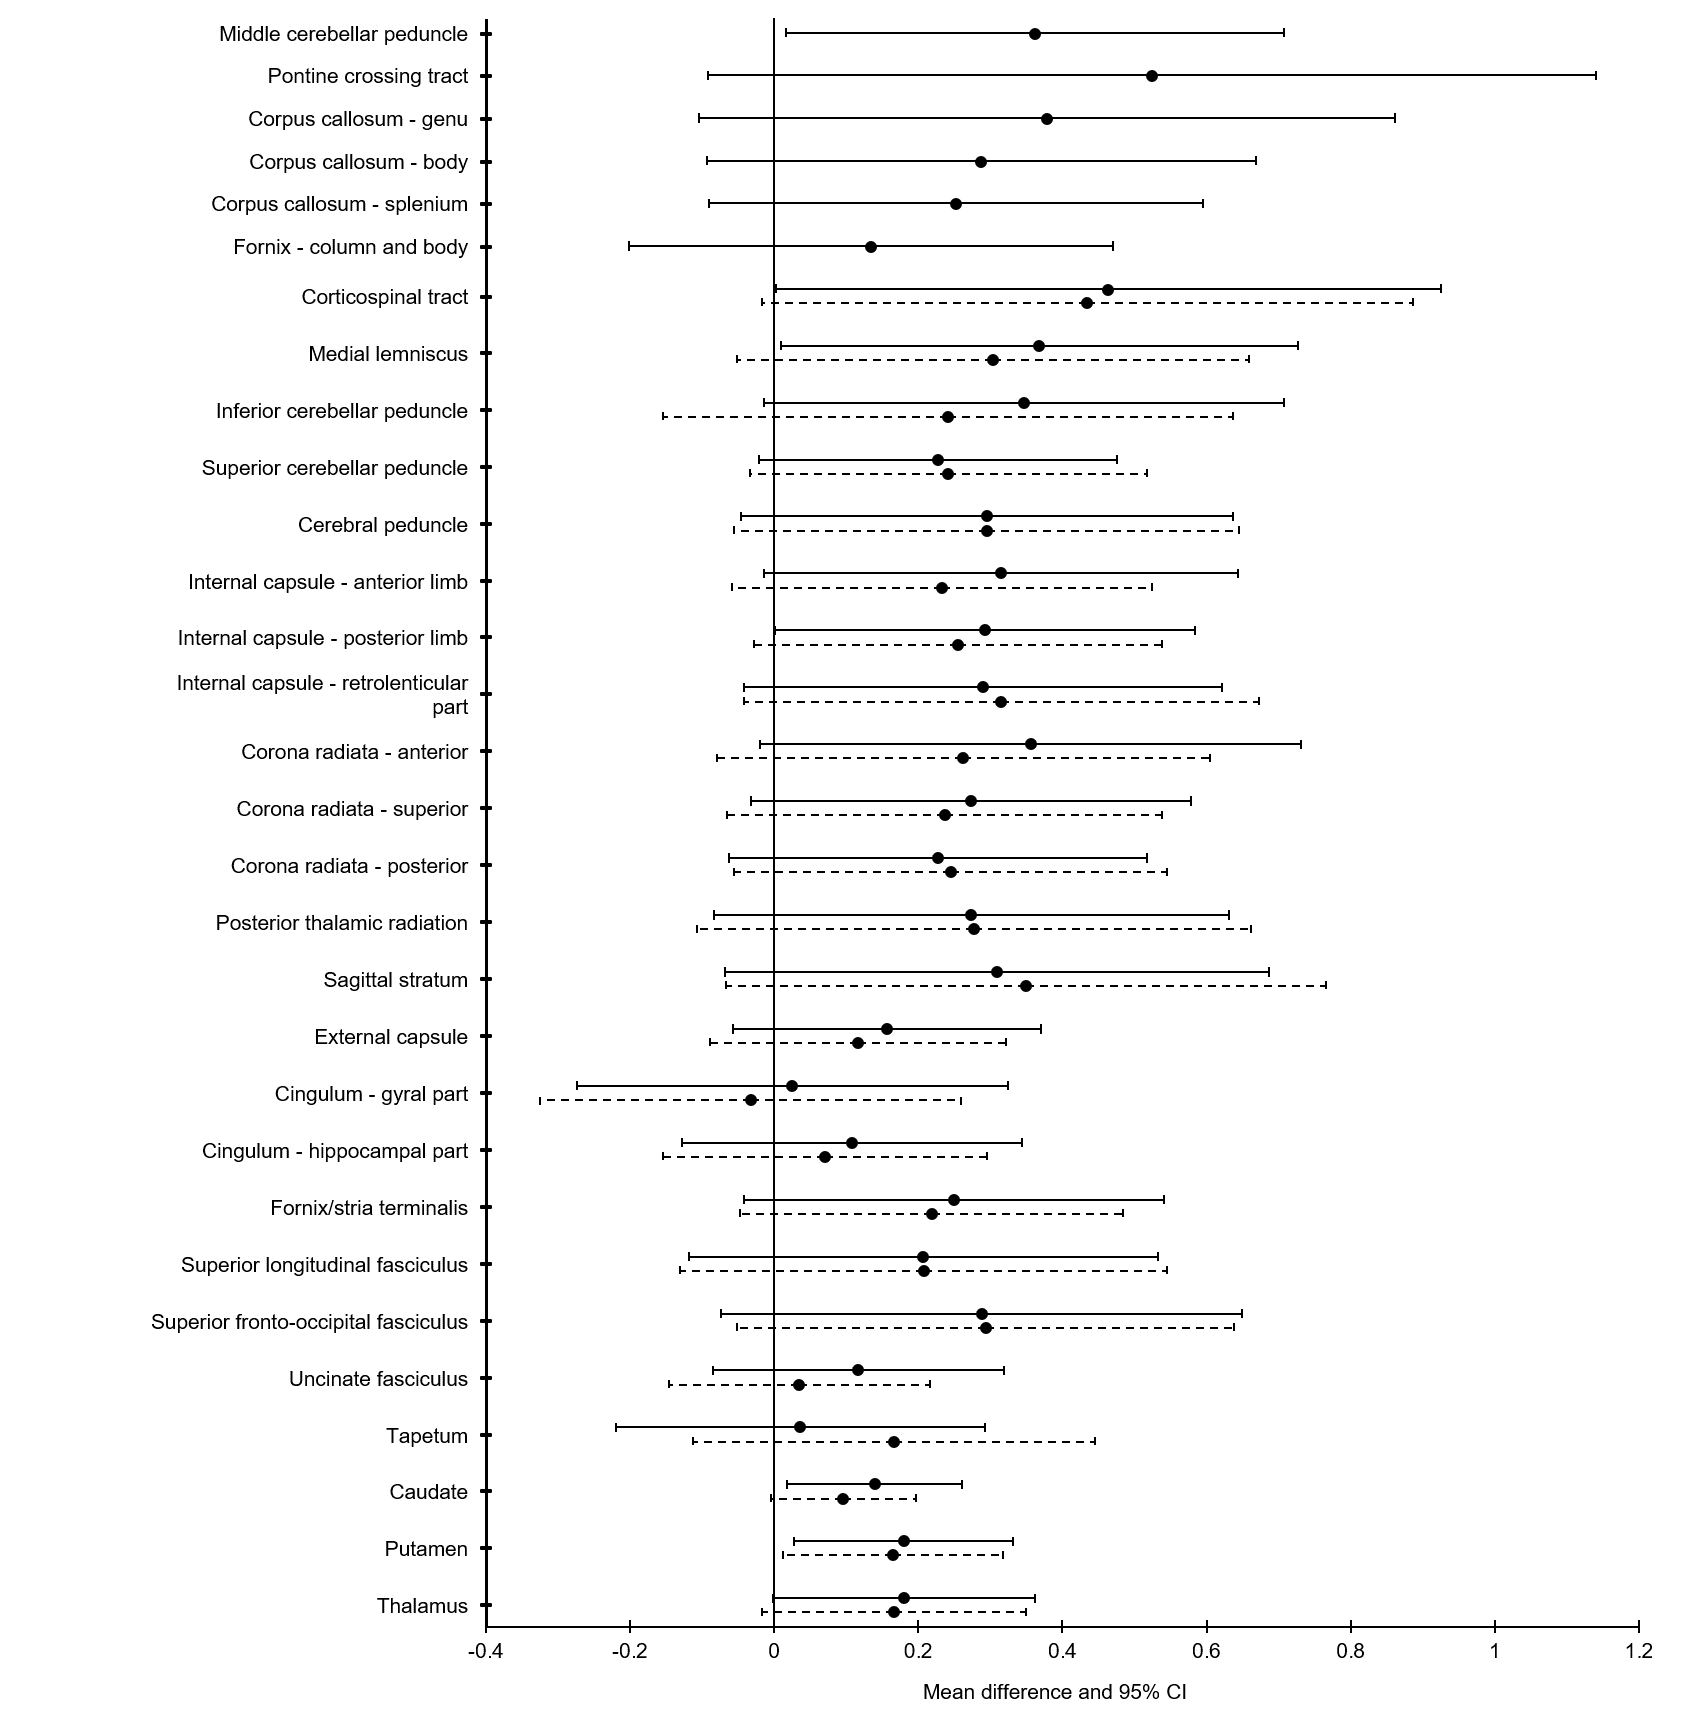
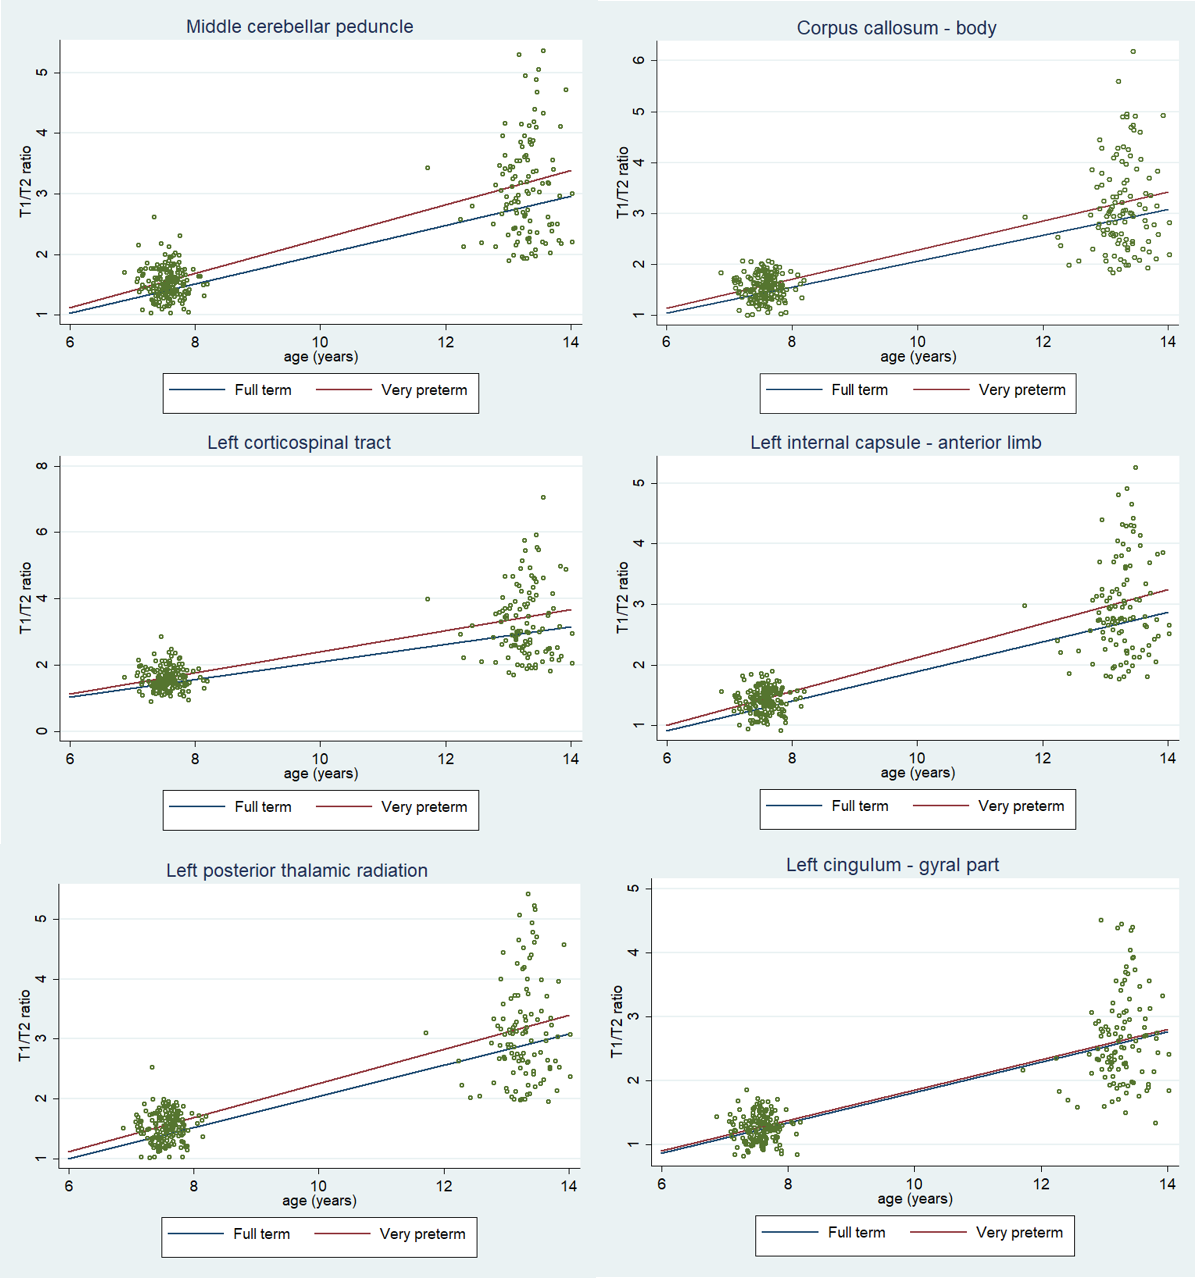
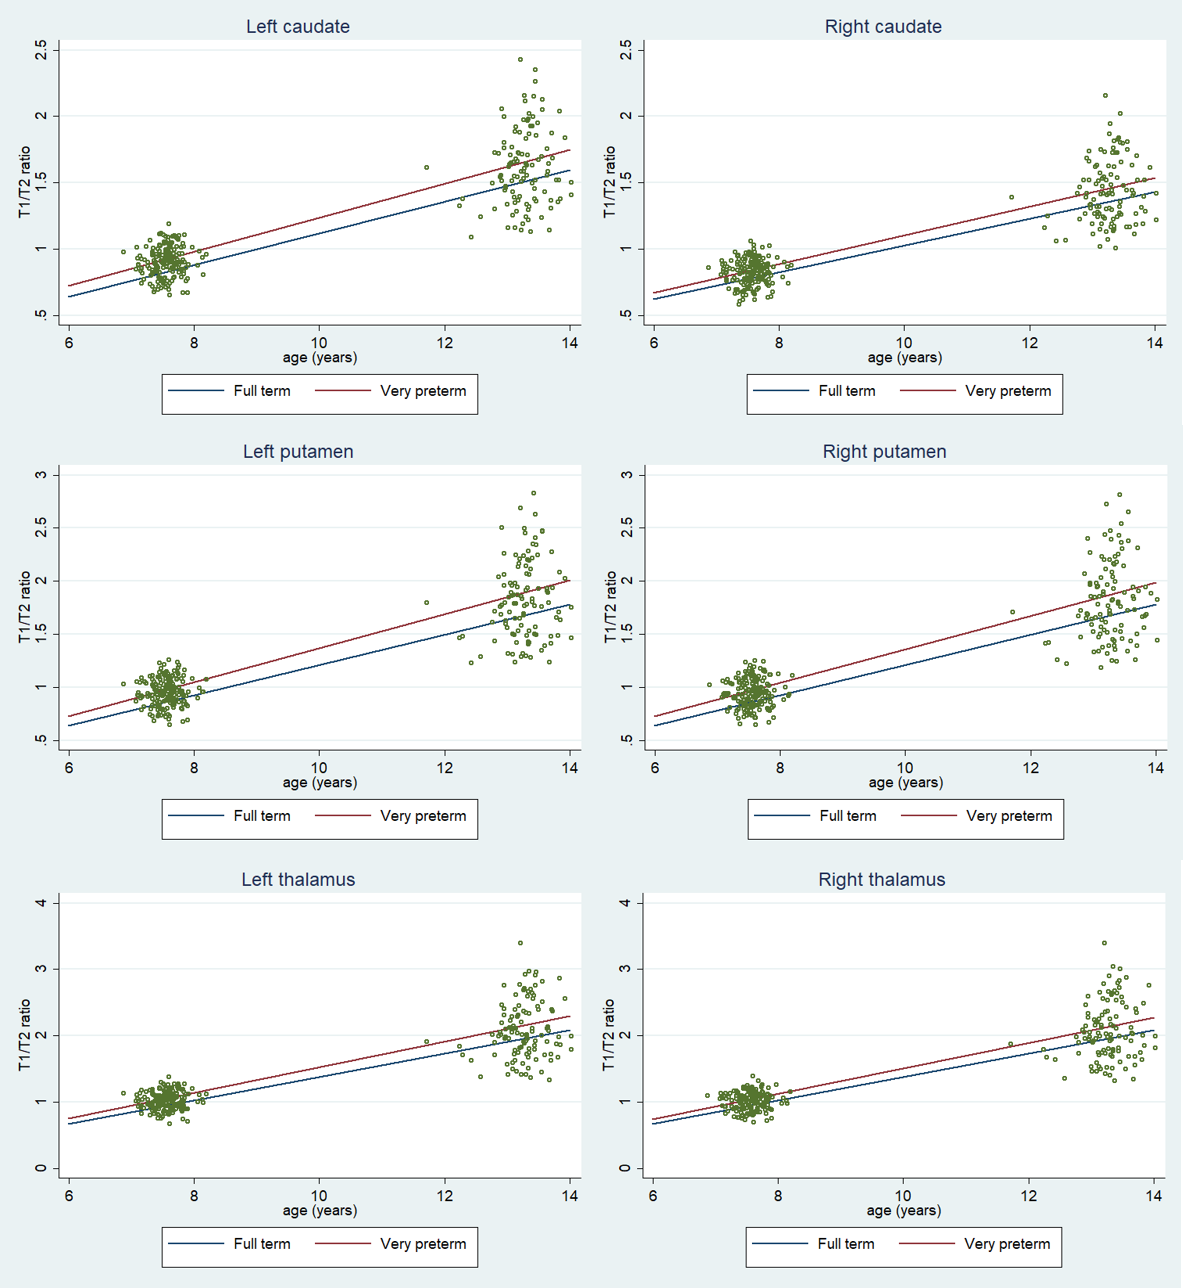
Table 1 summarizes the sample. At 7 years, almost all WM regions, as well as the caudate, putamen and thalamus, had higher T1/T2 ratio in the VP compared with FT group (Fig. 1). At 13 years, there was little evidence of differences between groups, except a trend for higher T1/T2 ratio in the middle cerebellar peduncle, putamen and caudate in the VP group (Fig. 2). The T1/T2 ratio increased from 7 to 13 years for all brain structures in all children. There was little evidence that trajectories differed between VP and FT groups (Fig. 3 & 4).Discussion
The higher T1/T2 ratio in VP compared with FT children was unexpected considering higher ratios generally represent greater myelin maturity. Possible explanations include compensation of myelination in the VP brain during early childhood, or the higher ratio could reflect other neuropathologies including delayed onset of axonal pruning. Although group differences were stronger at 7 than 13 years of age, the trajectories were similar between groups, and so the relative lack of group differences at 13 years was likely due to smaller sample size and greater variability in the measures at 13 rather than a narrowing of the gap between groups. However, a group difference was still evident for the basal ganglia at 13 years of age, which may reflect maturational differences in these brain regions. Future analyses will involve investigating sex and pubertal influences, and myelin mapping at the neonatal time-point for this cohort, to investigate myelination trajectories prior to 7 years.Conclusion
Myelination increased from 7 to 13 years of age in both VP and FT children. There was evidence that VP children had higher myelin content in most WM and DGM regions at 7 years compared with FT children, and this persisted for the basal ganglia at 13 years of age. This suggests that myelin development in VP children may catch up to that of their FT peers.Acknowledgements
No acknowledgement found.References
1. Volpe JJ, Kinney HC, Jensen FE, Rosenberg PA. The developing oligodendrocyte: key cellular target in brain injury in the premature infant. Int J Dev Neurosci. 2011;29(4):423-440.
2. Glasser MF, Van Essen DC. Mapping human cortical areas in vivo based on myelin content as revealed by T1- and T2-weighted MRI. J Neurosci. 2011;31(32):11597-11616.
3. Ganzetti M, Wenderoth N, Mantini D. Whole brain myelin mapping using T1- and T2-weighted MR imaging data. Front Hum Neurosci. 2014;8:671.
4. Tustison NJ, Avants BB, Cook PA, Zheng Y, Egan A, Yushkevich PA, et al. N4ITK: improved N3 bias correction. IEEE Trans Med Imaging. 2010;29(6):1310-1320.
5. Avants BB, Tustison NJ, Song G, Cook PA, Klein A, Gee JC. A reproducible evaluation of ANTs similarity metric performance in brain image registration. Neuroimage. 2011;54(3):2033-2044.
Figures