1784
Magnetization transfer ratio in cortical gray matter: a longitudinal study.1Institute of Medical Sciences, University of Toronto, Toronto, ON, Canada, 2Rotman Research Institute, University of Toronto, Toronto, ON, Canada, 3The Hospital for Sick Children, University of Toronto, Toronto, ON, Canada, 4Sir Peter Mansfield Imaging Centre, School of Physics and Astronomy, University of Nottingham, Nottingham, United Kingdom, 5Center for Developing Brain, Child Mind Institute, New York, NY, United States, 6Department of Psychiatry, University of Toronto, Toronto, ON, Canada, 7Department of Psychology, University of Toronto, Toronto, ON, Canada
Synopsis
To assess the change in magnetization transfer ratio (MTR) in the human cerebral cortex during adolescence(14 to 19 years of age). We observe an age-related increase in average MTR in both sexes. Inter-regional profiles of MTR measured at a single time-point correlate with gene-expression profiles of CA1 pyramidal cells (membranes of dendritic arbor) but not of oligodendrocytes (myelin). On the other hand, profiles of the MTR change (from 14 to 19 years) correlate with gene-expression profiles of oligodendrocytes, suggesting that the change may be sensitive to intra-cortical myelination.
Introduction:
Adolescence is a period of remarkable change in the structural properties of the cerebral cortex. These include age-related changes in magnetization transfer ratio (MTR), as observed in a recent cross-sectional study.1 MT signals are sensitive to myelin content in white matter; 2 some researchers have extended this interpretation to their findings in cortical gray matter.1,3 But as acknowledged previously, MTR reflects macromolecular density4, with myelin being only one of many macromolecules present in grey matter. Here, we explore the biological underpinning of inter-regional variations in MTR studied both in cross-sectional and longitudinal manner during human adolescence.Methods:
Data acquisition: The study population included a subset of participants from the IMAGEN cohort5 recruited and scanned (3T Philips) at one of the acquisition sites (Nottingham).
Demographics: There were 288 participants at Visit 1 (mean age 14.5 ± 0.3 years, 151 males) and 199 participants at Visit 2 (mean age 19.0 ± 0.62 years, 102 males).
Image processing: MTR was calculated using ‘minccalc’ where MTR = (MToff – MTon)/MToff, following a six-parameter registration via ‘bbregister’ tool to T1w images. T1w images were processed through the FreeSurfer (v6.0.0) segmentation pipeline.6 In order to reduce partial volume effect, MTR values from the middle of the cortex were extracted by mri_segstats --annot, according to the Desikan-Killiany (DK) atlas. Scans were quality controlled.
Analyses: To assess the contribution of different cell types to the variations in MTR values in the cerebral cortex, we used an approach that relates inter-regional variations (profiles) in MR signals to inter-regional variations (profiles) in cell-type specific gene expression across 34 cortical regions of the left hemisphere.7 This analysis was conducted cross-sectionally (Visit 1 and Visit 2) and longitudinally (change between Visits 1 and 2, using a mixed effect model) in each sex separately. Gene Ontology (GO) enrichment analysis was conducted for the cell-types associated with MTR, as described previously.7
Results:
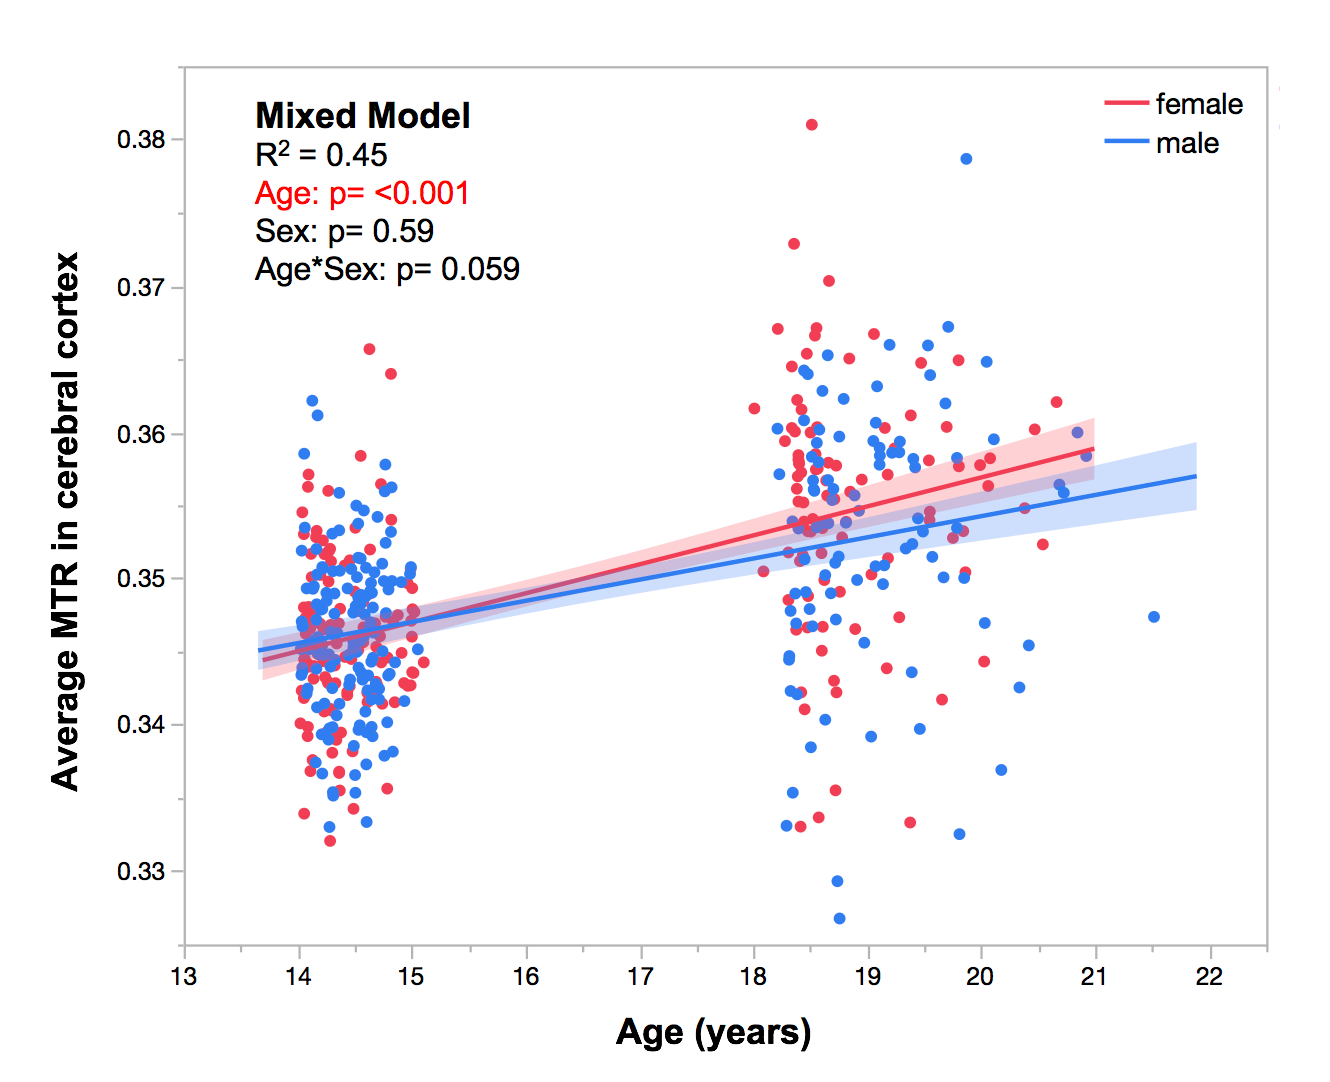
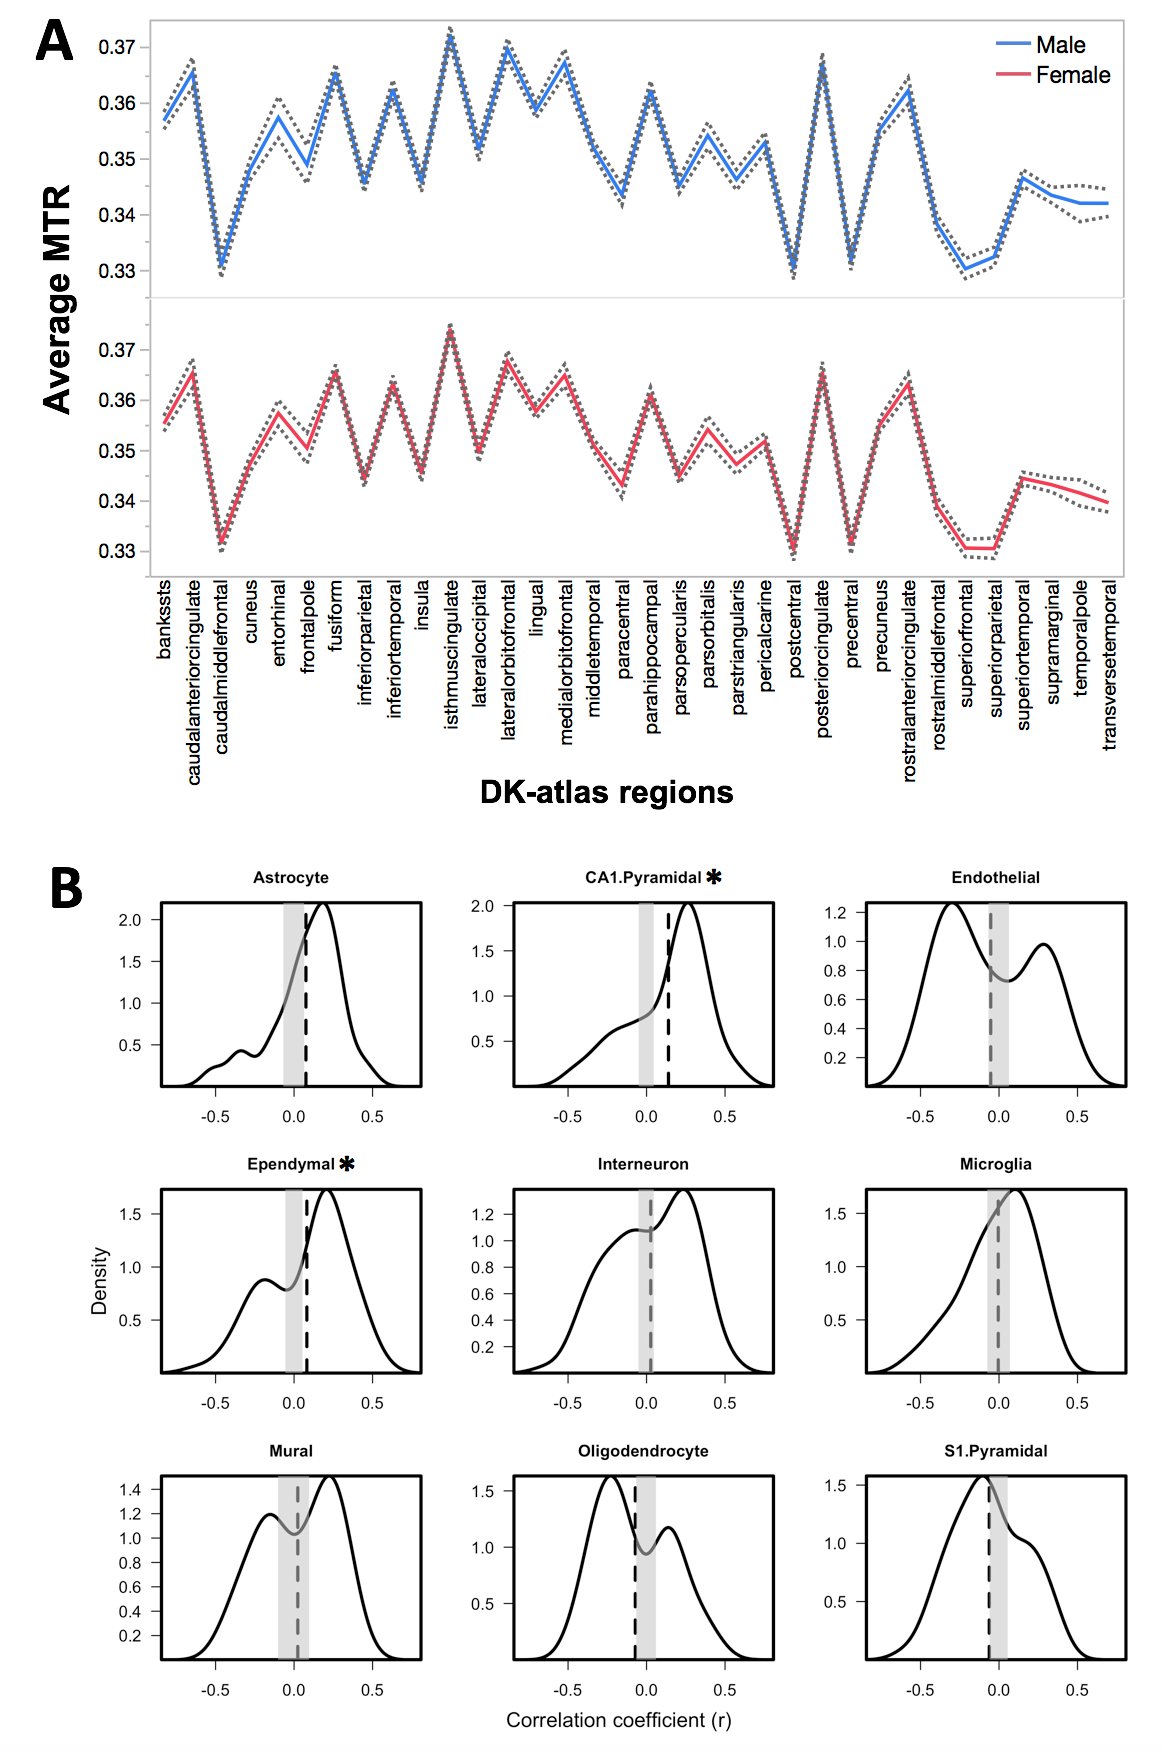
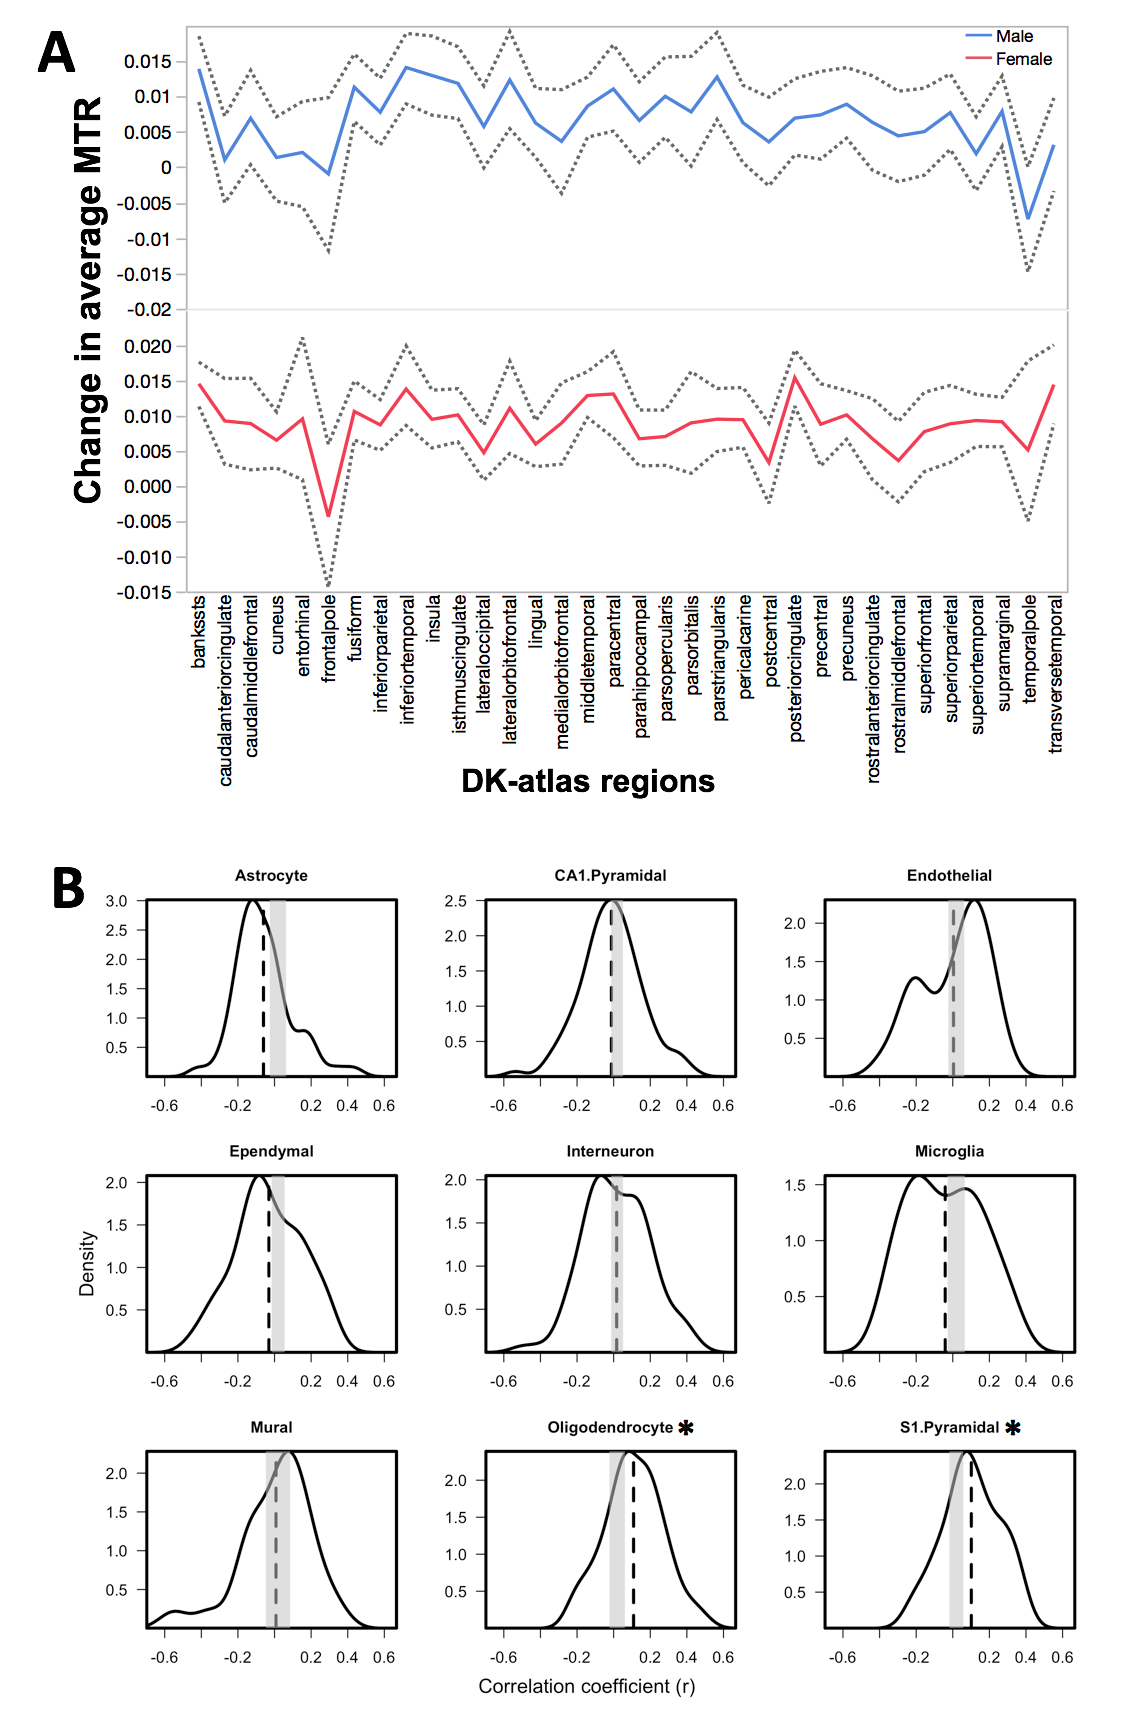
We observed an effect of age (p < 0.001) on average MTR in the left cerebral cortex during adolescence (Figure 1). Cross-sectionally, regional MTR profiles at Visit 1 and Visit 2 (in both sexes) show significant associations with gene-expression profiles of CA1 pyramidal and ependymal cells (Figure 2); this is not the case for any other cell types (including oligodendrocytes). GO analysis of CA1 pyramidal genes and ependymal genes identify dendritic branching and cilia, respectively, as key biological processes. Longitudinally, change in MTR profiles show significant associations with gene-expression profiles of oligodendrocytes and S1 pyramidal cells (the latter in males only, Figure 3). GO analysis of oligodendrocyte genes and S1 pyramidal genes identify myelination and potassium channel activity, respectively, as important biological processes in these cell-type specific gene sets.Discussion:
Cross-sectional MTR profiles at Visit 1 and Visit 2 do not appear to be related to gene-expression profiles of oligodendrocytes, suggesting that MTR measured at a single time point is not sensitive to inter-individual differences in intra-cortical myelination. On the other hand, CA1 pyramidal genes correlate with MTR profile, and GO analysis suggests that dendritic branching may be an important biological process associated with these genes. Dendrites contribute 80-90% of the total surface area of a cortical neuron.8 Greater dendritic branching may drive MTR values as high surface area of cellular membranes relates likely to high energy transfer from the bound pool of protons (found on lipids in cell membranes) to the free pool of protons (extracellular water). Primary cilium (GO enriched process in ependymal-gene set) are critical for dendritic arborization in cortical neurons.9 This may explain the observed association of cilia-related genes and MTR profiles.
Longitudinally, the observed association between profiles of MTR change and those of oligodendrocyte-specific gene expression supports myelin-based interpretation of this developmental process. We speculate that, in cross-sectional analyses, this oligodendrocyte-related (myelin) signal is masked by other sources of macromolecule-bound water, namely extensive membrane surfaces of the dendritic arbor. Furthermore, the association of the MTR-change profile with expression profile of S1 pyramidal cells (a gene set enriched for neural activity related mechanisms) raises the possibility that neural activity of cortical neurons stimulates oligodendrocyte-activity and, in turn, influences developmental change in MTR values.10
Conclusion:
Average MTR values in the cerebral cortex increase with age during adolescence in both sexes. In cross-sectional data, MTR appears to be driven by macromolecules in cellular membranes of the dendritic arbor rather than levels of intra-cortical myelination. On the other hand, in longitudinal data, change in MTR is likely influenced by further increases in intra-cortical myelination, possibly driven by neural activity, during adolescent development.Acknowledgements
This work received support from the following sources: the European Union-funded FP6 Integrated Project IMAGEN (Reinforcement-related behaviour in normal brain function and psychopathology) (LSHM-CT- 2007-037286), the Horizon 2020 funded ERC Advanced Grant ‘STRATIFY’ (Brain network based stratification of reinforcement-related disorders) (695313), ERANID (Understanding the Interplay between Cultural, Biological and Subjective Factors in Drug Use Pathways) (PR-ST-0416-10004), BRIDGET (JPND: BRain Imaging, cognition Dementia and next generation GEnomics) (MR/N027558/1), the FP7 projects IMAGEMEND(602450; IMAging GEnetics for MENtal Disorders) and MATRICS (603016), the Innovative Medicine Initiative Project EU-AIMS (115300-2), the Medical Research Council Grant 'c-VEDA’ (Consortium on Vulnerability to Externalizing Disorders and Addictions) (MR/N000390/1), the Swedish Research Council FORMAS, the Medical Research Council, the National Institute for Health Research (NIHR) Biomedical Research Centre at South London and Maudsley NHS Foundation Trust and King’s College London, the Bundesministeriumfür Bildung und Forschung (BMBF grants 01GS08152; 01EV0711; eMED SysAlc01ZX1311A; Forschungsnetz AERIAL), the Deutsche Forschungsgemeinschaft (DFG grants SM 80/7-1, SM 80/7-2, SFB 940/1). Further support was provided by grants from: ANR (project AF12-NEUR0008-01 - WM2NA, and ANR-12-SAMA-0004), the Fondation de France, the Fondation pour la Recherche Médicale, the Mission Interministérielle de Lutte-contre-les-Drogues-et-les-Conduites-Addictives (MILDECA), the Assistance-Publique-Hôpitaux-de-Paris and INSERM (interface grant), Paris Sud University IDEX 2012; the National Institutes of Health, Science Foundation Ireland (16/ERCD/3797), U.S.A. (Axon, Testosterone and Mental Health during Adolescence; RO1 MH085772), and by NIH Consortium grant U54 EB020403, supported by a cross-NIH alliance that funds Big Data to Knowledge Centres of Excellence.References
- Whitaker KJ, Vértes PE, Romero-Garcia R, Váša F, Moutoussis M, Prabhu G, Weiskopf N, Callaghan MF, Wagstyl K, Rittman T, Tait R. Adolescence is associated with genomically patterned consolidation of the hubs of the human brain connectome. Proceedings of the National Academy of Sciences. 2016 Aug 9;113(32):9105-10.
- Schmierer K, Scaravilli F, Altmann DR, Barker GJ, Miller DH. Magnetization transfer ratio and myelin in postmortem multiple sclerosis brain. Annals of neurology. 2004 Sep 1;56(3):407-15.
- Mangeat G, Govindarajan ST, Mainero C, Cohen-Adad J. Multivariate combination of magnetization transfer, T 2* and B0 orientation to study the myelo-architecture of the in vivo human cortex. NeuroImage. 2015 Oct 1;119:89-102.
- Tofts,P.S., Steens,S.C.A., van Buchem,M.A. (2003). MT: magnetization transfer. Chapter 8 in Tofts,P.S. (ed.) Quantitative MRI of the brain: measuring changes caused by disease. Chichester: John Wiley, 257-298. ISBN: 0-470-84721-2
- Schumann G, Loth E, Banaschewski T, Barbot A, Barker G, Büchel C, Conrod PJ, Dalley JW, Flor H, Gallinat J, Garavan H. The IMAGEN study: reinforcement-related behaviour in normal brain function and psychopathology. Molecular psychiatry. 2010 Dec 1;15(12):1128-39.
- Fischl B. FreeSurfer. Neuroimage. 2012 Aug 15;62(2):774-81.
- Shin J, French L, Xu T, Leonard G, Perron M, Pike GB, Richer L, Veillette S, Pausova Z, Paus T. Cell-Specific Gene-Expression Profiles and Cortical Thickness in the Human Brain. Cerebral Cortex. 2017 Aug 9:1-1.
- Aitken JT, Bridger JE. Neuron size and neuron population density in the lumbosacral region of the cat's spinal cord. Journal of anatomy. 1961 Jan;95(Pt 1):38.
- Guadiana SM, Semple-Rowland S, Daroszewski D, Madorsky I, Breunig JJ, Mykytyn K, Sarkisian MR. Arborization of dendrites by developing neocortical neurons is dependent on primary cilia and type 3 adenylyl cyclase. Journal of Neuroscience. 2013 Feb 6;33(6):2626-38.
- Stevens B, Porta S, Haak LL, Gallo V, Fields RD. Adenosine: a neuron-glial transmitter promoting myelination in the CNS in response to action potentials. Neuron. 2002 Dec 5;36(5):855-68.
Figures