1782
New microstructural asymmetries in the brain1Diagnostic Imaging, St Jude Children's Research Hospital, Memphis, TN, United States, 2Biostatistics, St Jude Children's Research Hospital, Memphis, TN, United States
Synopsis
Brain microstructural asymmetry can provide more direct causal explanations of functional lateralization than can macrostructural asymmetry. In this study, we discovered two new types of microstructural asymmetry that help to bridge the gap between macrostructural asymmetry and functional lateralization. Myelin-related asymmetry was prominent in the back brain, and axon-related asymmetry occurred in both the front brain and the back brain. These asymmetries early in development indicate that white matter is more mature and more myelinated in the left back brain, providing an explanation for the leftward lateralization of language and visual functions. The asymmetries continue to increase throughout childhood and adolescence.
Introduction
Structural asymmetry play important roles in functional lateralization in the brain1. Functional lateralization, such as the production of speech in the left brain, right ear auditory advantage, and right visual field advantage2-4, have been widely studied. Lateralized functions all require physical substrates. Therefore, studying structural asymmetry is critical to understanding how the human brain functions. Structural asymmetry includes macrostructural and microstructural asymmetry. Microstructural asymmetry in a molecular level may bridge the gap between macrostructural asymmetry and functional lateralization in the brain. Diffusion tensor imaging (DTI) can be used to examine in vivo microstructural changes in the brain5 and could be an excellent tool for studying microstructural asymmetry.Methods
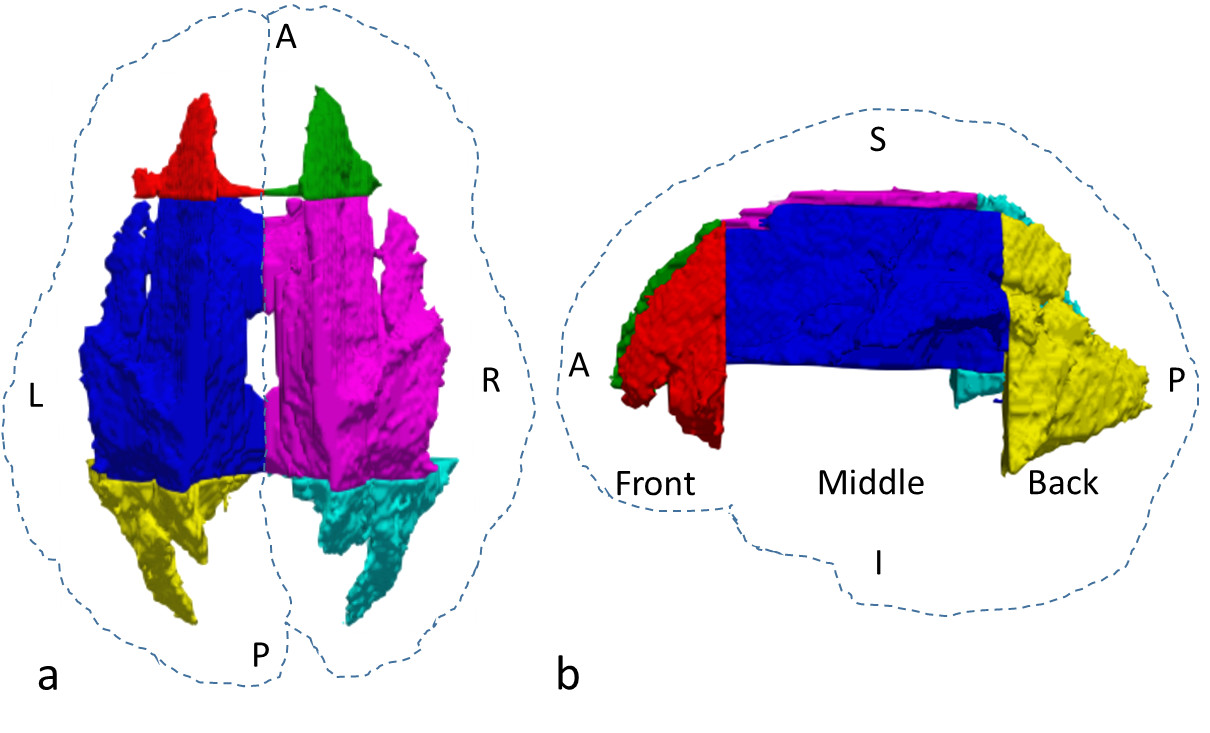
We evaluated microstructural asymmetry in 92 volunteers (54 male and 38 female subjects aged 6 to 25 years). DTI was performed using a SE-EPI sequence with 12 directions. The DTI protocol parameters were as follows: TR = 6500 ms; TE = 120 ms; b = 0, 700 s/mm2; 3-mm slice thickness; 40 axial slices; in-plane resolution of 1.5 × 1.5 × 3.0 mm. T1w images were acquired with an in-plane resolution of 0.82 × 0.82 mm. DTI images were first registered to T1w images then further registered to the MNI 152 atlas using FSL. A mask was created based on the 90% white matter atlas6, which was further eroded manually to minimize potential issues with misregistration. The white matter on the left and right sides was parcellated into three regions: front, middle, and back as shown in Fig. 17.
The asymmetry index (AI) parameter was calculated using the following equation: $$AI = (P_L - P_R)/C $$
where $$$P_L$$$ is the averaged DTI parameter on the left side, $$$P_R$$$ is the averaged DTI parameter on the right side, and $$$C$$$ is the normalization constant, which is equal to 1.0 × 10⁻³ mm2/s for Axial diffusivity (AD), MD, and radial diffusivity (RD), and to 1.0 for FA. DTI parameters as functions of age were fitted using a logarithmic function ($$$ y= A\cdot log(x)+B$$$ ) to show the trend as age increased.
Results
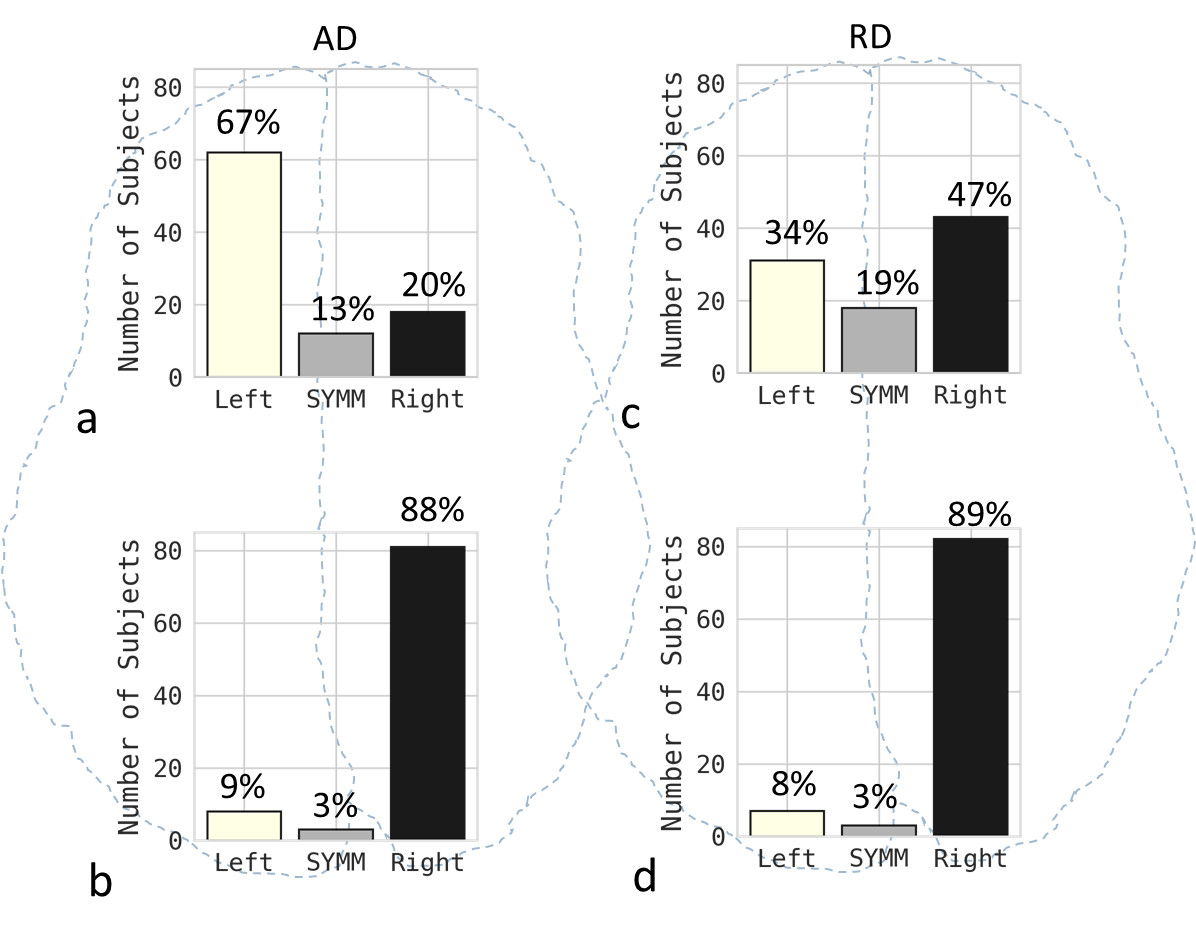
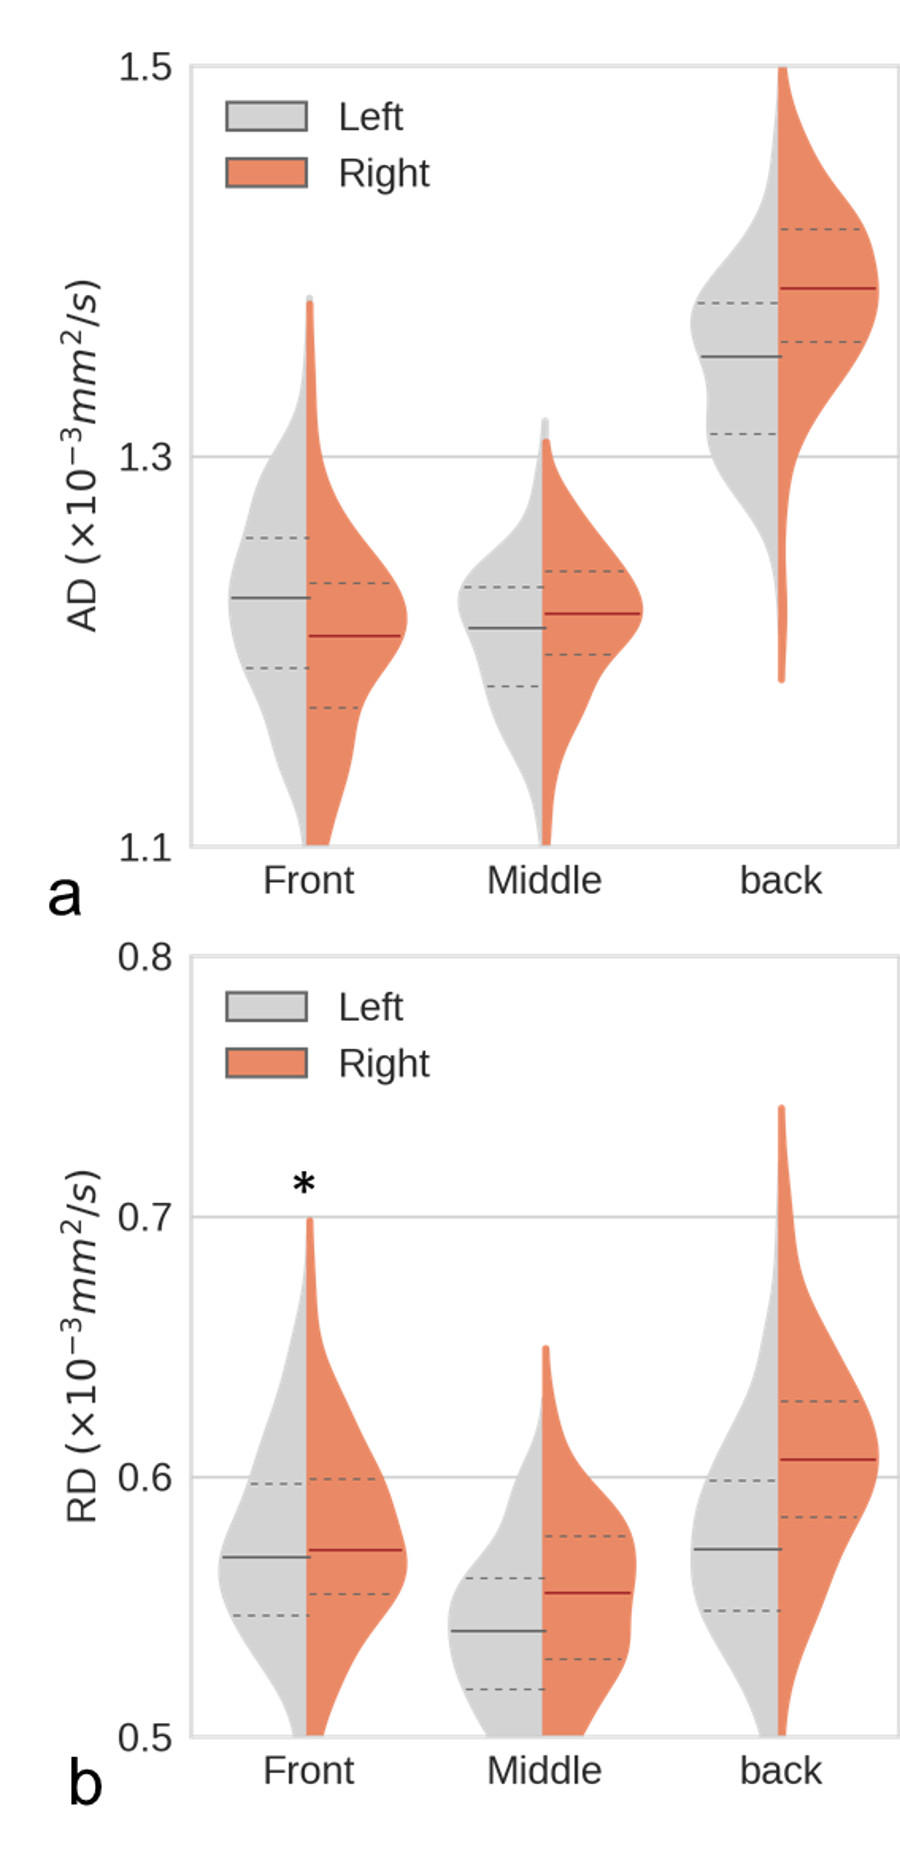
We present only the results for AD and RD here, since FA and MD have limited sensitivity and specificity. AD and RD can differentiate axonal and myelin injuries, respectively8. In healthy young subjects, the smaller AD values indicate the presence of more mature axons, whereas the smaller RD values indicate thicker myelination9. Therefore, AD asymmetry is referred to as axon asymmetry and RD asymmetry is referred to as myelin asymmetry. The percentage of subjects with a larger left-side AD in the front brain (67%) was dramatically greater than the percentage with a larger right-side AD (20%) (Fig. 2a). The asymmetry was reversed in the back brain (Fig. 2b). In Fig. 3a, the median AD value was significantly larger in the left front brain than in the right front brain but significantly larger in the right back brain than in the left back brain, indicating that the axon asymmetry was inversed from front to back. In contrast, there was a substantial difference in RD between the left and right back brain and a smaller difference in front brain (Fig. 2 c, d and Fig. 3 b), indicating that myelin asymmetry in the back brain is more distinct than that in the front brain. The front brain had leftward axon asymmetry with a positive AI for AD, whereas the back brain had rightward axon asymmetry with a negative AI for AD (Fig. 4a). Axon asymmetry in the back brain became more rightward with increasing age. The back brain had rightward myelin asymmetry with a negative AI for RD, and this became increasingly rightward (Fig. 4b).Discussion / Conclusion
We have shown that the front brain displays axon asymmetry, whereas the back brain displays axon and myelin asymmetry, which are consistent with macrostructural asymmetries in previous studies1. White matter in the left back brain was more mature and myelinated than that in the right back brain. Because more mature and myelinated white matter makes axonal signal transmission faster10, the left back brain is more appropriate for processing faster visual and auditory signals, which is consistent with the auditory and visual functional asymmetries in previous studies3,11. Microstructural asymmetries increase with age, which is consistent with the development of functional lateralization in the brain12. In conclusion, we have found that there are microstructural axon and myelin asymmetries in the front and back brain. These microstructural asymmetries become more prominent as the brain continues to develop.Acknowledgements
We thank Keith A. Laycock for editorial assistance. This work was supported by RO1 CA90246 and Cancer Center Support Grant P30 CA-21765 from the National Cancer Institute, National institutes of Health, Bethesda, MD, and by the American Lebanese Syrian Associated Charities (ALSAC), Memphis, TN.References
1. Toga, A. W. & Thompson, P. M. Mapping brain asymmetry. Nat. Rev. Neurosci. 4, 37–48, (2003).
2. Gazzaniga, M. S. Cerebral specialization and interhemispheric communication—does the corpus callosum enable the human condition? Brain 123, 1293–1326 (2000).
3. Zatorre, R. J., Belin, P. & Penhune, V. B. Structure and function of auditory cortex: music and speech. Trends Cogn. Sci. 6, 37–46 (2002).
4. Verma, A. & Brysbaert, M. A right visual field advantage for tool-recognition in the visual half-field paradigm. Neuropsychologia 49, 2342–2348 (2011).
5. Le Bihan, D. Looking into the functional architecture of the brain with diffusion MRI. Nat. Rev. Neurosci .4, 469–480 (2003).
6. Oishi, K. et al. Human brain white matter atlas: identification and assignment of common anatomical structures in superficial white matter. Neuroimage 43, 447–457 (2008).
7. Reiss, A. L., Abrams, M. T., Singer, H. S., Ross, J. L. & Denckla, M. B. Brain development, gender and IQ in children. Brain 119, 1763–1774 (1996).
8. Zhang, J., Aggarwal, M. & Mori, S. Structural insights into the rodent CNS via diffusion tensor imaging. Trends Neurosci. 35, 412–421 (2012).
9. Lebel, C., Walker, L., Leemans, A., Phillips, L. & Beaulieu, C. Microstructural maturation of the human brain from childhood to adulthood. Neuroimage 40, 1044–1055 (2008).
10. LaMantia, A. S. & Rakic, P. Axon overproduction and elimination in the corpus callosum of the developing rhesus monkey. J. Neurosci. 10, 2156–2175 (1990).
11. Kingstone, A., Enns, J. T., Mangun, G. R. & Gazzaniga, M. S. Guided visual search is a left-hemisphere process in split-brain patients. Psychol. Sci. 6, 118–121 (1995).
12. Bishop, D. V. M. Cerebral asymmetry and language development: cause, correlate, or consequence? Science 340, 1230531 (2013).
Figures