1781
Anisotropic similarity, a constrained affine transformation: application to brain development analysis1Univ Rennes, INRIA, CNRS, INSERM, IRISA UMR 6074, VISAGES ERL U-1228, F-35000, Rennes, France, 2IMT Atlantique, LaTIM U1101 INSERM, UBL, Brest, France
Synopsis
The study of brain development provides insights in the normal trend of brain evolution and enables early detection of abnormalities. We propose a method to quantify brain growth in three arbitrary orthogonal directions of the brain through linear registration. We introduce a 9 degrees of freedom transformation that gives the opportunity to extract scaling factors describing brain growth along those directions by registering a database of subjects in a common basis. We apply this framework to create a longitudinal curve of scaling ratios along fixed orthogonal directions from 0 to 16 years highlighting anisotropic brain development.
Introduction
In pediatric image analysis, the study of brain development provides insights in the normal trend of brain evolution and enables early detection of abnormalities. Tools like longitudinal atlases 1,2 allow to compute statistics on populations, understand brain variability at different ages to highlight changes in growth, shape, structure etc.
We propose a method to quantify brain growth in three arbitrary orthogonal directions of the brain through linear registration. We introduce a 9 degrees of freedom (dof) transformation called anisotropic similarity that is an affine transformation with constrained scaling directions along chosen orthogonal vectors. This gives the opportunity to extract relative scaling factors describing brain growth along those directions by registering a database of subjects in a common basis. We apply this framework to create a longitudinal curve of scaling ratios along fixed orthogonal directions from 0 to 16 years highlighting anisotropic brain development.
Methods
In geometry, an affine transformation is a composition of a translation $$$t$$$ and a linear map $$$A$$$ operating on coordinates: $$$y=Ax+t$$$.
Using a particular singular value decomposition on the linear part $$$A$$$, we obtain:
$$A=RSU^T$$
Where $$$U$$$ and $$$R$$$ are matrices of the special orthogonal group and $$$S$$$ is a diagonal matrix.
In a 3D space, an affine transformations has 12 dof. They can be decomposed as:
- a rotation (3 dof): $$$U^T$$$ determines scaling directions.
- an anisotropic scaling (3 dof): $$$S$$$.
- a rotation (3 dof): matrix $$$R$$$
- a translation (3 dof): vector $$$t$$$.
We define an anisotropic similarity by fixing the $$$U$$$ matrix column vectors such as they form an externally determined 3D orthonormal basis on which the scalings are applied.
In most linear registration algorithms based on local similarities, including block-matching 3,4 , the only step differing over the type of transformation is the estimation of the optimal global transformation from two sets of paired points. This often relies on finding the transformation minimizing the weighted sum of squared differences between those paired points. We developed a method to estimate the optimal anisotropic similarity.
Optimization:
Let $$$x=(x_1,\dots,x_N)$$$ and $$$y=(y_1,\dots,y_N)$$$ be two matrices containing (in column) the coordinates of $$$N$$$ paired points.
Let $$$\bar{x}=\frac{1}{N}\sum_i^Nx_i$$$ and $$$\bar{y}=\frac{1}{N}\sum_i^Ny_i$$$.
Let $$$x_i'=x_i-\bar{x}$$$ and $$$y_i'=y_i-\bar{y}\hspace{1cm}i=1,\dots,N$$$.
The goal is to minimize the following least squares criterion:
$$C(R,S,t)=\sum_i\left\|y_i-(RSU^Tx_i+t)\right\|^2$$
Where $$$U$$$ is fixed.
Translation part:
For any transformation with linear part $$$A$$$ and translational part $$$t$$$, the least squares problem associated with the matching of $$$x$$$ and $$$y$$$ consists in the minimization of the following criterion: $$$C(A,t)=\sum_i\left\|y_i-(Ax_i+t)\right\|^2$$$.
The optimal translation part can be obtained from the optimal linear part $$$\hat{A}$$$ and the barycenters of the two sets of points as:
$$\hat{t}=\bar{y}-\hat{A}\bar{x}$$
Linear part:
Let $$$\tilde{x} = U^T x$$$ and $$$\xi = S \tilde{x}$$$. $$$R$$$ can be expressed using the associated quaternion $$$q$$$ such that $$$R\xi_i=q*\xi_i*\bar{q}$$$ and matricial quaternions $$$Q_{y'_i}$$$ and $$$P_{\xi_i}$$$ such that $$$y'_i*q=Q_{y'_i}q$$$ and $$$-q*\xi_i=-P^T_{\xi_i}q=P_{\xi_i}q$$$ 3 :
\begin{align*}\tilde{C}(S,q)&= \sum_i||y'_i-q*\xi_i*\bar{q}||^2\\
&= - q^T\left(-\sum_i(Q_{y'_i}+P_{\xi_i})^2\right)q\end{align*}
For further computation, we denote $$$Z_i =(Q_{y'_i}+P_{\xi_i})^2$$$ and $$$Z=\sum_iZ_i$$$.
Separating the problem between $$$S$$$ and $$$q$$$ leads to an alternate optimization scheme, each step having an analytical solution:
- For a fixed value of $$$S$$$, estimate optimal rotation quaternion $$$\hat{q}$$$ as the eigenvector with the smallest eigenvalue of $$$Z$$$
- For a fixed value of $$$q$$$, estimate the optimal scaling matrix $$$\hat{S}=Diag(\hat{s}_1,\hat{s}_2,\hat{s}_3)$$$ following:
$$\frac{\partial\tilde{C}}{\partial s_j}=0\Leftrightarrow\hat{s}_j=\frac{1}{\sum_i\tilde{x}_{ji}^2}q^T\left( \sum_iQ_{y'_i}\frac{\partial P_{\xi_i}}{\partial s_j}\right)q $$
Results
144 subjects between $$$0$$$ and $$$16$$$ years old from:
- ASLpedia a : retrospective ASL study on routine pediatric MRI on 6 month to 16 years subjects (92)
- C-MIND b : subjects chosen in 0-1 years range (12)
- Developing Human Connectome Project c (40)
have been registered onto an atlas constituted of all those images using an anisotropic similarity (figure 1). We chose the direction matrix $$$U$$$ defined earlier such that one column vector is orthogonal to the mid-sagittal plane 6 for symmetry reasons. The others correspond to the principal directions of the voxel coordinates projected onto this plane. Then, we extracted the scaling ratios of the moving images over the reference one along those directions and used it to plot curves representing a growth model over time (figures 2 and 3).
Discussion
The choice of the direction matrix $$$U$$$ is crucial. If our decision to pick a vector orthogonal to the mid-sagittal plane seems justified due to symmetry reasons, the selection of the other two are more debatable since they are based on purely geometric features ignoring iconic criterions.Conclusion
We proposed a method to extract scaling factors allowing the quantification of anisotropic brain development. We have shown the relevance of this approach on the analysis of the growth model created form 144 pediatric subjects covering 0 to 16 years.Acknowledgements
The research leading to these results has received funding from the ANR MAIA project, grant ANR-15-CE23-0009 of the French National Research Agency
a. Performed at Rennes Sud (France) hospital pediatric radiology department.
b. C-MIND Data Repository created by the C-MIND study of Normal Brain
Development. This is a multisite, longitudinal study of typically
developing children from ages newborn through young adulthood conducted
by Cincinnati Children’s Hospital Medical Center and UCLA and supported
by the National Institute of Child Health and Human Development
(Contract #s HHSN275200900018C). A listing of the participating sites
and a complete listing of the study investigators can be found at:
https://cmind.research.cchmc.org/
c. The Developing Human Connectome Project (dHCP), is a highly collaborative, €15 million project led by King’s College London, ImperialCollege London and Oxford University.
http://www.developingconnectome.org
References
1. Ahmed Serag, Paul Aljabar, Gareth Ball, Serena J. Counsell,James P. Boardman, Mary A. Rutherford, A. DavidEdwards, Joseph V. Hajnal, and Daniel Rueckert, “Constructionof a consistent high-definition spatio-temporalatlas of the developing brain using adaptive kernel regression,”NeuroImage, vol. 59, no. 3, pp. 2255–2265, 2012.
2. Maria Kuklisova-Murgasova, Paul Aljabar, Latha Srinivasan,Serena J. Counsell, Valentina Doria, AhmedSerag, Ioannis S. Gousias, James P. Boardman, Mary A.Rutherford, A. David Edwards, Joseph V. Hajnal, andDaniel Rueckert, A dynamic 4D probabilistic atlas ofthe developing brain, NeuroImage, 2011.
3. Sébastien Ourselin, Alexis Roche, Sylvain Prima, Nicholas Ayache. Block Matching: A General Framework to Improve Robustness of Rigid Registration of Medical Images. DiGioia, A.M. and Delp, S. Third International Conference on Medical Robotics, Imaging And Computer Assisted Surgery (MICCAI 2000), 2000, Pittsburgh, Penn, USA, United States. Springer, 1935, pp.557--566, 2000, Lectures Notes in Computer Science
4. Olivier Commowick, Nicolas Wiest-Daesslé, Sylvain Prima. Block-Matching
Strategies for Rigid Registration of Multimodal Medical Images. 9th IEEE International Symposium on Biomedical Imaging (ISBI'2012), May 2012, Barcelona, Spain. pp.700-703, 2012
5. Berthold K. P. Horn, "Closed-form solution of absolute orientation using unit quaternions," J. Opt. Soc. Am. A 4, 629-642 (1987)
6. Sylvain Prima, Sébastien Ourselin, Nicholas Ayache. Computation of the Mid-Sagittal Plane in 3D Brain Images. IEEE Transactions on Medical Imaging, Institute of Electrical and Electronics Engineers, 2002, 21 (2), pp.122-138.
Figures
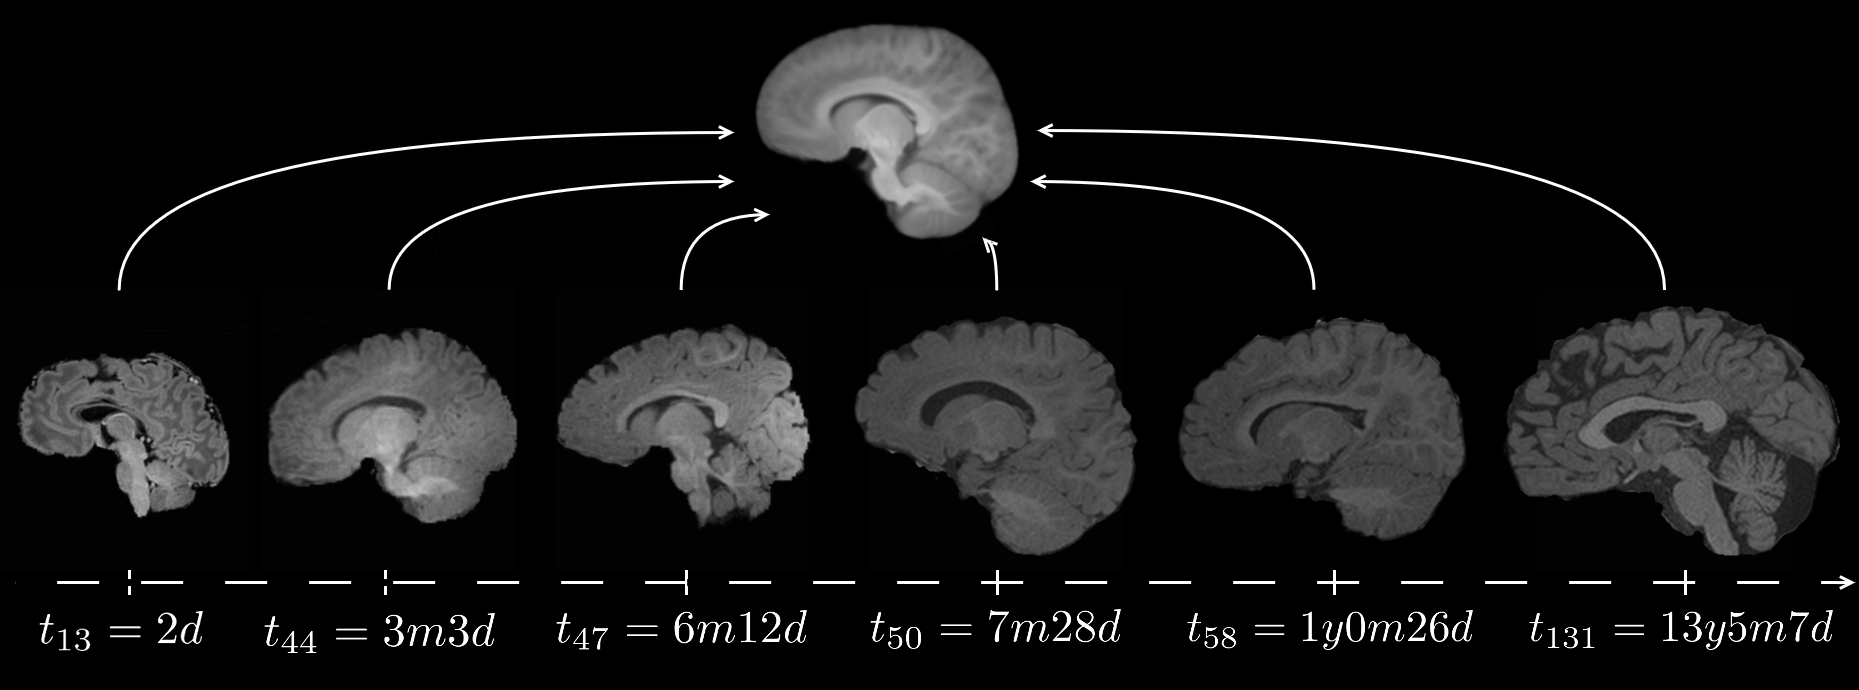
figure 1
All subjects are registered onto a single atlas created from them using an anisotropic similarity. The reference image and the imposed scaling directions are common for all those registrations. (y:years, m:months, d:days)
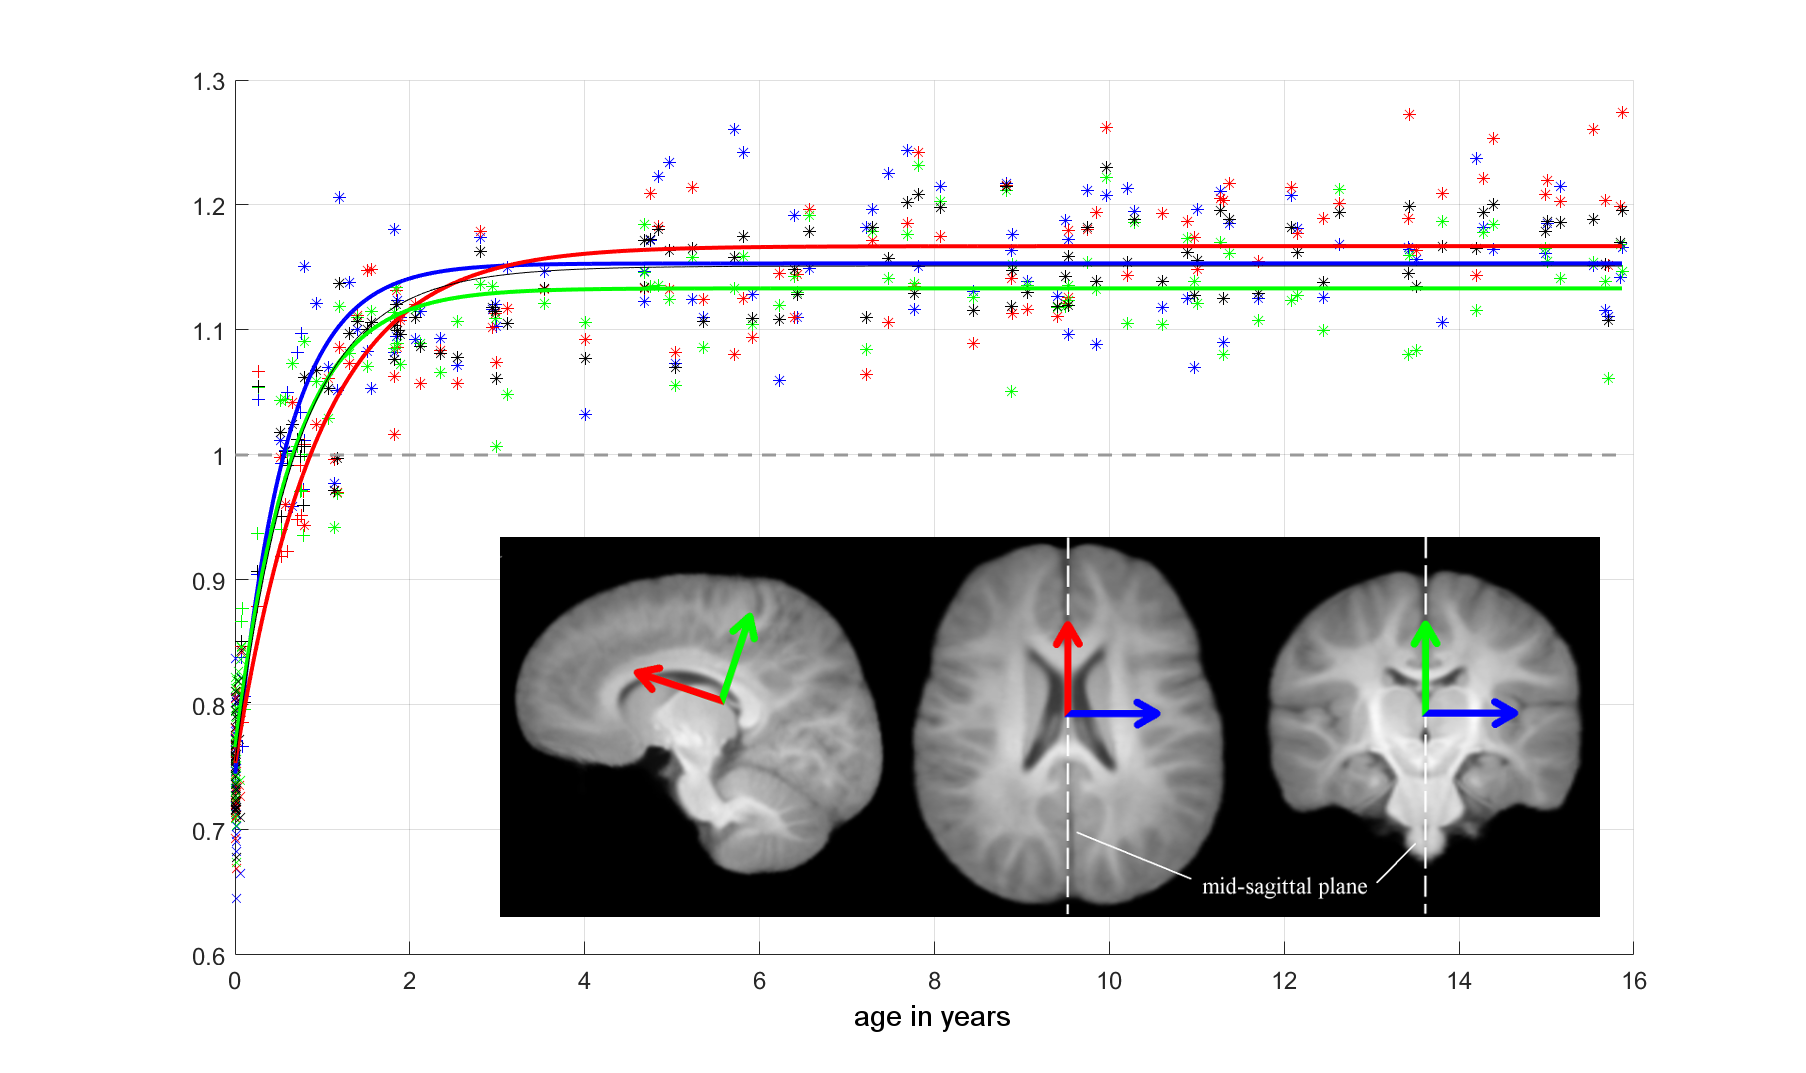
figure 2
Markers ($$$*$$$ ASLpedia, $$$+$$$ C-MIND and $$$\times$$$ Developing Human Connectome Project) represent scaling ratios of moving images over the reference image along the directions depicted on the sketch below it.
Curves fitting those data have been created using least squares regression on parameters of the following function: $$$f(x)=a+b\exp(cx+d)$$$. The black curve represents the overall growth model.
We can observe a growth at different speeds depending on the direction followed by an overall stagnation around 3 years.
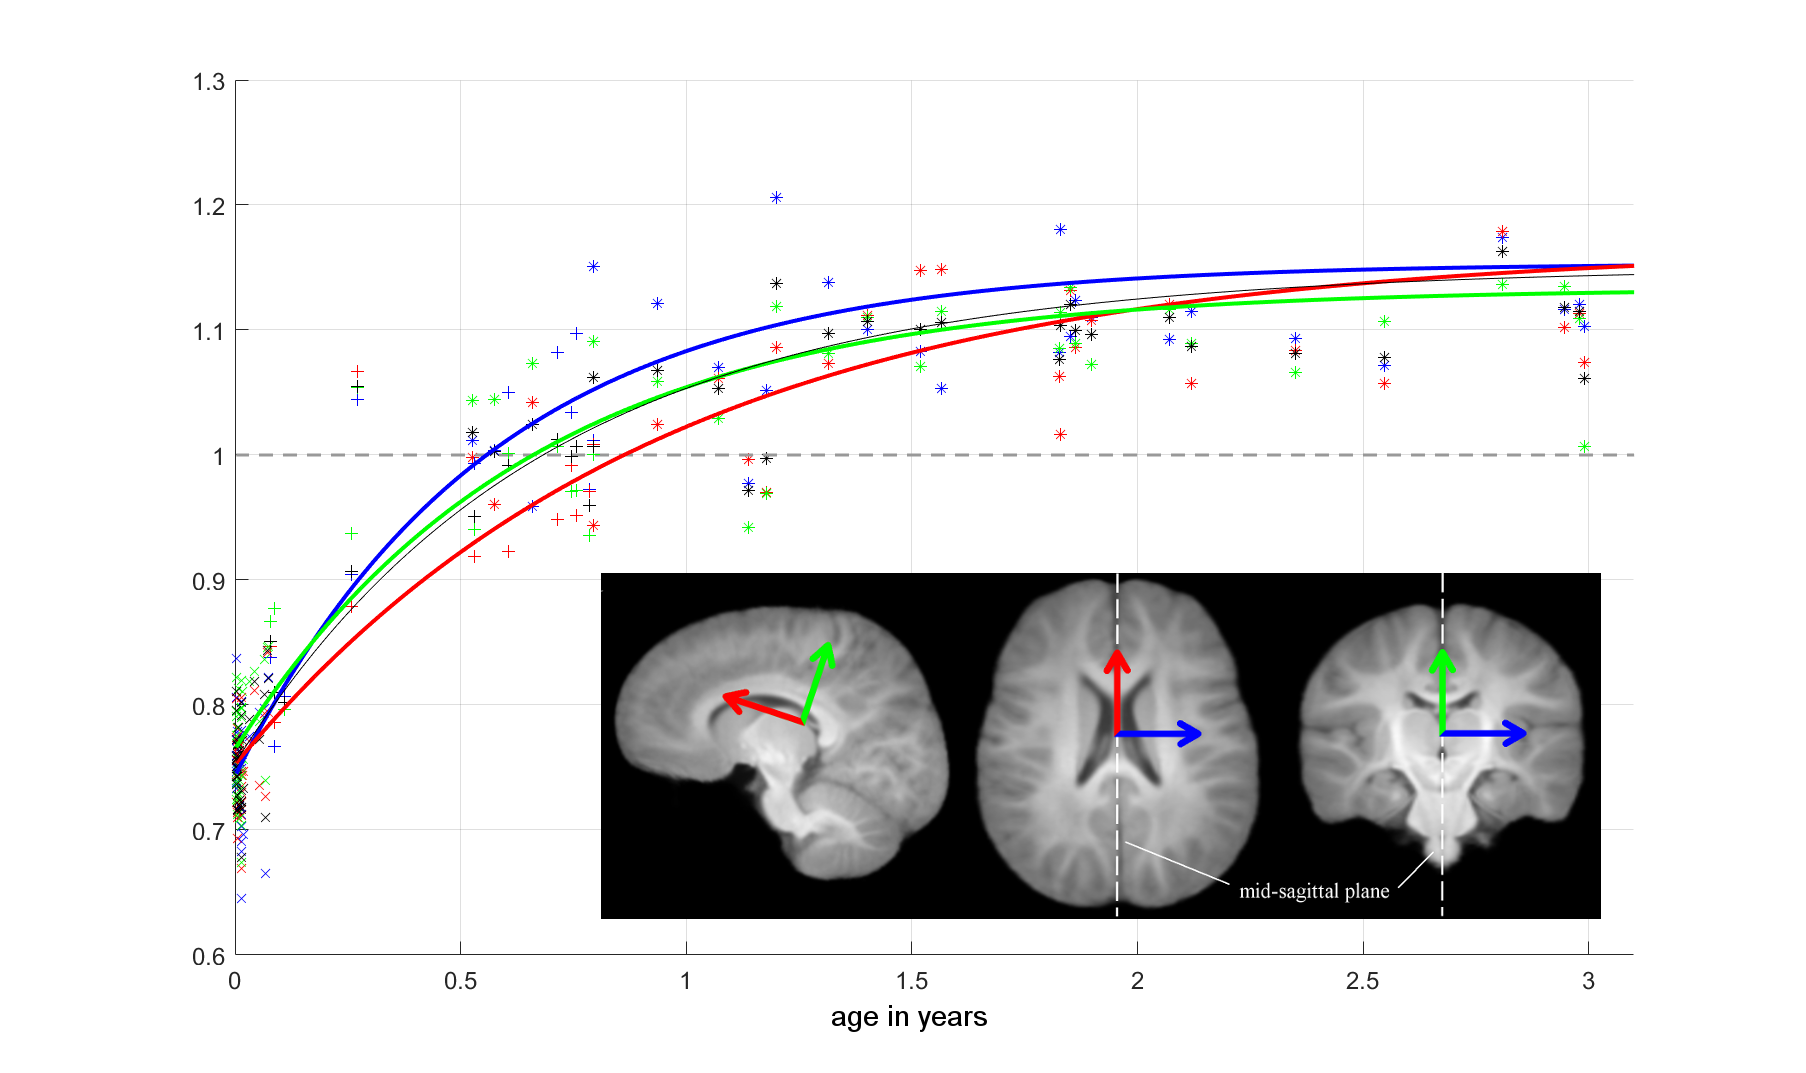
figure 3
A closer look on the 0 to 3 years range.
We can observe the growth speed is not the same along the 3 directions.
The brain grows the slowest along the red direction, stagnation happens way after the others (around 5 years) while it grows the fastest along the blue direction with a stagnation around 2.5 years.
This confirms the observation that very young subjects seem to have a more istropic, spherical brain.