1777
Optimization of phase-contrast MRI for cerebral blood flow quantification in neonates1Johns Hopkins University School of Medicine, Baltimore, MD, United States, 2Siemens Healthineers, Baltimore, MD, United States
Synopsis
Knowledge of CBF in neonates may provide valuable information in many pathological conditions. When applied to very young children, CBF mapping using arterial-spin-labeling (ASL) MRI suffers from low signal-to-noise ratio and poor quantification, whereas phase-contrast (PC) MRI may provide reliable estimation of global CBF. This study aimed to optimize the PC-MRI protocol for future applications in neonates. By comparing the cardiac-gated and non-gated implementations, we found non-gated PC-MRI could provide accurate CBF measurement with shorter scan time. We also found lower imaging resolution would over-estimate CBF, and therefore recommend the use of 0.3mm resolution with 6 averages in neonates.
Introduction
Cerebral blood flow (CBF) provides important hemodynamic information about neonatal brain. Altered CBF has been found in neonatal brain diseases such as hypoxic ischemic injury1, perinatal ischemic stoke2, and congenital heart disease3. However, routine clinical assessment of neonatal CBF is difficult due to a lack of techniques. Recently, arterial spin labeling (ASL) MRI has been used for neonatal CBF assessment1,2. However, current ASL methods, when applied to very young children, suffer from both low SNR and poor quantification. In this regard, phase-contrast (PC) MRI is complementary to ASL in that its pulse sequence is relatively simple and it provides a reliable and quantitative estimation of CBF3-5, though spatial information may be lacking. In the present study, we optimized the PC-MRI technique in neonatal population by comparing the cardiac-gated and non-gated acquisition and comparing different imaging resolutions and number of averages. We aimed to establish a PC-MRI protocol that can provide reliable CBF measurement in neonates.Methods
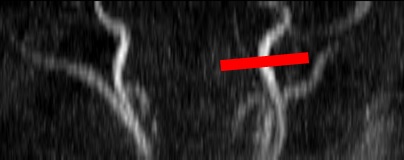
A total of 11 healthy neonates (birth age 38.9±1.3 gestational weeks, 4 girls) were scanned on a 3T system (Siemens MAGNETOM Skyra, Erlangen, Germany) at 1-3 days after birth without sedation. In each neonate, a time-of flight (TOF) MRI angiogram was applied first to visualize the internal carotid arteries (ICA). Using the TOF MIP images, PC-MRI imaging slices were placed on an ICA in each subject at the level of foramen magnum where the feeding arteries enter the brain (Figure 1).
Comparison of cardiac-gated and non-gated PC-MRI
Cardiac-gated and non-gated implementations of PC-MRI were performed in 7 healthy neonates. For both gated and non-gated scans, the following parameters were used: single slice, FoV=90x90mm2, voxel size=0.5x0.5x3.2mm3, TR/TE/FA=23ms/7.38ms/15°, Venc=30cm/s. The non-gated scan resulted in 1 velocity map, with 3 averages and scan duration of 13s. The gated scan resulted in 20 velocity maps at different cardiac phases with scan duration ~2 min depending on subject’s heart rate. For each velocity map, we evaluated the blood flux of the targeted ICA (ROI defined on magnitude image) using the analysis described previously5. Blood flow of the non-gated scans was compared to the mean flow across cardiac cycle of the gated scans.
Optimization of imaging resolution and number of averages
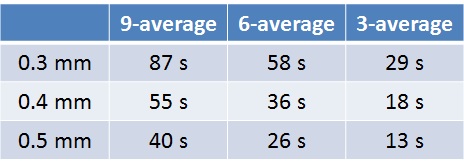
Nine combinations of three in-plane resolutions (0.3, 0.4, and 0.5mm) and three number of averages (3, 6, and 9) were performed on 7 neonates. Other imaging parameters were: FoV=90x90mm2, FA=15°, Venc=30cm/s, non-gated. Scan duration of the nine combinations are shown in Table 1. Blood flow was quantified from each scan. A radiologist, blinded from scan details, rated the image quality of scans.
Results and Discussion
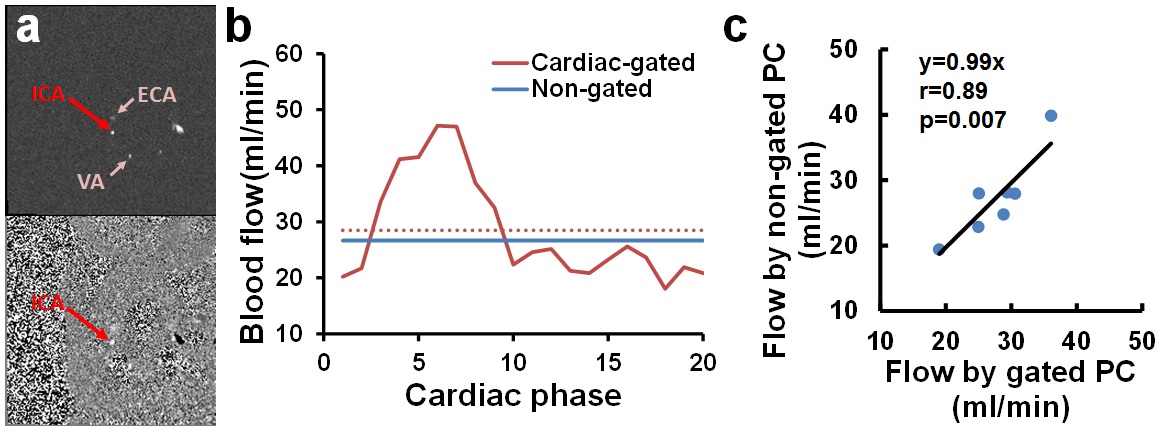
Figure 2a shows an example PC-MRI images from the non-gated scan of one neonate. Unlike in adult scans, no obvious pulsation artifact can be observed in these non-gated images. Figure 2b shows the corresponding blood flow measurement from this neonate. Blood flow varied during a cardiac cycle, but the mean value was close to the non-gated result. Regression analysis of all neonates showed a strong correlation between the gated and non-gated CBF (slope=0.99, r-0.89, p=0.007). Since cardiac-gated PC-MRI is thought to be most accurate in CBF quantification, our result suggested that non-gated PC-MRI may be a time-efficient choice of accurate CBF quantification in neonates.
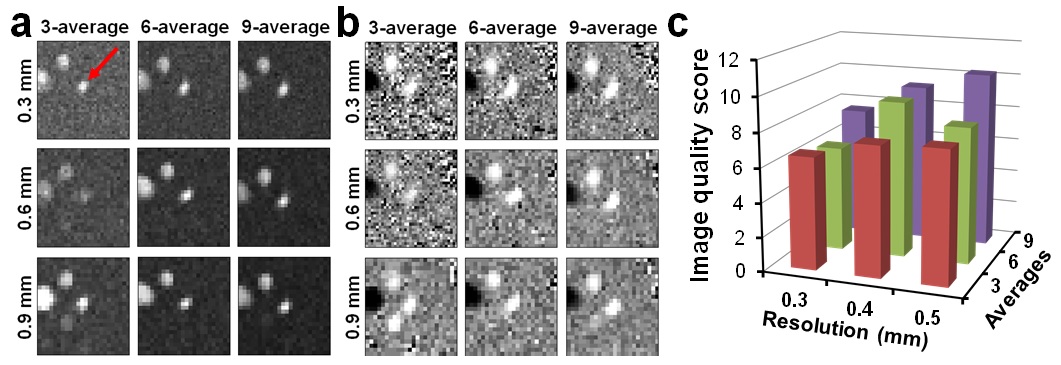
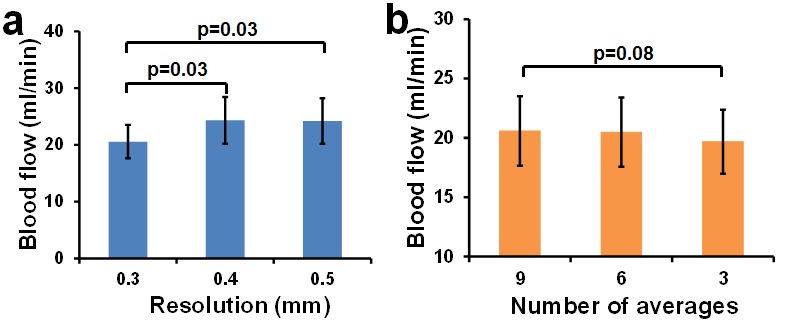
Figure 3 shows the magnitude and velocity maps of the nine resolution/average combinations in one neonate. Visual inspection suggested that larger number of averages yields better SNR. This was also quantitatively supported by the image quality scores (Figure 3c). Therefore, we first focused on the results from 9-average to evaluate the effect of imaging resolution. ANOVA test with repeated measure revealed significant effect of imaging resolution on blood flow (p=0.01). Post-hoc analysis showed that 0.4 and 0.5mm yielded significantly higher CBF than 0.3mm (p=0.03 for both). This over-estimation was due to partial volume effect associated with lower resolution. Next, we focused on the results from 0.3mm resolution and compared different number of averages. ANOVA test showed a trend of difference across the three number of averages (p=0.08). Post-hoc analysis found that 3-average yielded slightly lower CBF (p=0.08) comparing to 9-average, while 6-average showed no difference (p=0.90), suggesting 6-average could be a good balance between measurement accuracy and scan duration.
Conclusion
Non-gated PC-MRI could be a time-efficient way to measure global CBF in neonates. In a non-gated PC-MRI scan, in-plane resolution of 0.3mm and 6 averages should be used in order to obtain accurate CBF quantification in neonatal applications. Additionally, we recommend that PC-MRI be used concomitantly with ASL to provide a normalization of ASL-derived CBF maps to ensure quantification accuracy of ASL in neonates6.Acknowledgements
No acknowledgement found.References
1. Pienaar R, Paldino MJ, Madan N, et al. A quantitative method for correlating observations of decreased apparent diffusion coefficient with elevated cerebral blood perfusion in newborns presenting cerebral ischemic insults. Neuroimage 2012;63:1510-8.
2. De Vis JB, Petersen ET, Kersbergen KJ, et al. Evaluation of perinatal arterial ischemic stroke using noninvasive arterial spin labeling perfusion MRI. Pediatr Res 2013;74:307-13.
3. Jain V, Buckley EM, Licht DJ, et al. Cerebral oxygen metabolism in neonates with congenital heart disease quantified by MRI and optics. J Cereb Blood Flow Metab 2014;34:380-8.
4. Varela M, Groves AM, Arichi T, Hajnal JV. Mean cerebral blood flow measurements using phase contrast MRI in the first year of life. NMR Biomed 2012;25:1063-72.
5. Liu P, Huang H, Rollins N, et al. Quantitative assessment of global cerebral metabolic rate of oxygen (CMRO2) in neonates using MRI. NMR Biomed 2014;27:332-40.
6. Ouyang M, Liu P, Jeon T, et al. Heterogeneous increases of regional cerebral blood flow during preterm brain development: Preliminary assessment with pseudo-continuous arterial spin labeled perfusion MRI. Neuroimage. 2017;147:233-242.
Figures