1775
High resolution neonatal brain relaxometry in 10 minutes – A preliminary proof of concept1Centre for the Developing Brain, School of Biomedical Engineering and Imaging Sciences, King's College London, London, United Kingdom
Synopsis
Quantitative MRI promises to allow objective and reproducible tissue metrics which are of special interest in newborn brain maturation characterization. However, such methods require acquisition times above 20 minutes which hinders their clinical applicability. With an increasing trend towards examination without sedation during natural sleep, subject motion is an important issue for neonatal applications. With this in mind, this work builds on the previously described Joint System Relaxometry framework and presents a neonatal specific protocol which allows 1.25mm isotropic 3D maps of Proton Density, T1 and T2 relaxation times in a total of 10minutes examination time.
Purpose
Qualitative MR imaging provides
excellent soft tissue differentiation of the newborn brain. However, while voxel
intensity values are related to underlying tissue properties, they are also dependent
on scanner hardware and software1. Quantitative MRI (qMRI)
approaches provide measurements of tissue properties which can allow objective
and reproducible comparisons of subject groups and enable assessment of changes
in tissue properties with maturation2–5. Although such approaches
have great potential for studying the newborn brain, traditional qMRI methods
require prohibitively long acquisition times (above 20 minutes), and so these
approaches have not been widely used in this population6–9. We have recently described a
Joint System Relaxometry10 (JSR) framework which allows
sub-millimeter adult brain relaxometry in 11 minutes. An important issue for
neonatal applications is the substantial risk of subject motion, particularly with
an increasing trend towards examination without sedation during natural sleep. For
this initial protocol we have sought to balance resolution and SENSE acceleration
factors to achieve a robust acquisition in a total examination time of 10
minutes.Purpose
Methods
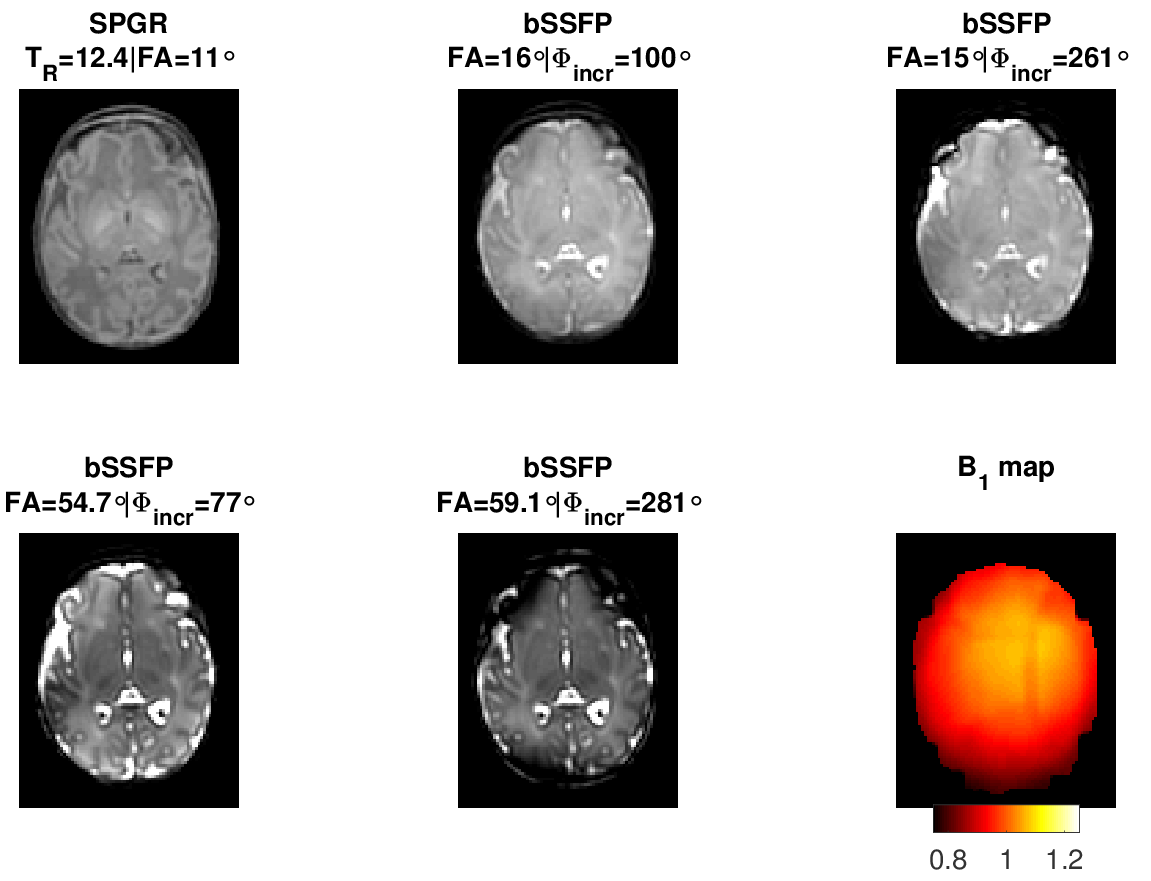
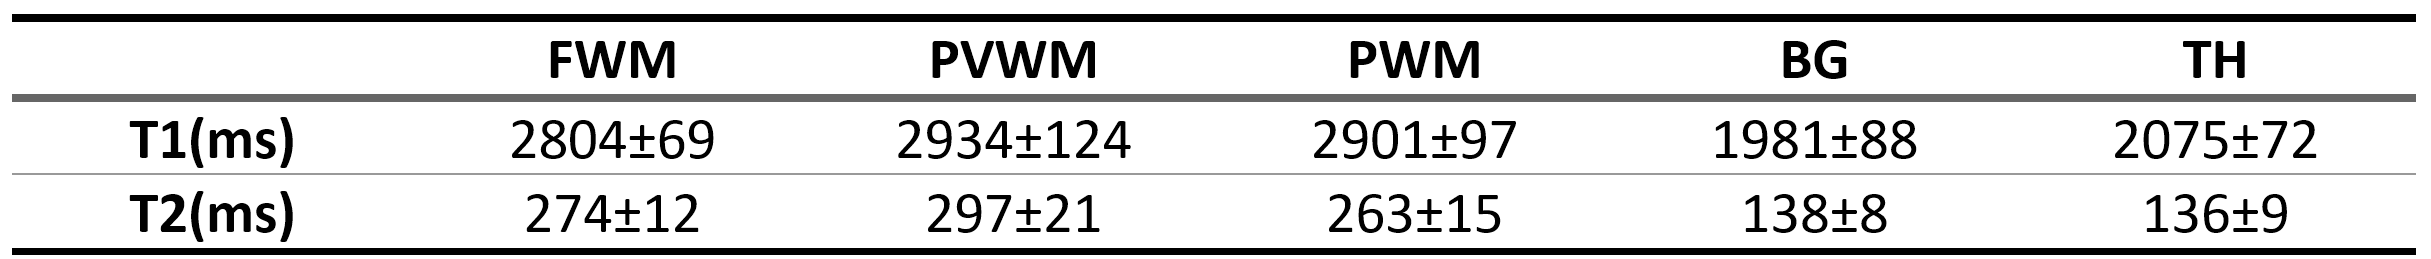
Image data was acquired from a single healthy preterm infant (Gestation age at birth: 33+2 weeks and at scan: 34+6 weeks) following informed parental consent (National Research Ethics number: 12/LO/1247) with a Phillips 3T Achieva Tx system. The core protocol design was as described previously by Teixeira et al.10 with both Spoiled Gradient Recalled acquisition (SPGR) and balanced Steady State Free Precession (bSSFP) images obtained with fixed echo time of 3.5ms, matched field of view (FOV) 200x200x200mm3 and acquired voxel size of 1.25x1.25x1.25mm3. A SENSE11 acceleration factor of 1.2 was used on both AP and RL directions. To stabilize magnetization transfer (MT) effects, the Controlled Saturation of MT (CSMT) approach12 was employed and all measurements were obtained at fixed . The optimal combination of imaging parameters and sequences was determined based on a Cramer-Rao Lower bound criteria10 for the expected neonatal range of relaxation times6: single SPGR image with TR=12.4ms and flip angle (FA) of 11˚; four bSSFP images at fixed TR=7.0ms, FA=(16.0˚,15.0˚,54.7˚,59.1˚) and excitation phase increment values of 100˚, 261˚, 77˚, 281˚. To correct for transmit field inhomogeneities, an AFI (actual field map imaging)13 field map was acquired with the same FOV as the SPGR and bSSFP acquisitions, a prescribed FA=80˚, TR1=40ms, TR2=200ms, and an acquired voxel resolution of 3.3x3.15x3.2mm3. All images were aligned using linear registration prior to parameter estimation using FSL5.0 FLIRT (www.fmrib.ox.ac.uk/fsl). Five regions of interest (ROI) were manually defined on the Frontal White Matter (FWM), Periventricular White Matter (PVWM), Posterior WM (PWM), Basal Ganglia (BG) and Thalamus (TH). For each ROI (consisting of ~100voxels) the mean and standard deviation of the T1 and T2 distributions was calculated.Results
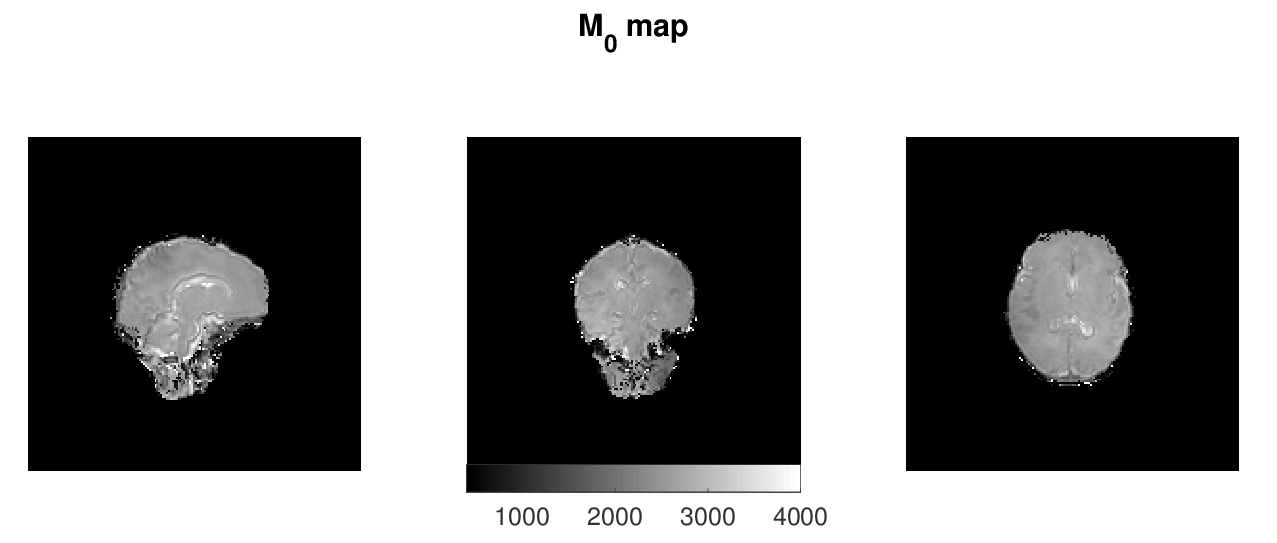
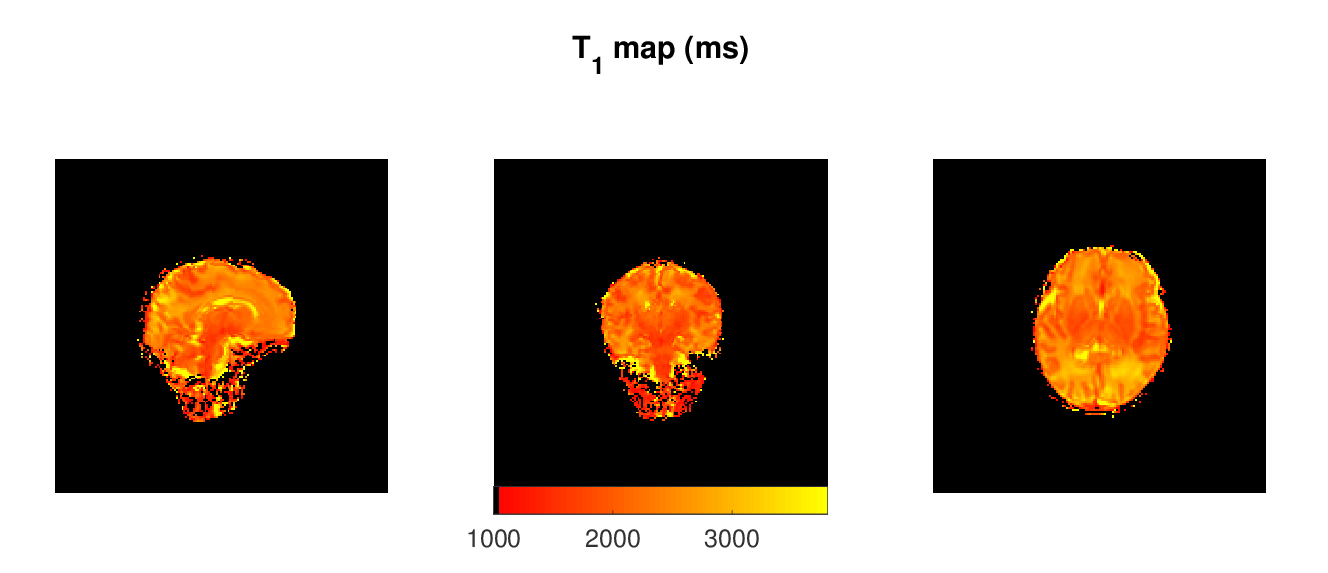
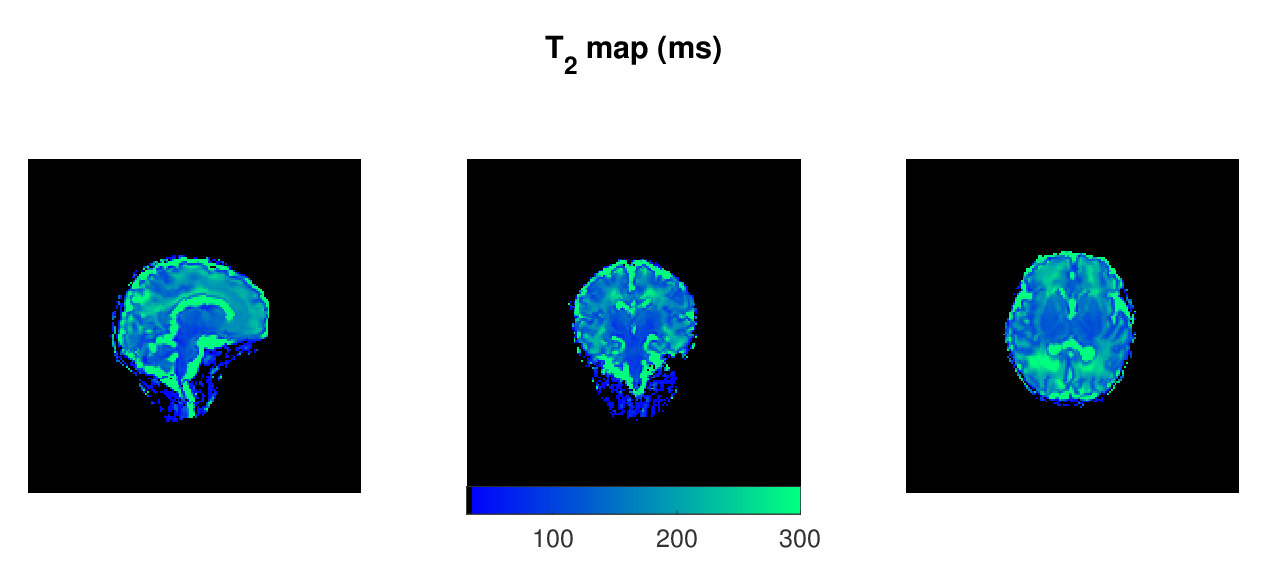
Figure 1 shows representative axial slices of the images required for the JSR estimation and the sampled B1 map. Figures 2, 3 and 4 show sagittal, axial and coronal representative slices of obtained PD, T1 and T2 maps. ROI specific metrics can be found in Table 1.Discussion/Conclusion
This work is proof of concept on the feasibility of rapid single-pool relaxometry of the brain in neonatal subjects. By carefully selecting a dedicated set of gradient echo images (Figure 1) we were able to obtain Proton Density, T1 and T2 maps in a total examination time of approximately 10 minutes. To address the potential limitation of intra- and inter-volume motion hindering estimation, we have compromised on the total acceleration and image resolution to enhance robustness against motion14. Future work to improve this further will involve modification of k-space sampling trajectories15 to allow intra-volume correction and evaluation of the best registration scheme for addressing inter-volume motion. The results of our ROI analysis are in relatively good agreement to those previously described in Table 4 of Williams et al.6: Preterm scanned Preterm FWM and TH relaxation times of 2745±255ms and 2084±199ms for T1; and corresponding values of 278±69ms 146±8ms for T2. Despite this, it is worth noting that such measurements are extremely sensitive to RF conditions12,16,17 and direct comparison should be performed with caution12. However, the CSMT framework is expected to achieve full agreement with Spin-Echo based T2 measures12 as demonstrated by the agreement between our ROI based T2 measures and those previously reported at 3T6. In summary, we demonstrate it is possible to obtain 1.25mm isotropic 3D volumes of Proton Density, T1 and T2. We hope this preliminary study will pave the way for more wide-spread implementation of neonatal relaxometry which could greatly enhance our understanding of brain development via robust quantification of tissue specific developmental trajectories and identification of how they deviate in disease.Acknowledgements
This work received funding from the European Research Council under the European Union’s Seventh Framework Programme [FP7/20072013/ERC] grant agreement no. [319456] (dHCP project), and was supported by the Wellcome EPSRC Centre for Medical Engineering at Kings College London [WT 203148/Z/16/Z], MRC strategic grant [MR/K006355/1] and by the National Institute for Health Research (NIHR) Biomedical Research Centre based at Guy’s and St Thomas’ NHS Foundation Trust and King’s College London. The views expressed are those of the authors and not necessarily those of the NHS, the NIHR or the Department of Health.References
1. Margaret Cheng, H. L., Stikov, N., Ghugre, N. R. & Wright, G. A. Practical medical applications of quantitative MR relaxometry. J. Magn. Reson. Imaging 36, 805–824 (2012).
2. Lutti, A., Dick, F., Sereno, M. I. & Weiskopf, N. Using high-resolution quantitative mapping of R1 as an index of cortical myelination. NeuroImage 93, (2014).
3. Weiskopf, N. et al. Quantitative multi-parameter mapping of R1, PD*, MT, and R2* at 3T: A multi-center validation. Front. Neurosci. (2013). doi:10.3389/fnins.2013.00095
4. Ma, D. et al. Magnetic resonance fingerprinting. Nature 495, 187–92 (2013).
5. Yeatman, J. D., Wandell, B. A. & Mezer, A. A. Lifespan maturation and degeneration of human brain white matter. Nat. Commun. 5, 4932 (2014).
6. Williams, L.-A. et al. Neonatal Brain: Regional Variability of in Vivo MR Imaging Relaxation Rates at 3.0 T—Initial Experience. Radiology 235, 595–603 (2005).
7. Thornton, J. S. et al. Cerebral tissue water spin-spin relaxation times in human neonates at 2.4 tesla: Methodology and the effects of maturation. Magn. Reson. Imaging 17, 1289–1295 (1999).
8. Ferrie, J. C. et al. MR Assessment of the brain maturation during the perinatal period: Quantitative T2 MR study in premature newborns. Magn. Reson. Imaging 17, 1275–1288 (1999).
9. Counsell, S. J. et al. T2 relaxation values in the developing preterm brain. Am. J. Neuroradiol. 24, 1654–1660 (2003).
10. Teixeira, R. P. A. G., Malik, S. J. & Hajnal, J. V. Joint system relaxometry (JSR) and Cramer-Rao lower bound optimization of sequence parameters: A framework for enhanced precision of DESPOT T1 and T2 estimation. Magn. Reson. Med. 0, (2017).
11. Pruessmann, K. P., Weiger, M., Scheidegger, M. B. & Boesiger, P. SENSE: Sensitivity encoding for fast MRI. Magn. Reson. Med. 42, 952–962 (1999).
12. A. G. Teixeira, R. P., Price, A. N., Baburamani, A. A., Malik, S. J. & Hajnal, J. V. Robust VFA relaxometry by Continuous Saturation of Magnetization Transfer (CSMT) with non-selective Multi-Band pulses. in Proc Intl Soc Mag Reson Med (2017).
13. Yarnykh, V. L. Actual flip-angle imaging in the pulsed steady state: A method for rapid three-dimensional mapping of the transmitted radiofrequency field. Magn. Reson. Med. 57, 192–200 (2007). 14. Godenschweger, F. et al. Motion correction in MRI of the brain. Phys. Med. Biol. 61, R32–R56 (2016).
15. Cordero-Grande, L. et al. Motion correction in volumetric brain imaging based on DISORDER: Distributed and Incoherent Sample Orders for Reconstruction Disentanglement using Encoding Redundancy. in Proc Intl Soc Mag Reson Med (2017).
16. Rioux, J. A., Levesque, I. R. & Rutt, B. K. Biexponential longitudinal relaxation in white matter: Characterization and impact on T1 mapping with IR-FSE and MP2RAGE. Magn. Reson. Med. 75, 2265–2277 (2016).
17. van Gelderen, P., Jiang, X. & Duyn, J. H. Effects of magnetization transfer on T1 contrast in human brain white matter. Neuroimage 128, 85–95 (2016).
Figures