1772
Longitudinal Mapping of Local Relationship of Surface Area, Cortical Thickness and Cortical Folding in Infants1Department of Radiology and BRIC, University of North Carolina at Chapel Hill, Chapel Hill, NC, United States, 2Key Laboratory of Biomedical Engineering of Ministry of Education, Zhejiang University, Hangzhou, China, 3Department of Psychiatry, University of North Carolina at Chapel Hill, Chapel Hill, NC, United States
Synopsis
A simple physical law on the global relationship of surface area, cortical thickness, and cortical folding is found across a full range of mammalian species’ brains, including adult human brains1,2. However, little is known about the local relationship of these cortical properties, especially in infant brains with rapid development in the first two years of life. To fill this knowledge gap, we explored the local relationship of surface area, cortical thickness and cortical folding on 73 normal infants, each of which was longitudinally scanned at 0, 1, and 2 years of age. We reveal that the relationship of these three cortical properties is age-specific and region-specific.
Introduction
Although the cortical folding of mammalian brains varies greatly across species, it follows a scaling law, which describes the global relationship between cortical surface area and the square root of cortical thickness1. This relationship is derived from a simple physical model, which minimizes the effective free energy associated with cortical shape1. Specifically, the discovered relation is: AtT1/2 = kAe1.305 in which T is the average cortical thickness, At is the total surface area, Ae is the exposed cerebral hull surface area, and k is a free parameter1. A recent study2 further verified that the adult human brains at different ages largely conform to the theoretically predicted global relation: AtT1/2 = kAe5/4 by Mota1. However, it is still unclear about the local relationship of these cortical properties, especially for the infant with rapid brain development during the first two years3,4. To fill this knowledge gap, we explore the local relationship maps between surface area, cortical thickness, and cortical folding of 73 normal infants at 0, 1, and 2 years of age.Methods
Totally 219 longitudinal MR images from 73 healthy infants at 0, 1, and 2 years of age were acquired on a Siemens head-only 3T scanner3. The cortical surfaces were reconstructed using the UNC Infant Pipeline5 and resampled as 163,842 vertices accordingly. Then, the cerebral hull surfaces were reconstructed and the vertex-to-vertex correspondences between cortical surfaces and cerebral hull surfaces were established. The vertex-wise cortical thickness was calculated as the average value of the minimum distance between inner and outer surfaces. The vertex-wise surface area was computed as the one third of the areas of all triangles connecting to this vertex. To study the local relationship between surface area, cortical thickness and cortical folding, for each cortical vertex we adopted the N-ring neighborhood on the resampled cortical surface and their corresponding regions on the cerebral hull surfaces, thus ensuring a meaningful comparison of anatomically corresponding regions across ages and subjects3. Then, in the local region of each vertex, the local features lT, lAt, and lAe were computed. Next, for each vertex, the relationship between lT, lAt, and lAe was established by linearly fitting the corresponding values from 73 subjects according to the following equation: log10 (lAt * lT1/2) = s * log10 lAe + log10 k. Here, the slope ‘s’ was calculated on each vertex at each age, thus the longitudinal maps of local relationship of surface area, cortical thickness, and cortical folding were created for infants. Meanwhile, for each subject, the mean lT, mean lAt, and mean lAe of all vertices were calculated, and then the 73 pairs of values were linearly fitted with the above equation.Results
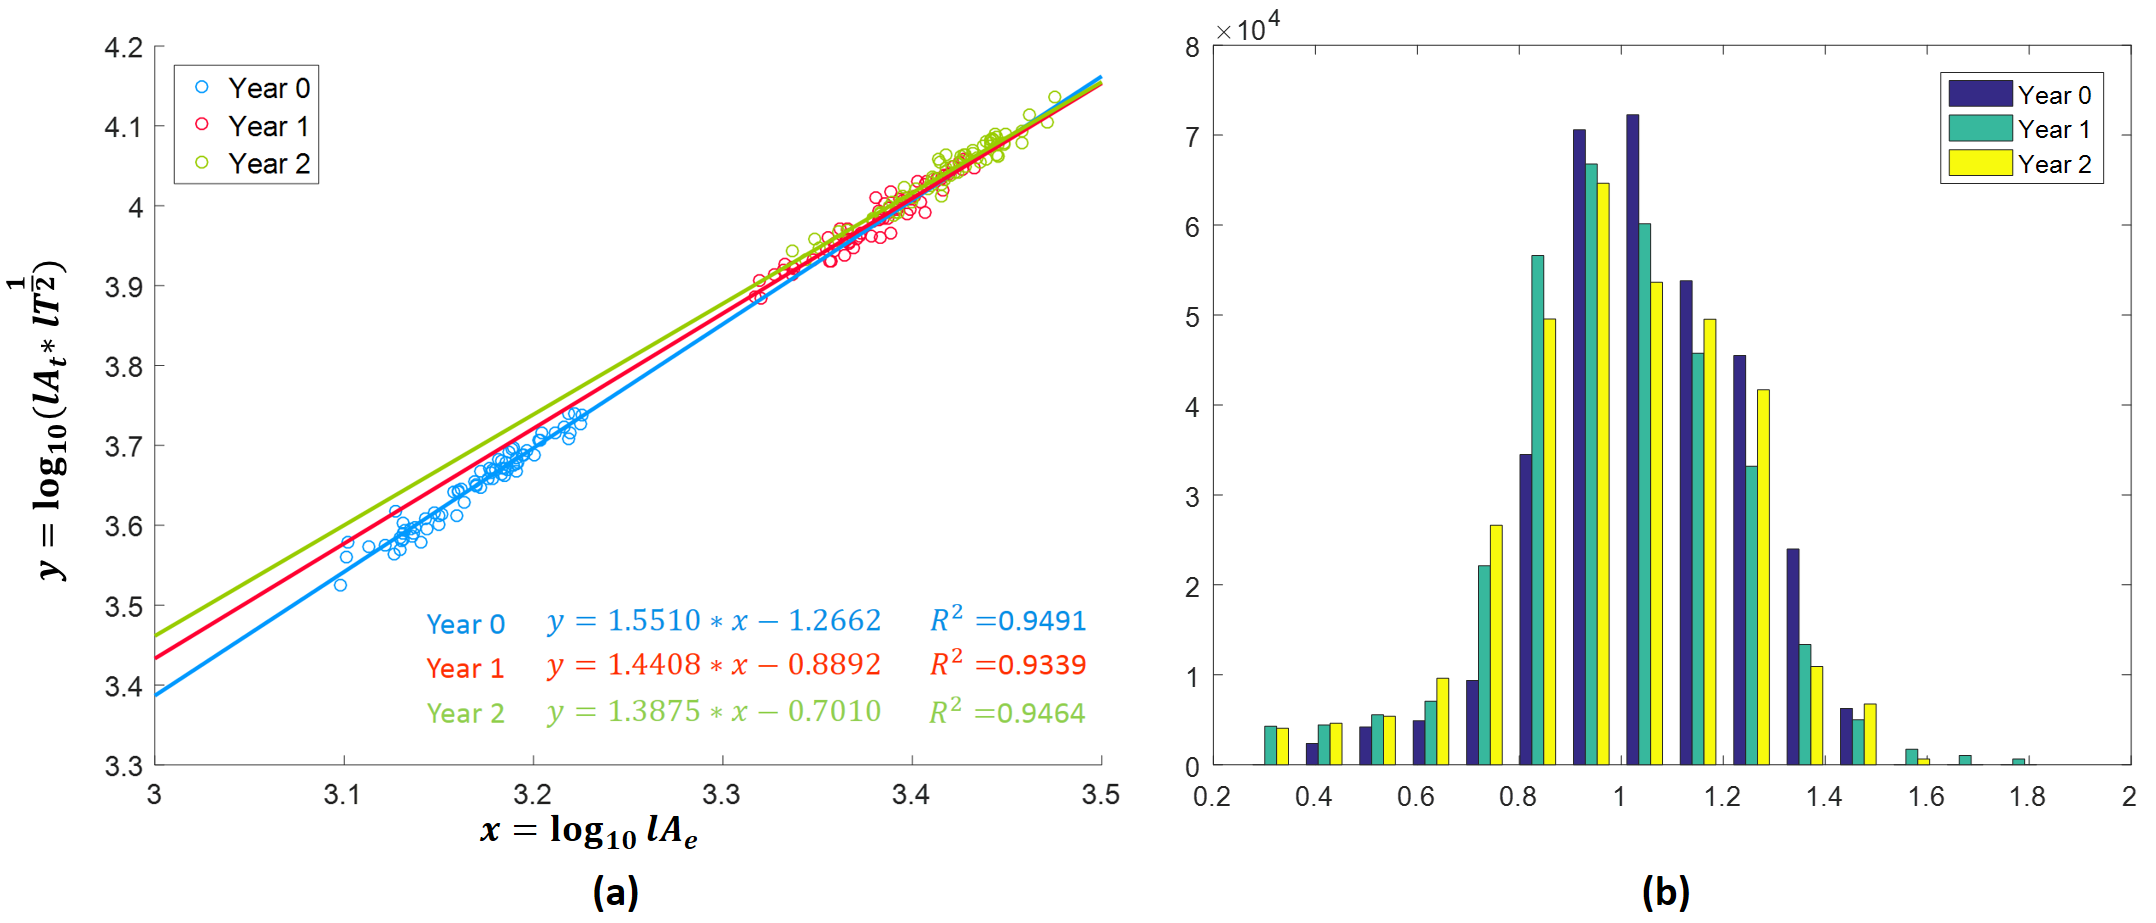
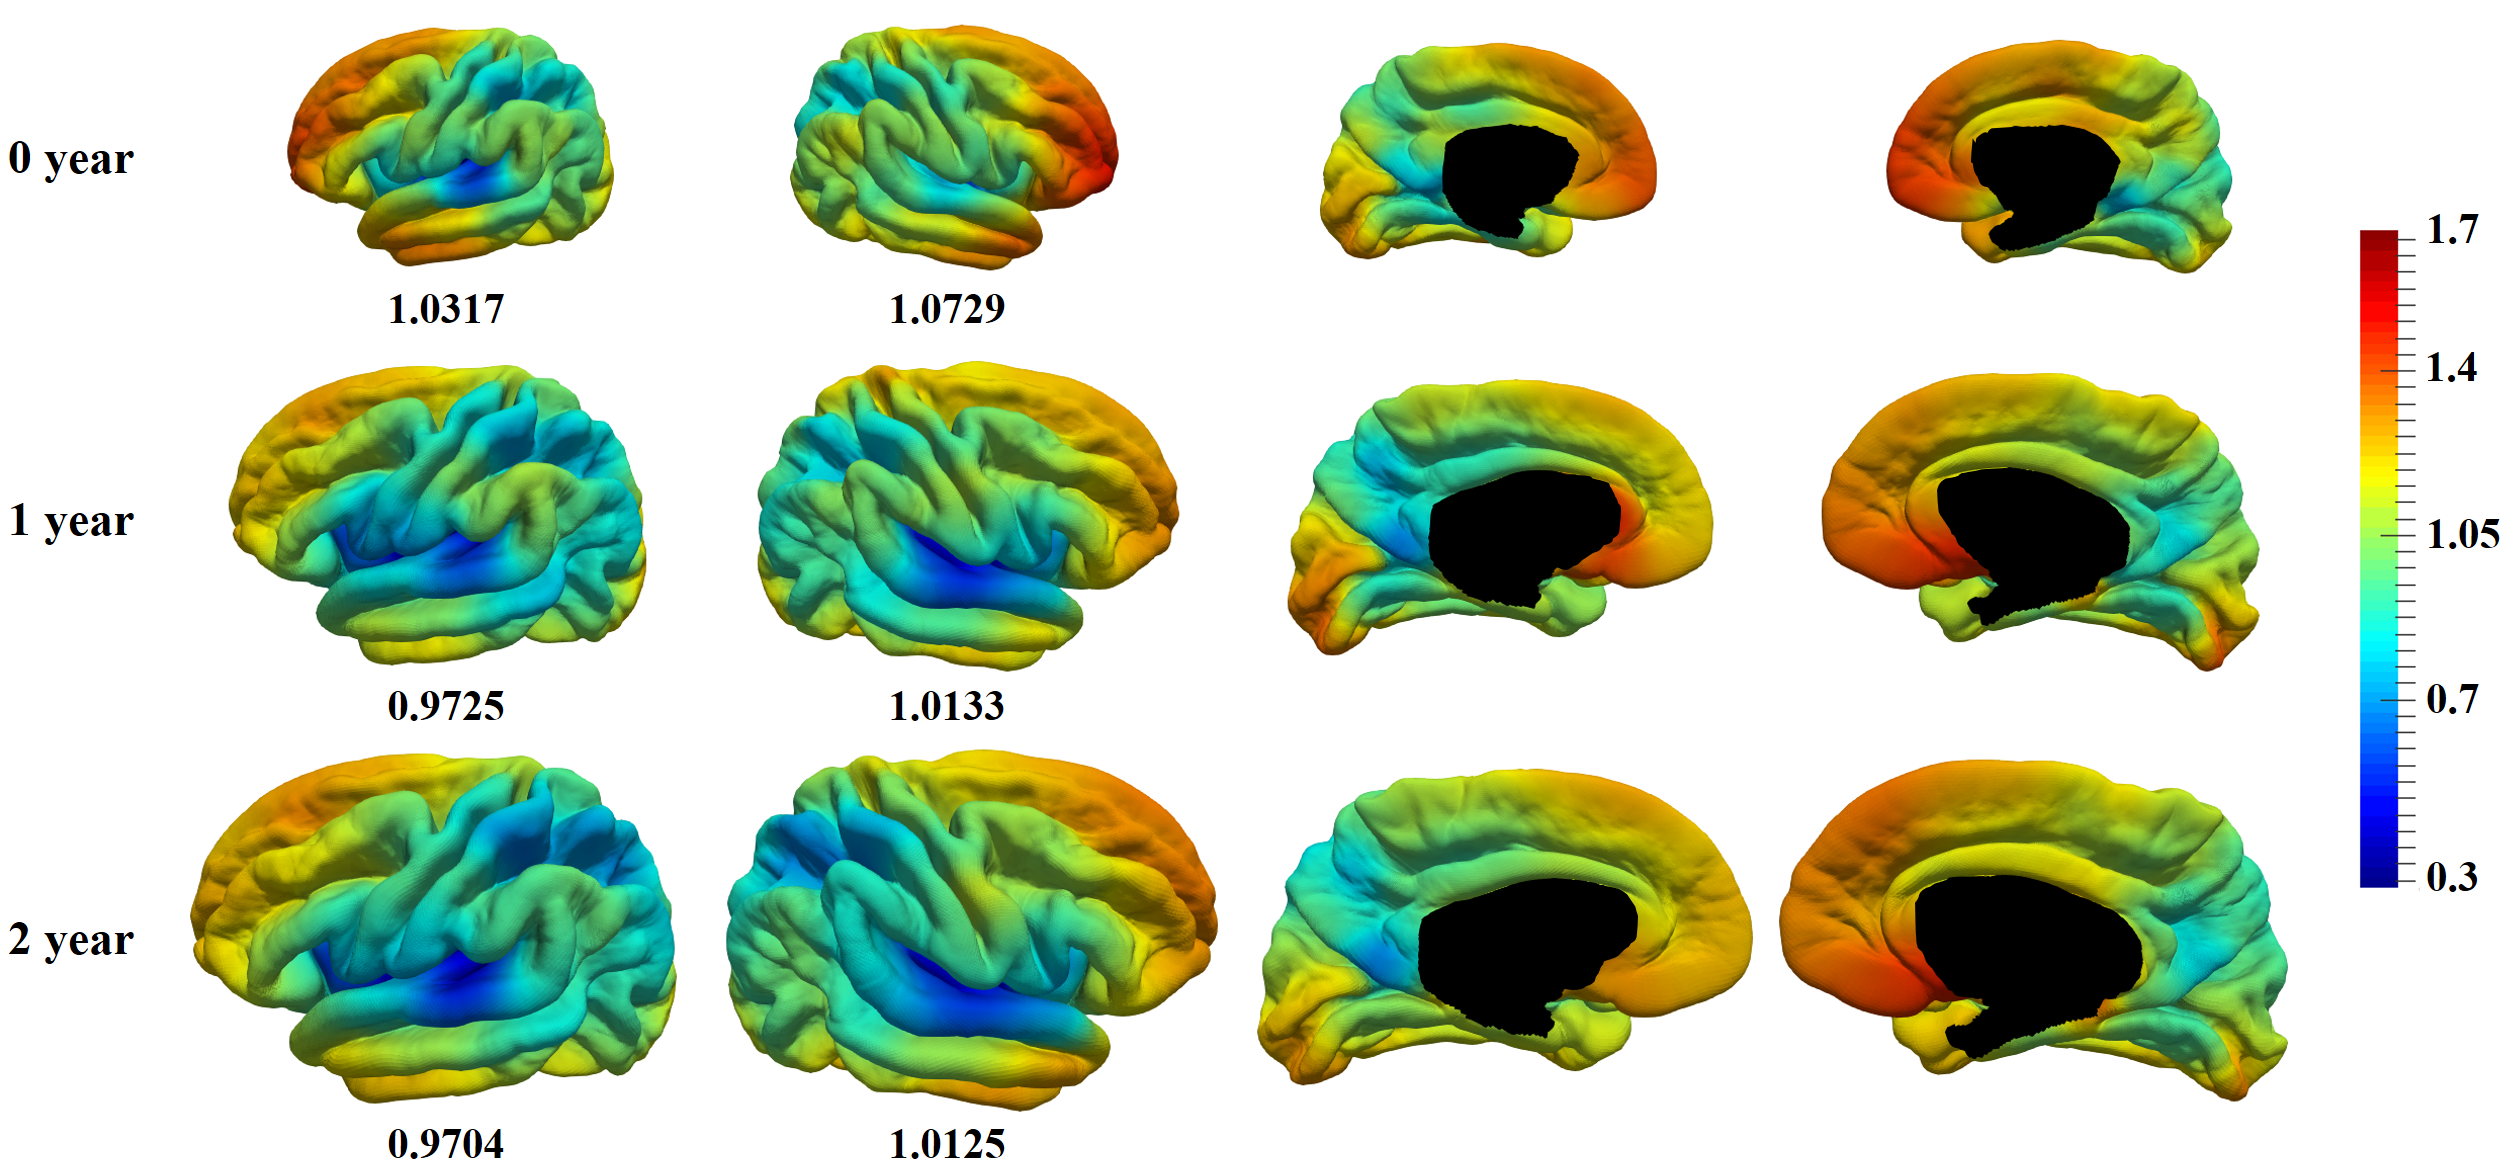
Fig. 1-a displays the average local relationship between x = log10 lAe and y = log10 (lAt * lT1/2) of all 73 subjects and their fitting models at 0, 1, and 2 years of age. As we can see, an intrinsic linear fitting model exists at all three ages although there is obvious age-related difference. Specifically, the model is y = 1.5510 * x - 1.2662 (R2 = 0.9491) at birth, y = 1.4408 * x - 0.8892 (R2 = 0.9339) at year 1, and y = 1.3875 * x - 0.7010 (R2 = 0.9464) at year 2. Both slope and offset decrease during the first two years. Fig. 1-b displays the distribution histogram of the slope ‘s’ of all the vertices at 0, 1, and 2 years of age. For each age, the slope values of more than 80% vertices locate in the range 0.84-1.36. Fig. 2 shows the longitudinal maps of local relationship of surface area, cortical thickness, and cortical folding in infants at 0, 1, and 2 years of age. The color of each vertex on the surface denotes the value of slope ‘s’. Clearly, the vertices in the frontal, inferior temporal and occipital cortices show large slope values, while those in the superior temporal and parietal cortices show small slope values. The mean slope values are 1.0523, 0.9929, 0.9915 at 0, 1, and 2 years, respectively. As we can see, the slope values significantly decrease in the first year and then slightly decrease in the second year.Discussion and Conclusion
We have systematically explored the longitudinal local relationship between surface area, cortical thickness, and cortical folding in infants. We revealed that their local relationship is age-specific and region-specific. These findings are likely related to the underlying biological mechanisms and developmental trajectories of surface area, cortical thickness, and cortical folding. Future work will include interpreting the mechanisms of our findings and investigating whether neurodevelopmental disorders change this relationship.Acknowledgements
This work was supported in part by NIH grants (MH100217, MH108914, MH107815, MH110274, MH070890, MH064065 and HD053000).References
1. Mota B, Herculano-Houzel S. Cortical folding scales universally with surface area and thickness, not number of neurons. Science. 2015;349(6243):74-7.
2. Wang Y, Necus J, Kaiser M, Mota B. Universality in human cortical folding in health and disease. Proc Natl Acad Sci USA. 2016; pii: 201610175.
3. Li G, Wang L, Shi F, et al. Mapping longitudinal development of local cortical gyrification in infants from birth to 2 years of age. J Neurosci. 2014;34(12):4228-38.
4. Li G, Lin W, Gilmore JH, Shen D. Spatial patterns, longitudinal development, and hemispheric asymmetries of cortical thickness in infants from birth to 2 years of age. J Neurosci. 2015;35(24):9150-62.
5. Li G, Wang L, Shi F, et al. Construction of 4D high-definition cortical surface atlases of infants: Methods and applications. Med Image Anal. 2015; 25(1): 22-36.
Figures