1768
Is cortical microstructure related to folding during development? A longitudinal MRI study in preterms1INSERM, Gif-sur-Yvette, France, 2Aix-Marseille University, CNRS, Marseille, France, 3CEA, Gif-sur-Yvette, France, 4Wilhelmina Children's Hospital, University Medical Center, Utrecht, Netherlands, 5APHP, INSERM, Paris, France
Synopsis
The human brain cortex develops dramatically during the preterm period, in terms of both morphology, intra-cortical maturation and dendritic arborization. Here we aimed to investigate whether different stages of microstructural maturation are observed in cortical regions that fold successively. We studied preterm infants longitudinally at around 30 and 40 weeks of post-menstrual age, and combined measures from diffusion tensor imaging (DTI) and spectral analysis of gyrification (SPANGY). We highlighted that proxies of primary folds have an advanced microstructural maturation early on, and that the progression until term age is more intense in proxies of secundary folds than in gyri.
Introduction
The human brain cortex develops dramatically during the second half of pregnancy1, and major microstructural changes are demonstrated in preterms with diffusion tensor imaging (DTI)2,3. Early on, the radial cortical organization, with high fractional anisotropy (FA) and longitudinal diffusivity (λ//), is supposed to rely on the radial glial scaffold and on the radially oriented apical dendrites4. This pattern disappears thereafter supposedly with the development of dendritic arborization and intra-cortical maturation5. During the preterm period, the cortex also demonstrates intense morphological changes, and gyri show higher rates of DTI changes than sulci3. This suggests possible relationships between the developing microstructure and the folding process. Here we aimed to investigate whether different stages of microstructural maturation are observed in cortical regions that fold at different ages. To this end, we studied preterm born infants longitudinally, and combined DTI analysis and an original method for spectral analysis of gyrification (SPANGY)6 providing proxies of primary, secondary and tertiary folds that appear from 20, 32 weeks of gestational age (wGA), and around term age respectively7.Methods
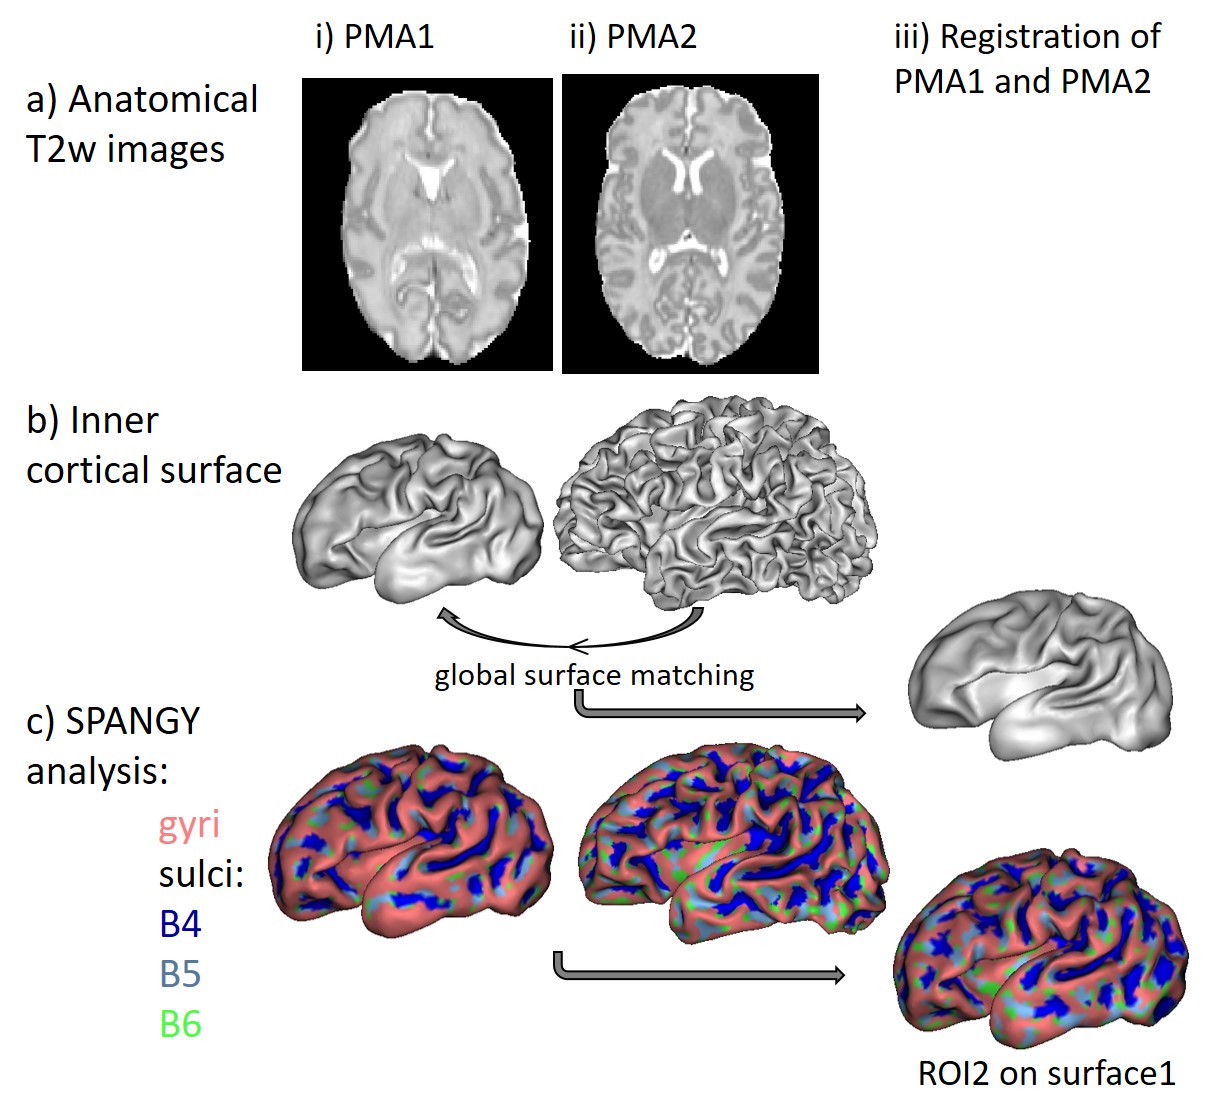
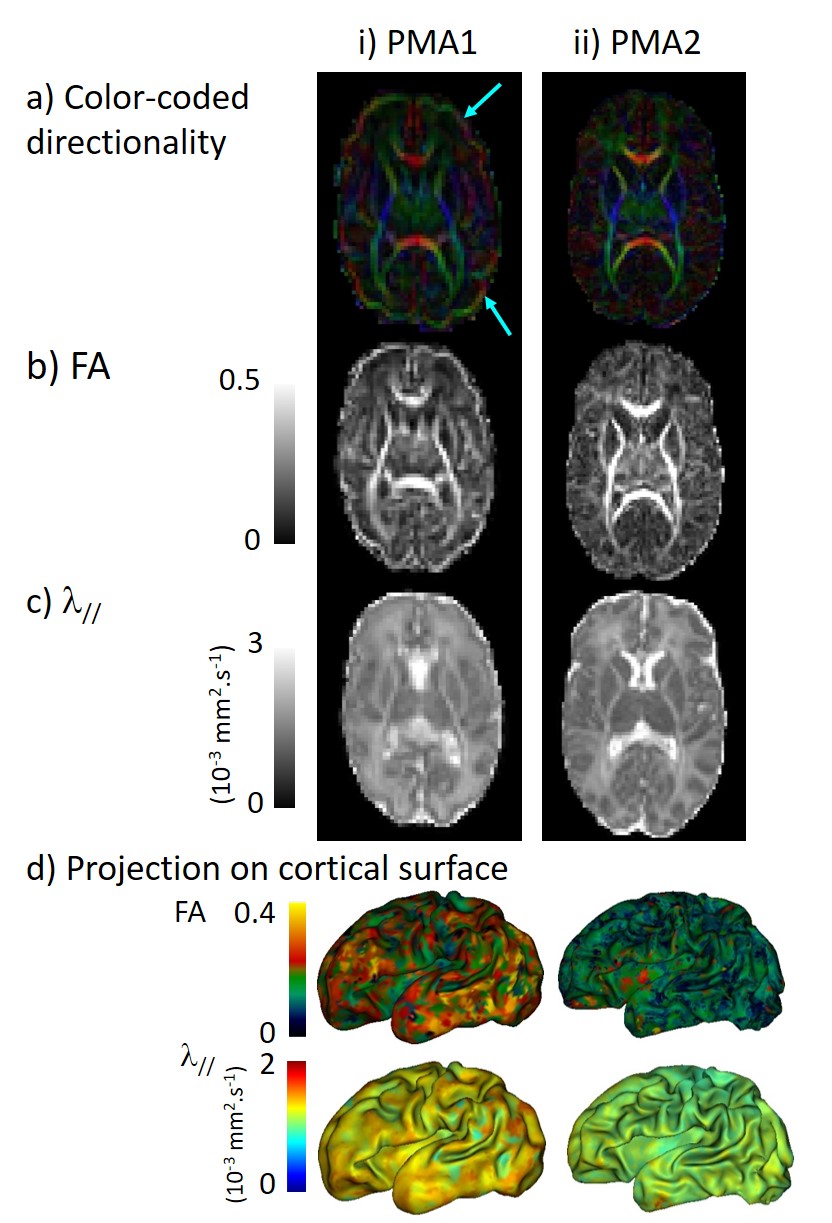
MRI was performed in 13 newborns without neurological complications (GA at birth: [25.3w; 27.9w]) at around 30w of post-menstrual age (PMA1: [29.3w; 31.7w]) and term equivalent age (PMA2: [40w; 41.9w]). T2-weighted images and diffusion images (b=800s/mm2, 32 gradient directions) were acquired using 3T-MRI (Philips Medical Systems) (Figures 1-2)8,9.
Firstly we post-processed anatomical images for each infant and each PMA (Figure 1). We segmented brain tissues and obtained 3D reconstruction of inner cortical surface for each hemisphere9. SPANGY analysis of mean curvature allowed to identify spectrally-defined sulci elements over the cortical surface: B4, B5 and B6 parcels that are characterized by increasing spatial frequency and might be assimilated to developmentally-defined folds6,7. We further registered the cortical surfaces across the two PMAs by using a spectral-based algorithm for global surface matching (Figure 1iii). Inspired by a recent approach10, this registration was based on linear searches and smoothing by mean curvature of the surface at PMA2. It enabled us to reliably project SPANGY parcels identified at PMA2 to the cortical surface at PMA1.
Secondly we processed diffusion images with Connectomist software11, and corrected motion artefacts12 and geometric distortions13. After computing DTI maps (Figure 2), we focused on FA and λ// as markers of cortical microstructure. These parameters were mapped on the cortical surface, averaged over different regions of interest (ROIs) defined with SPANGY (gyri, B4-6 sulci), and compared across ROIs and across PMAs.
Results
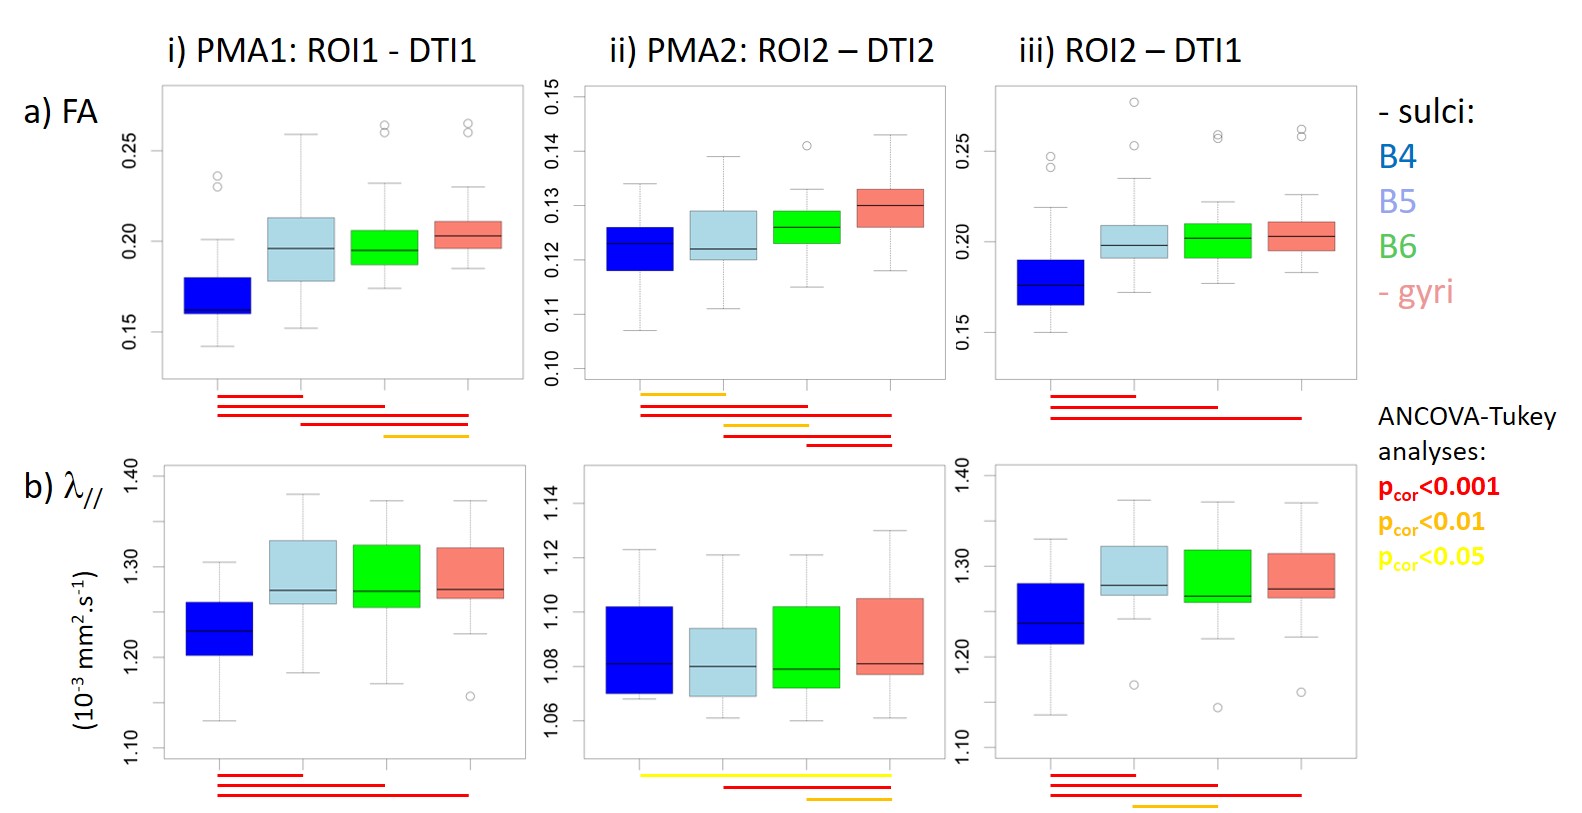
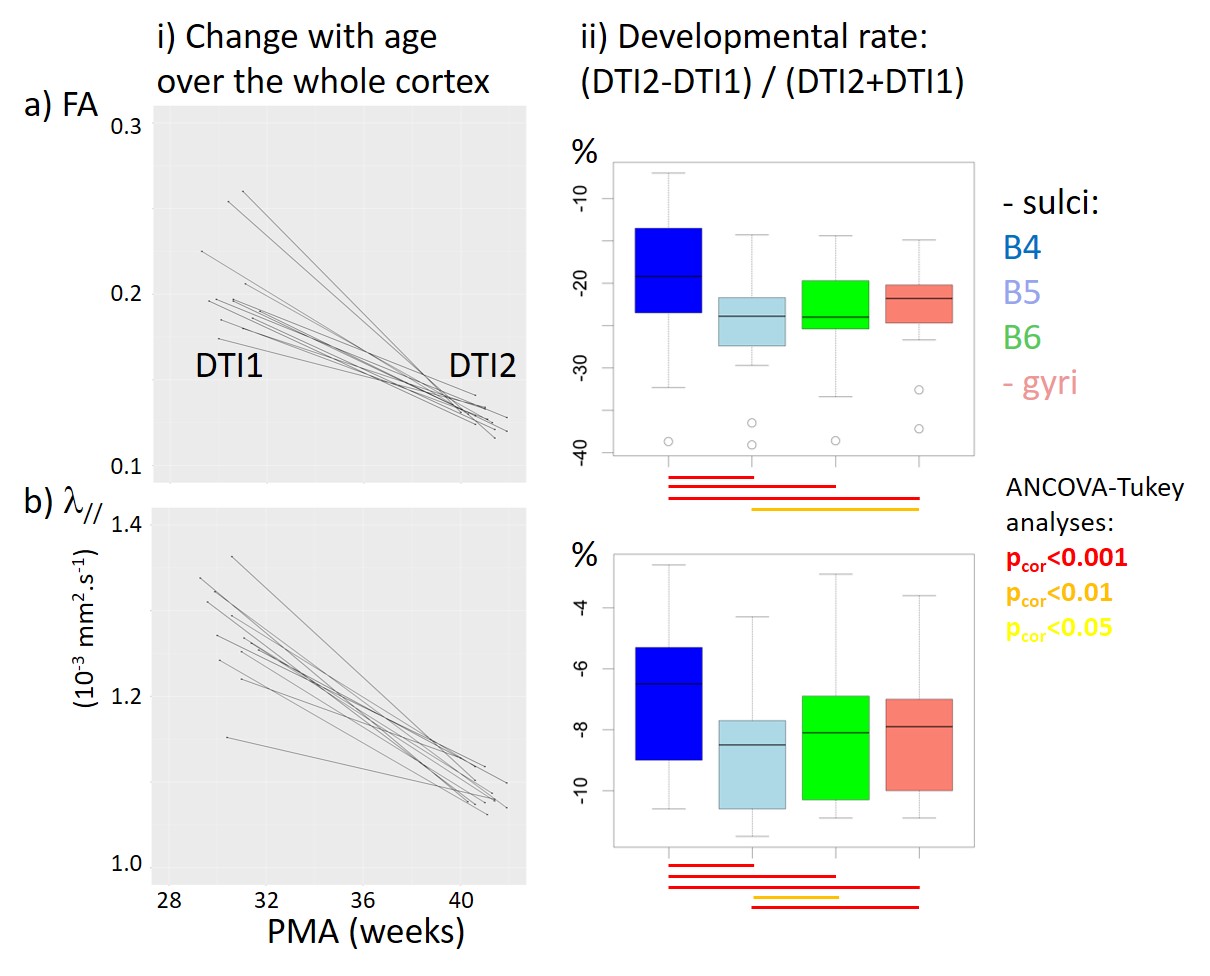
For each newborn, primary folds (B4 sulci) were already present at PMA1, while the cortical folding was much more complex at PMA2 when B5 and B6 sulci were mostly observed (Figure 1). As expected, we detected strong age-related changes in cortical microstructure, with decreases in FA and λ//. We also observed differences across ROIs (Figure 3): mainly FA and λ// values were the lowest in B4 sulci at PMA1, and were lower in B5 and B6 sulci than in gyri at PMA2. Regarding the longitudinal evolution of microstructure across PMAs (Figure 4), the developmental rates (in absolute value) were the lowest in B4 sulci, and were higher in B5 sulci than in gyri.Discussion
By combining DTI and SPANGY analyses in a longitudinal cohort of preterms, we aimed to disentangle the differential maturation of microstructure in cortical regions at different folding stages throughout development. We highlighted that B4 sulci have an advanced pattern already at PMA1, and that the progression until PMA2 is more intense in B5 sulci than in gyri. Although further investigations at intermediate and later PMAs will allow to precise these relationships, our preliminary findings suggest that primary folds have a more complex microstructure early on than other cortical regions, and that regions folding during the preterm period have a higher microstructural progression than surrounding regions. This is in agreement with a recent study in developing macaques showing that cortical structural differentiation is coupled to the sulci formation rather than to surface expansion5. Nevertheless this still do not allow to decipher whether the folding process induces microstructural maturation, or conversely that regions with advanced microstructure become folded.Conclusion
Combining complementary and quantitative MRI approaches in newborns gives us the opportunity to detail and understand complex mechanisms of development in the human brain in vivo. This is particularly challenging regarding the folding process as its possible origins have been debated for years. If there were confirmed relationships with intra-cortical microstructure, mapping the developing sulci would be an easy way to explore and detect early disturbances in brain connectivity.Acknowledgements
This work was supported by the French National Agency for Research (ANR-12-JS03-001-01, MODEGY) and the European Union's Horizon 2020 Framework Programme for Research and Innovation under Grant Agreement No. 604102 (HBP’s ramp-up phase).References
1. Dubois, J. and G. Dehaene-Lambertz, Fetal and postnatal development of the cortex: MRI and genetics. In: Arthur W. Toga, editor, Brain Mapping: An Encyclopedic Reference, Academic press: Elsevier, 2015. 2: p. 11-19.
2. McKinstry, R.C., et al., Radial organization of developing preterm human cerebral cortex revealed by non-invasive water diffusion anisotropy MRI. Cereb Cortex, 2002. 12(12): p. 1237-43.
3. Ball, G., et al., Development of cortical microstructure in the preterm human brain. Proc Natl Acad Sci U S A, 2013. 110(23): p. 9541-9546.
4. Huang, H., et al., Anatomical characterization of human fetal brain development with diffusion tensor magnetic resonance imaging. J Neurosci, 2009. 29(13): p. 4263-73.
5. Wang, X., et al., Folding, but not surface area expansion is associated with cellular morphological maturation in the fetal cerebral cortex. J Neurosci, 2017.
6. Germanaud, D., et al., Larger is twistier: spectral analysis of gyrification (SPANGY) applied to adult brain size polymorphism. Neuroimage, 2012. 63(3): p. 1257-72.
7. Dubois, J., et al., Exploring the successive waves of cortical folding in the developing brain using MRI and spectral analysis of gyrification. IEEE International Symposium on Biomedical Imaging (ISBI), 2016. DOI: 10.1109/ISBI.2016.7493259: p. 261-264.
8. Kersbergen, K.J., et al., Microstructural brain development between 30 and 40week corrected age in a longitudinal cohort of extremely preterm infants. Neuroimage, 2014. 103: p. 214-24.
9. Kersbergen, K.J., et al., Relation between clinical risk factors, early cortical changes, and neurodevelopmental outcome in preterm infants. Neuroimage, 2016. 142: p. 301-310.
10. Lombaert, H., J. Sporring, and K. Siddiqi, Diffeomorphic spectral matching of cortical surfaces. Inf Process Med Imaging, 2013. 23: p. 376-89.
11. Duclap, D., et al., Connectomist-2.0: a novel diffusion analysis toolbox for BrainVISA. Proceedings of the 29th ESMRMB meeting, 2012: p. 842.
12. Dubois, J., et al., Correction strategy for diffusion-weighted images corrupted with motion: Application to the DTI evaluation of infants’ white matter. Magnetic Resonance Imaging, 2014. 32(8): p. 981-992.
13. Lebenberg, J., et al., Clustering the infant brain tissues based on microstructural properties and maturation assessment using multi-parametric MRI. IEEE International Symposium on Biomedical Imaging (ISBI), 2015. DOI 10.1109/ISBI.2015.7163837: p. 148-151.
Figures