1766
High-Resolution Radial Diffusivity Images Provide Insights of Fetal Brain Development1Central Institute for Experimental Animals, Kanagawa, Japan, 2RIKEN Brain Science Institute, Saitama, Japan, 3Keio University School of Medicine, Tokyo, Japan, 4Okinawa Institute of Science and Technology, Okinawa, Japan
Synopsis
Investigating prenatal neural development provide depth knowledge of brain ontogeny. DTI-derived radial diffusivity (RD) imaging has advantage to provide information of microstructural tissue organization information without damaging the tissues. In this study, we investigate the changes of the radial diffusivity (RD) values during fetal development in non-human primate. The RD image contrast was enough to clearly depict the emergence of each brain regions as well as major white matter bundles during prenatal period. In addition, its whole brain intensity distribution histogram provided the information of critical period for the growth of myelination.
Introduction
Neural brain development follows complex series of steps including cell growth, migration, differentiation. The precise developmental steps are necessary for brain to function properly, and the failure of proper development sometimes brings neurological or neuropsychiatric disorders such as schizophrenia and autism. Especially in prenatal period, the neural brain changes occur more radically than at any other stages of life. Thus, investigating prenatal neural development is very important to deepen the knowledge of brain ontogeny as well as to elucidate the mechanism of the diseases and disorders mentioned above. Diffusion tensor imaging (DTI) allows studying the prenatal neural development non-invasively. It serves overall tissue microstructural organization in both white matter (WM) and gray matter (GM). Especially DTI-derived radial diffusivity (RD), which reflects diffusion perpendicular to the main diffusion direction, has been suggested to be more sensitive to the changes of tissue structures than any other DTI metrics. It would also provide more information than T1- or T2- weighted images, whose pixel brightness depends basically on the hydrogen intensity in the scanning object. Thus, RD maps would be a better tool to investigate fetal brain with respect to locating the brain regions and acquiring information of its developmental microstructural change. In this study, we investigate the changes of the radial diffusivity (RD) values during fetal development. As it is practically limited to collect prenatal human brain data albeit its non-invasiveness, we collected the fetal brains of non-human primate, common marmoset (Callithrix jacchus), whose full term gestational period is about 18-20 weeks.Method
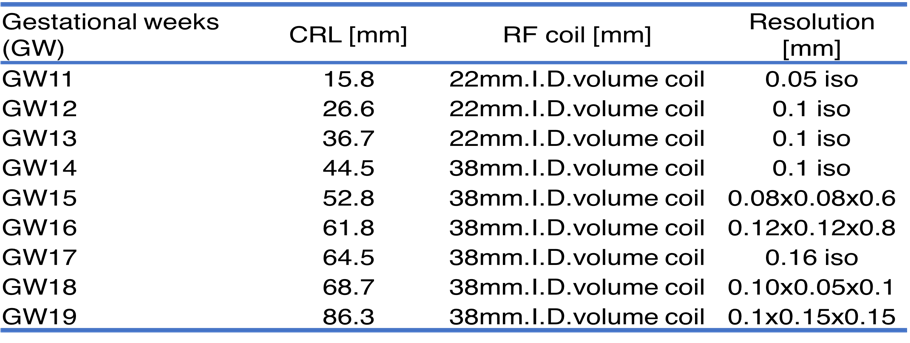
Fetal marmosets’ specimens in the gestational period (GW) 11 to 19, obtained by Cesarean section, were all immersed in 4% paraformaldehyde/ phosphate-buffered saline for 2 weeks. After fixation specimens were stored for 2 weeks in phosphate-buffered saline containing 0.5% sodium azide and the contrast agent of gadopentetate dimeglumine, 1 mM Magnevist (Schering, Berlin, Germany). We acquired high resolution diffusion MRI data with one B0 and twelve b=2000 different directional volumes from one for each of the gestational period. MRI scans were performed using a 7 tesla MRI scanner with actively shielded gradients at maximum strength of 700mT/m (Bruker Biospin GmbH; Ettlingen, Germany). To obtain image resolution as high as possible, we changed RF coil size and as a result resolution size depending on crown-rump length of the fetuses (see Table 1). The acquired diffusion MRI data was pre-processed by the following steps: denoise, eddy correction, and bias field correction. Then, the RD maps were derived with tensor modeling. The RD maps and its intensity histograms inside of carefully stripped whole brain mask were compared by each GW.Results and Discussions
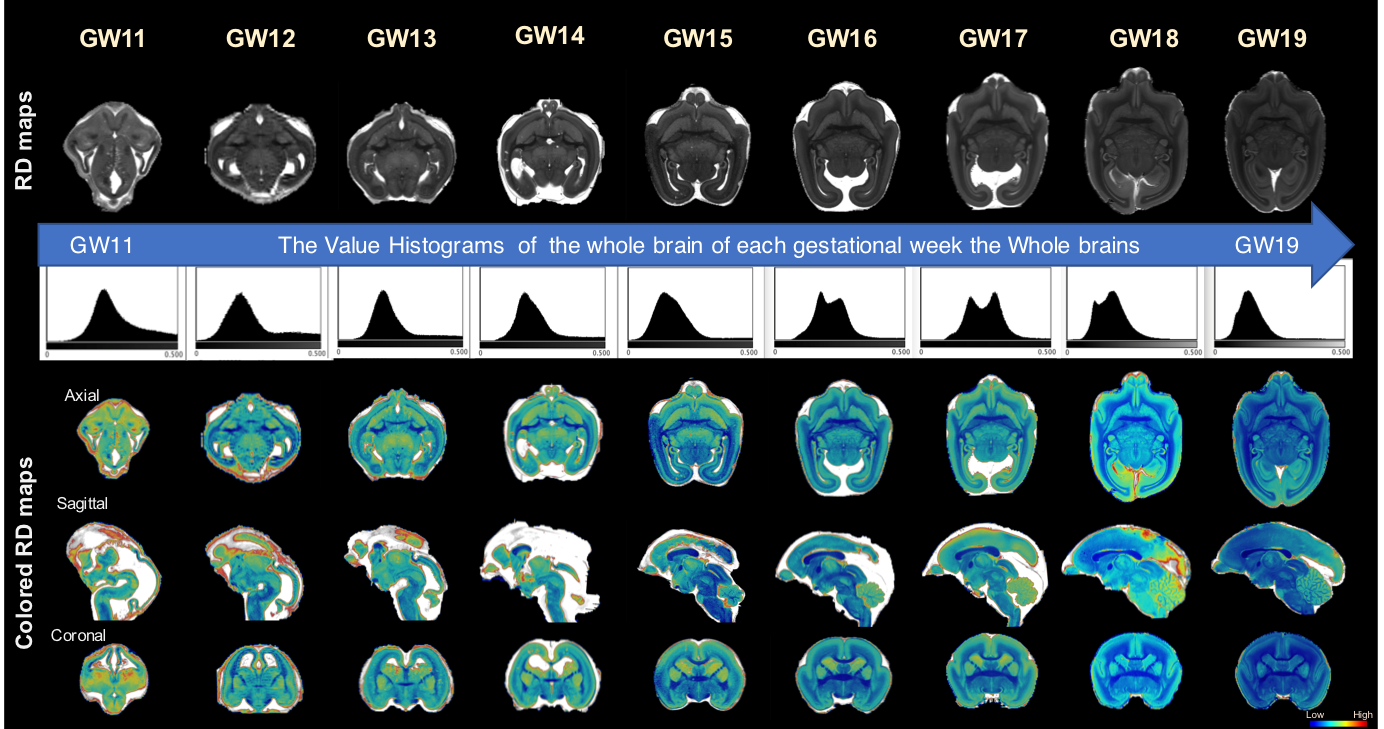
As shown in Fig 1, dynamic developmental change occurred in prenatal period. The image contrast was enough to clearly depict the emergence of each brain regions. The brain got enlarged week by week in both rostral-caudal and dorsal-ventral directions, gradually forming white matter bundles and brain regions present in postnatal brain. The dorsal gap space between cortical and subcortical got filled at GW 15, and until then the origins of some brain regions and white matter bundles such as anterior commissure, corpus callosum, hippocampal formation, and cerebellum, were recognizable. Between around GW15 and GW19, the cortical areas got thicken and thicken and sulcation occurred, forming sylvian fissure. The cerebellum size largely got increased and potential visual cortex grew caudally just before birth (GW 18-19).
The peak(s) of the whole brain intensity histogram moved leftward from center, meaning the total RD intensity got lower and lower as GW went by (see the histograms in Fig 1). Interestingly, the distribution of the RD value in a whole brain became binominal from nominal between GW 16 and G18, segmenting white matter/brainstem and cortical grey matter regions. It suggests that myelination radically progress in this period. In addition, spectrally colored RD maps by intensity (see colored RD map in Fig 1) also proved different intensity distribution in grey matter; the cerebellum and subcortical regions including caudate, thalamus, and amygdala, had higher intensity than cortical area.
These results described above suggested the prenatal grey matter development might have processed from lateral to medial and from rostral to caudal number and size of neural cells increased. In addition, there seemed to have especially important period for the growth of myelination (GW 15-18) and cerebellum (GW 17-18).
Acknowledgements
This research is partially supported by the program for Brain Mapping by Integrated Neurotechnologies for Disease Studies (Brain/MINDS) from Japan Agency for Medical Research and development, AMED and Grant-in-Aid for Japan Society for the Promotion of Science(JSPS) Research Fellow.References
- Hikishima, K., et al. "Atlas of the developing brain of the marmoset monkey constructed using magnetic resonance histology." Neuroscience 230 (2013): 102-113.
Figures