1760
Switched Gradient Impulse Response Measurement with Uniform Excitation of Eigenmodes1University of Florida, Gainesville, FL, United States, 2National High Magnetic Field Laboratory, Tallahassee, FL, United States
Synopsis
For pulsed field gradient experiments, it is important to characterize gradient switching to correct for errors in measured diffusivity and velocity resulting from imbalances in the gradient time integrals. Accurate characterization of the system requires the time derivative of the test gradient pulse mimic that of an impulse function which excite all the gradient eigenmodes uniformly. We introduce a new test pulse, called the Fresnel pulse whose derivative is a chirp function, which has a uniform spectrum like the impulse function. We also introduce a MR imaging based method to measure the spatiotemporal magnetic fields generated after the test pulse.
Introduction
For pulsed field gradient (PFG) experiments, characterizing gradient switching is important for correcting errors in the gradient moments caused by eddy currents and mechanical oscillations. Errors in gradient moments result in image distortions in k-space, and inaccuracies in q-space imaging, especially while measuring both very low diffusivities and flow velocities, which often require fast switching rate. Current methods of measuring switched gradient response typically involve mapping the magnetic field generated following a test gradient pulse through the phase of the FID acquired at different time points after the pulse1. To achieve field localization, either the sample is moved in space or NMR signal is acquired in parallel from several samples arranged in an array2.
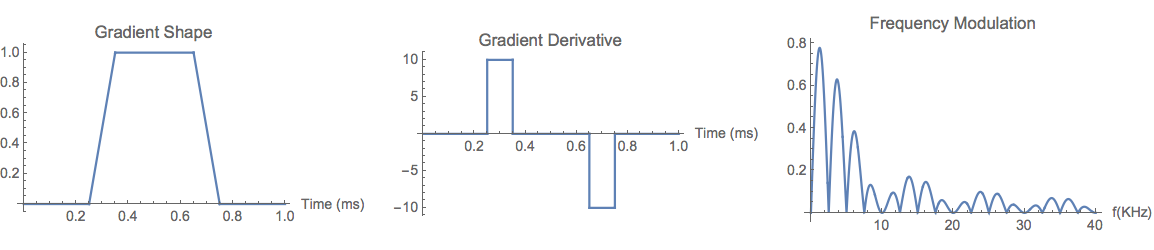
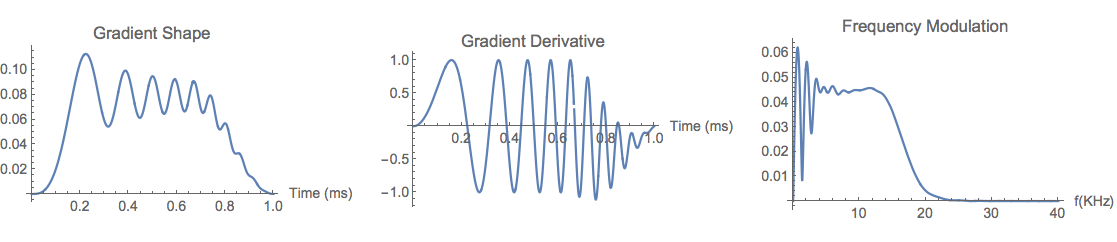
Assuming the gradient system to be linear and time invariant, accurate characterization of the system requires the time derivative of a test gradient pulse mimic that of an impulse function which excite all the gradient eigenmodes uniformly. Current methods described in the literature, use a trapezoidal or triangular pulse, which has a non-uniform sinc type excitation [see Figure 1], adding bias in the measurement. We introduce a new test pulse, called the Fresnel pulse [see Figure 2], whose derivative is a chirp function, which has a uniform spectrum like the impulse function. We also introduce a MR imaging based method to measure the spatiotemporal magnetic fields generated after the test pulse.
Methods
MR measurements were performed using an Oxford 4.7T magnet and Agilent VNMRS console, running VnmrJ 3.1A software, with shielded gradients (Model BFG-200/115-S14, Resonance Research, Inc. Billercia, MA) and 38 mm ID quadrature birdcage transmit/receive coil. A 3D fast low angle shot (FLASH) gradient echo imaging sequence was modified by adding a test gradient pulse with a variable delay time before RF excitation [see Figure 3]. Zeroing the pre-emphasis unit and using a 28 mm DSV sample filled with distilled deionized water, the sequence was used to characterize the X-gradient with the following imaging parameters; TR/TE: 450/0.3 ms, flip angle: 16o, matrix size: 32 x 16 x 16, field of view: 32 mm x 32 mm x 32 mm, Fresnel gradient peak amplitude/ duration: 500 mT/m, 4 ms, and delay times ranged from 0 to 4 ms in steps of 0.1 ms. For a given delay time, two measurements were acquired with opposite test gradient polarities to account for non-eddy current related phase changes.
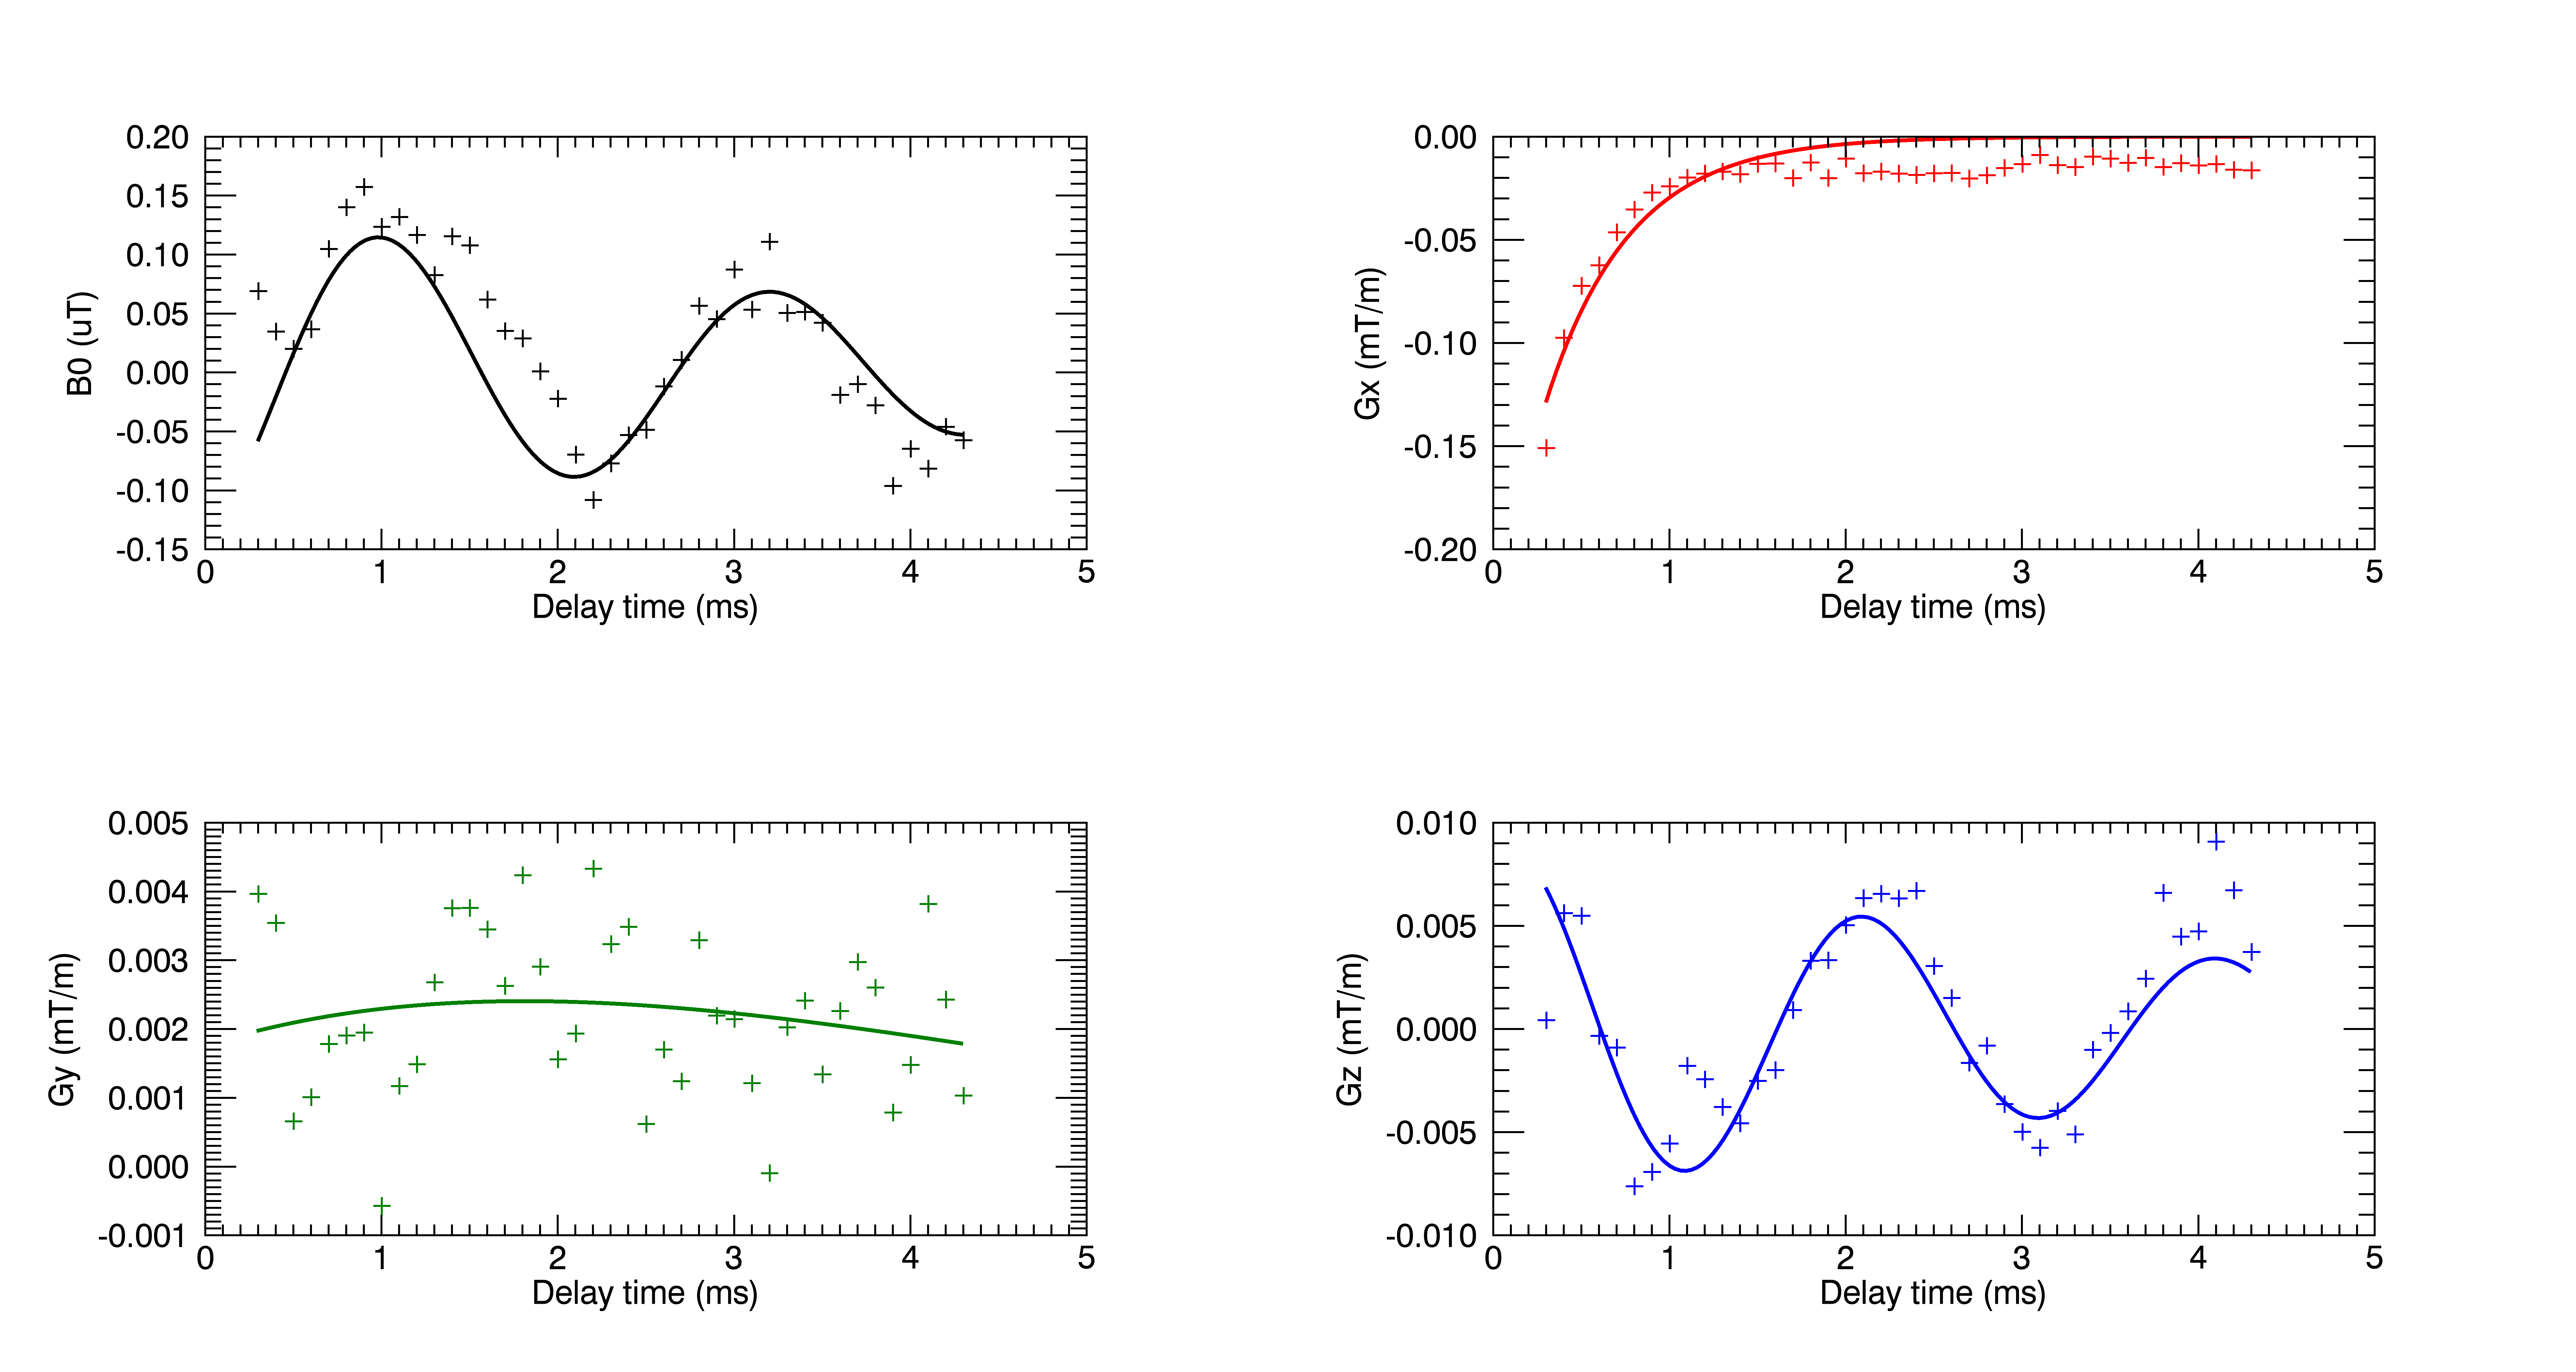
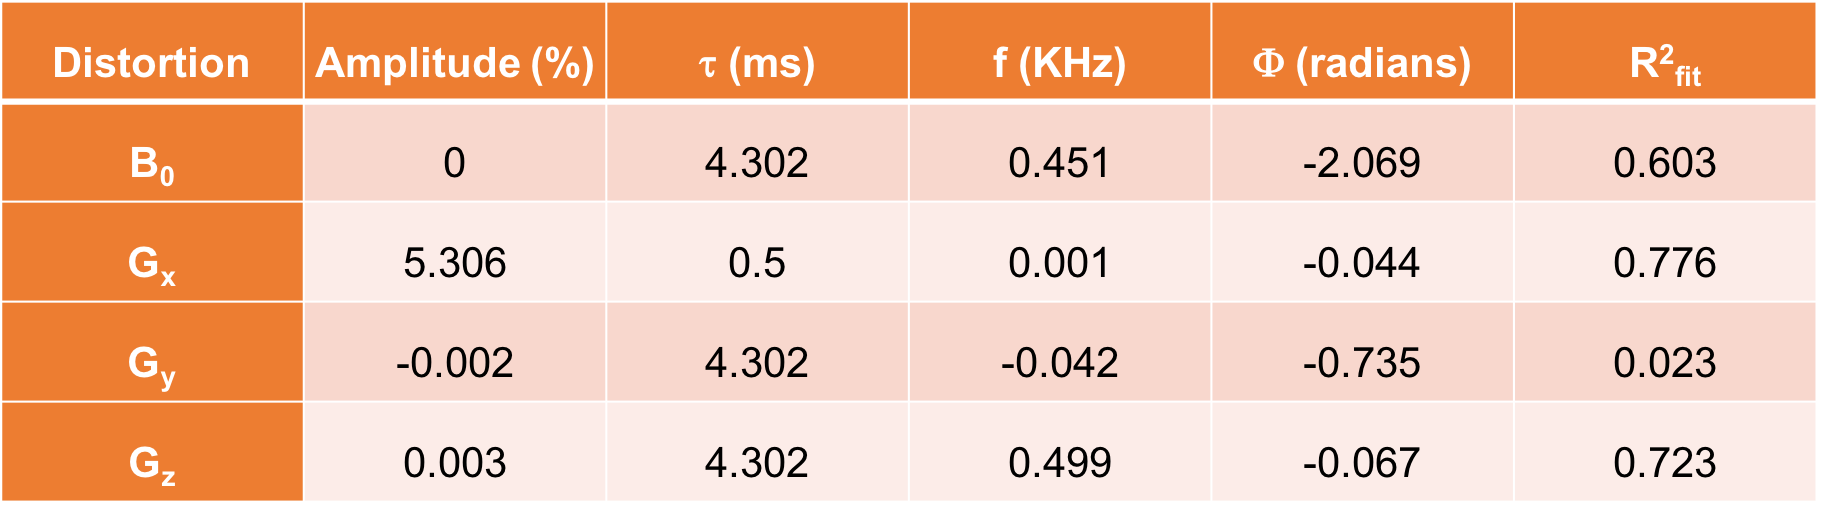
A 3D time varying eddy current magnetic field map was obtained from the phase resulting from complex dividing the two-opposite gradient-polarity images acquired at each delay time. The resulting magnetic field was fit to a trilinear equation in space to account for the constant and gradient fields generated after the test pulse whose strengths were then fit to a decaying oscillatory multi-exponential model in time to obtain the eddy current amplitudes/time constants and mechanical resonance frequencies. Fitting was constrained so that the smallest time constant is greater than or equal to 1/bandwidth of the Fresnel pulse. The time constants were successively added to the multi-exponential model until the statistical significance of the added parameters is negligible as determined by the statistical F- test.
Results & Discussion
In Figure 4, the modeled time-dependence of the fields generated after the Fresnel pulse on X-axis is shown with the results of the model fit in Table 1. The results show eddy currents mainly on the pulsed axis with a time constant of 0.5 ms, and low amplitude mechanical oscillations at roughly 500 Hz. The mechanical oscillations on the direct term was not captured in the model perhaps due to parsimonious fitting.
Conclusion
We have presented a method to characterize gradient switching by uniform band-limited excitation of eigenmodes using Fresnel shaped gradient pulse. It is an important step in reducing eddy current artifacts in PFG experiments measuring very slow diffusion and flow. Applying optimal pre-emphasis to the gradient amplifier control, measurement of the remaining residual eddy current response will allow further improvements through the design of the pulsed gradient waveform to overcome these residual eddy currents.Acknowledgements
A portion of this work was performed in the Advanced MRI/S (AMRIS) Facility at the McKnight Brain Institute of the University of Florida, which is part of the National High Magnetic Field Laboratory (supported by National Science Foundation Cooperative Agreement DMR-1157490, the State of Florida, and the U.S. Department of Energy). In addition, this work is supported in part by the NIH/NCATS Clinical and Translational Science Award UL1 TR000064.References
1. Bernstein, M. A., King, K. F. & Zhou, X. J. Handbook of MRI Pulse Sequences. (Elsevier, 2004)
2. Vannesjo, S. J. et al. Field camera measurements of gradient and shim impulse responses using frequency sweeps. Magn. Reson. Med. 72, 570–583 (2014).
Figures