1742
Low cost Earth Field NMR Spectrometer with improved Shimming (LESS)1MIRC, Dayananda Sagar Institutions, Bengaluru, India, 2Department of Radiology, Columbia University Medical Centre, New York, NY, United States
Synopsis
A simple, portable and
Purpose
To demonstrate a simple, cost-effective and Do It Yourself (DIY) EFNMR spectrometer to enable understanding of MR physics in an academic environment.Introduction
In this work, we describe improvements to a simple earth’s field NMR spectrometer1, by inclusion of active shim coils. Results of the commercially available Terranova-MRI EFNMR system2 were used as a benchmark for the low cost EFNMR spectrometer. The current implementation replaces the expensive specialized components3 with inexpensive simple instrumentation designed using laboratory available components1.Methods
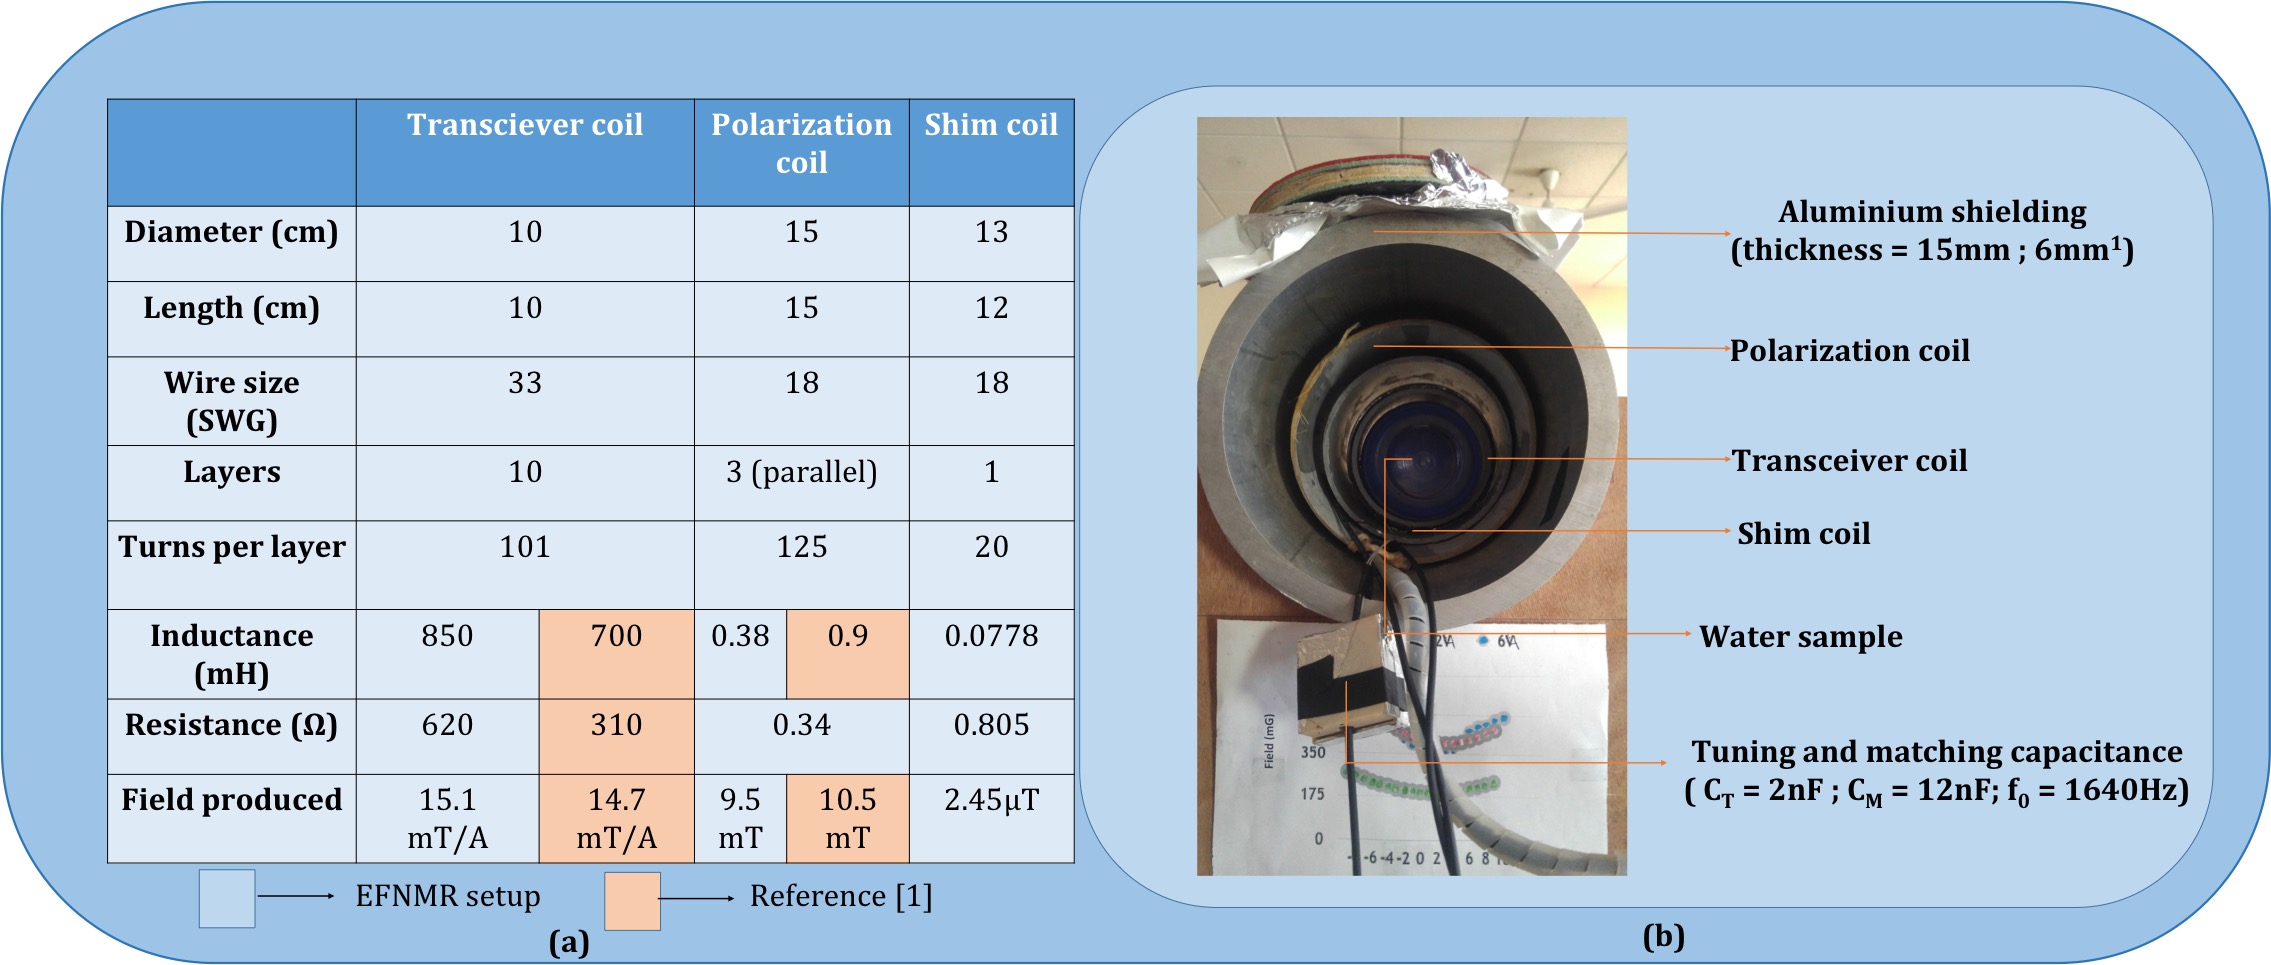
The block diagram of the EFNMR setup along with the cost of the components has been shown in figures 1a and 1b respectively. The three main signal chains in the system include the polarizer along with the polarization coil, transmitter driver with the transceiver coil, and the receiver that is a low noise amplifier. The construction details of the coils have been shown in figure 2a. An Arduino UNO that acted as the signal transmitter and the signal processor controlled the entire system. The switching between the transmitter and the receiver was utilized through a relay circuit that consisted of COTO1123 (8L series) relays. The code for pulsing the Arduino and the user interface for visualizing the FID was utilized from the open source repository1. The circuits, PCB layouts and instructions utilized for the construction of this spectrometer are available online4.
Transmitter: The transceiver coil driver was designed using op-amps LF411CN8 had a first stage that combines the positive and negative pulses generated by the Arduino UNO. The combined pulses were smoothened into sinusoid by a low pass filter in the second stage. The third stage had a variable gain-inverting amplifier whose output ranges from 3-30V (11.1mW to 111mW) at 1512Hz. The 3V output from the transmitter generated a field of 15.1mT/A from the transceiver coil.
Polarizer: The polarizer driver provided 12A current necessary to produce 9.5mT from the polarizing coil via a pair of MOSFETs with biasing from a 9V battery. An opto-isolator was used to drive the MOSFETs, which connects one side of the coil to ground as soon as the polarizer turned off with a time constant of 7.5ms. The polarization on and off times was 3s respectively (50% duty cycle) to avoid heating the polarization coil thus avoiding heating the water sample.
Receiver: The receiver circuit consisted of op-amps (LT1007CN8) and had a non-inverting amplifier at the first stage with a gain of 100. This was followed by an inverting band pass filter stage with a gain of 10 and bandwidth of 200Hz from 1500Hz to 1700Hz. The final stage was an inverting amplifier with a gain of 100. The low noise amplifier amplifies the 1.89μV from the sample to 30mV with amplification factor of 10000. Diodes were used before the first stage of the LNA to eliminate DC spikes during reception.
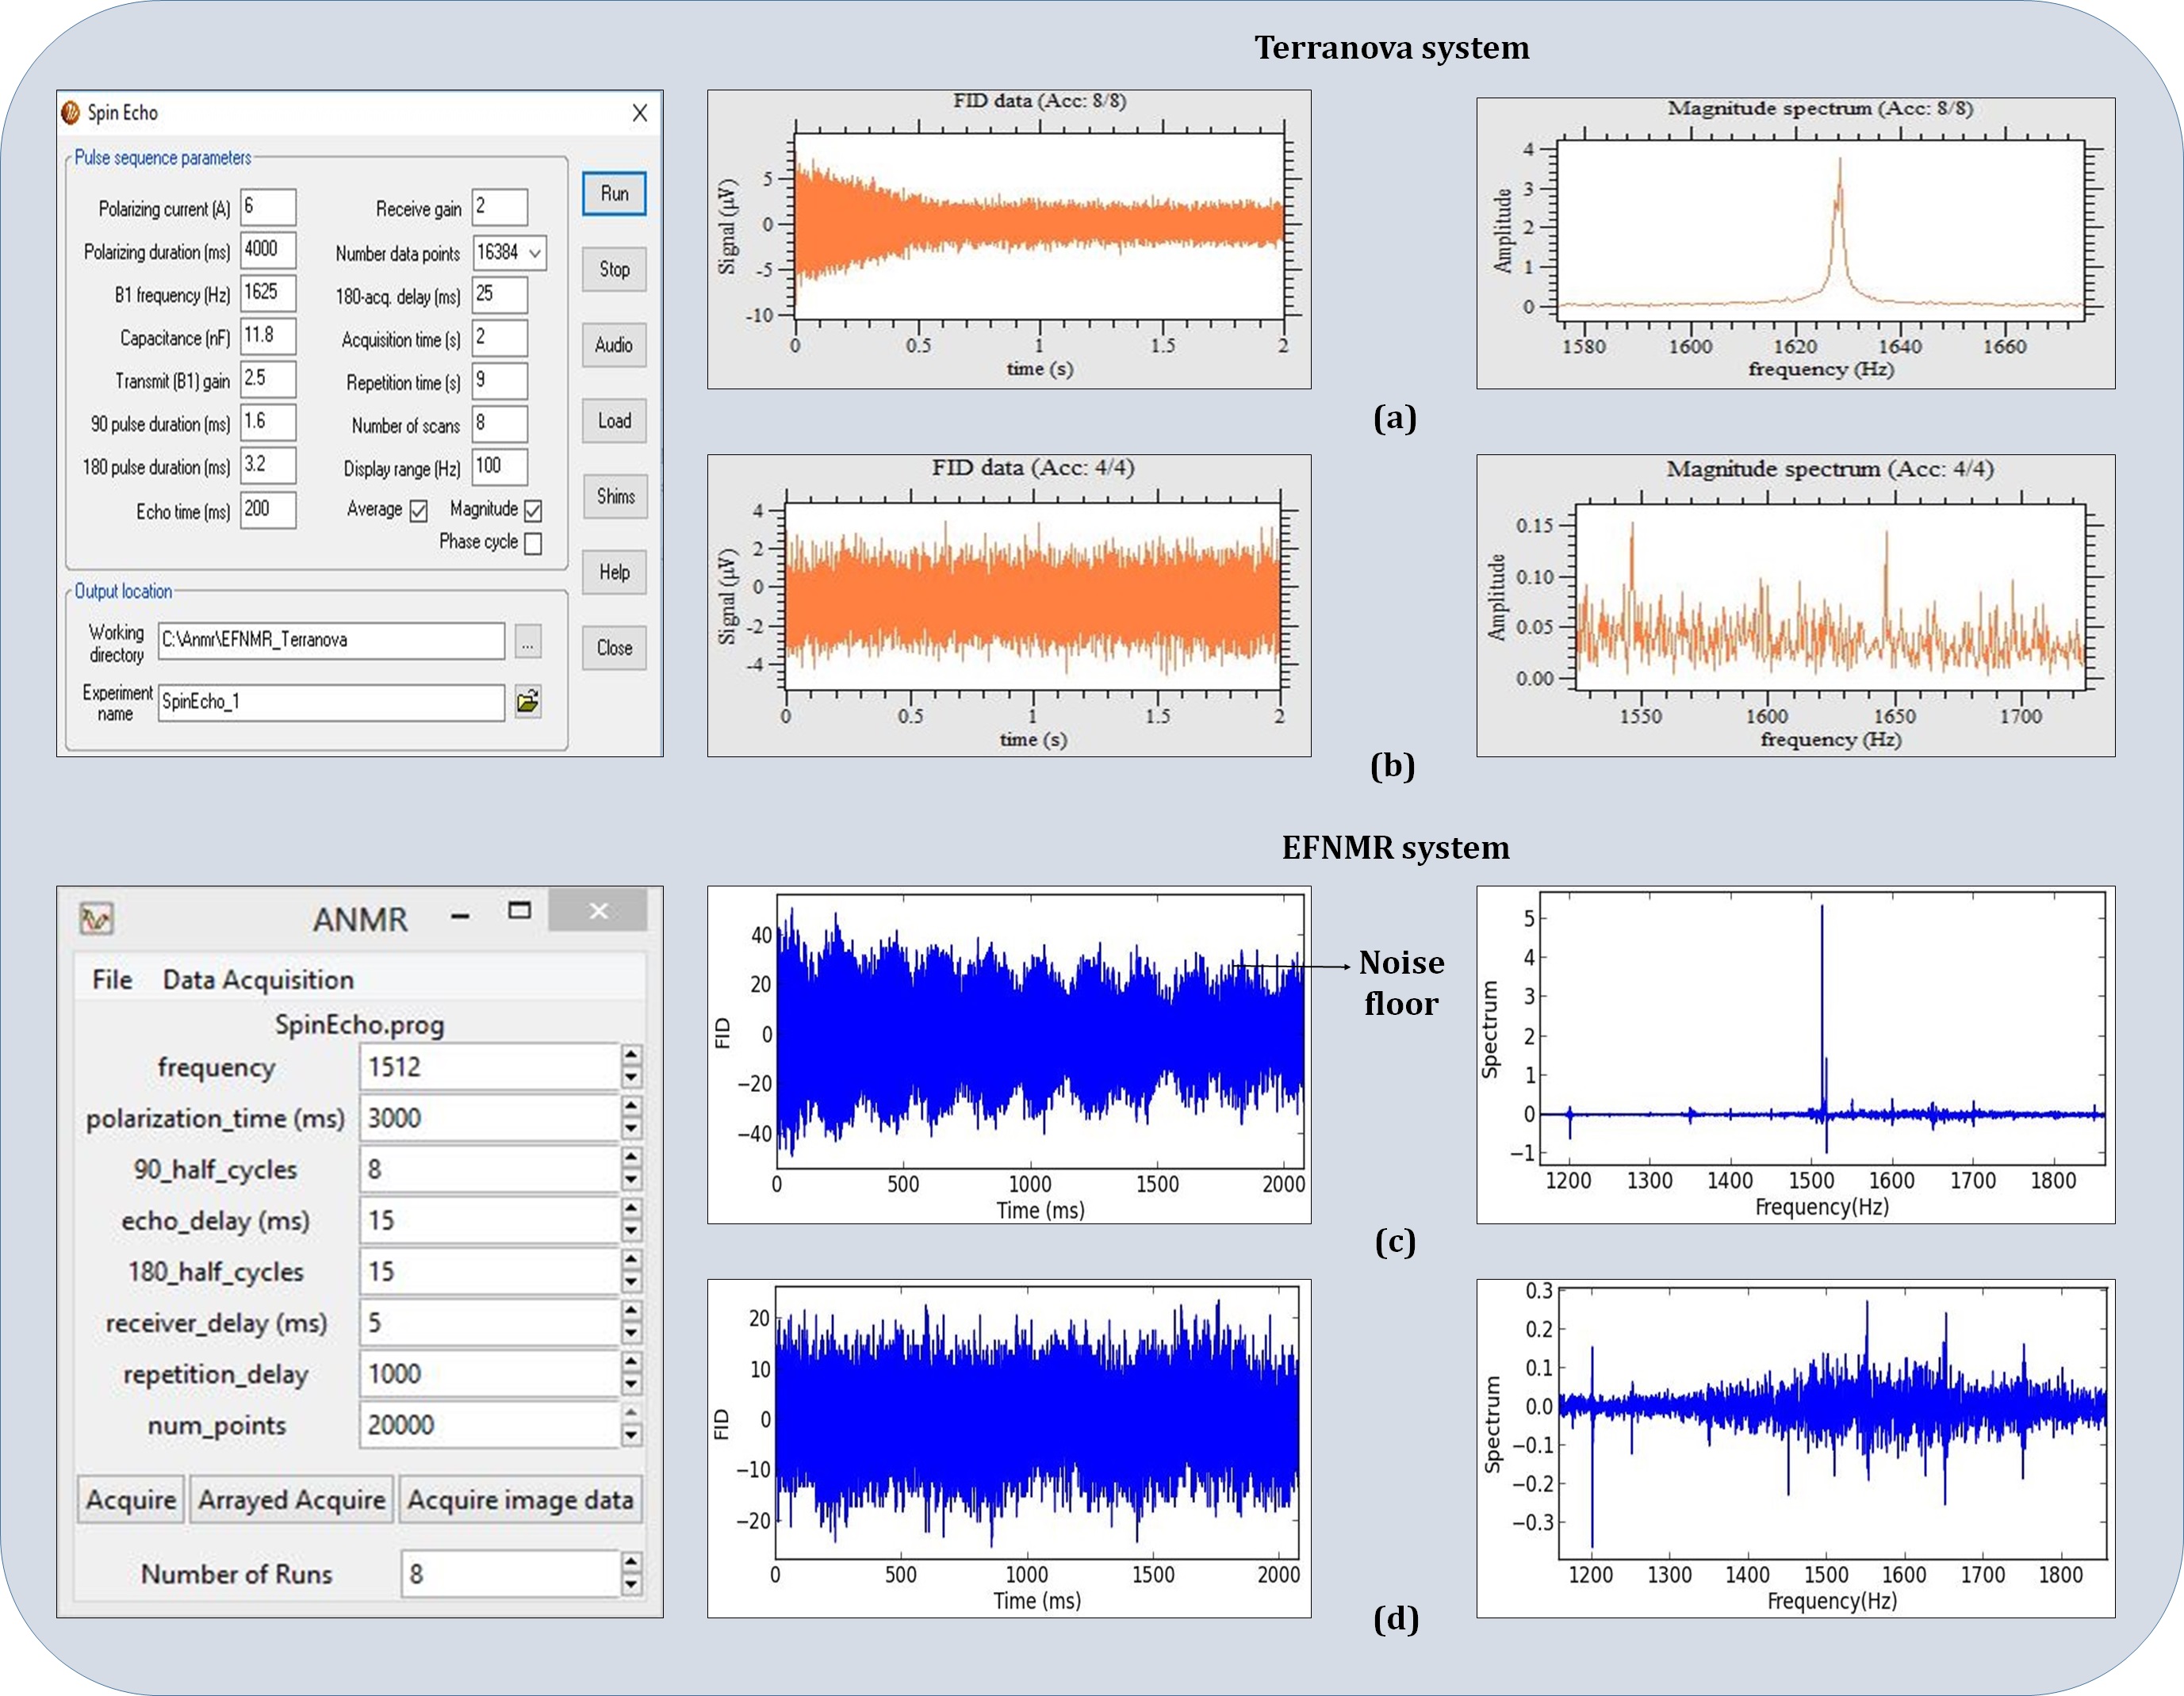
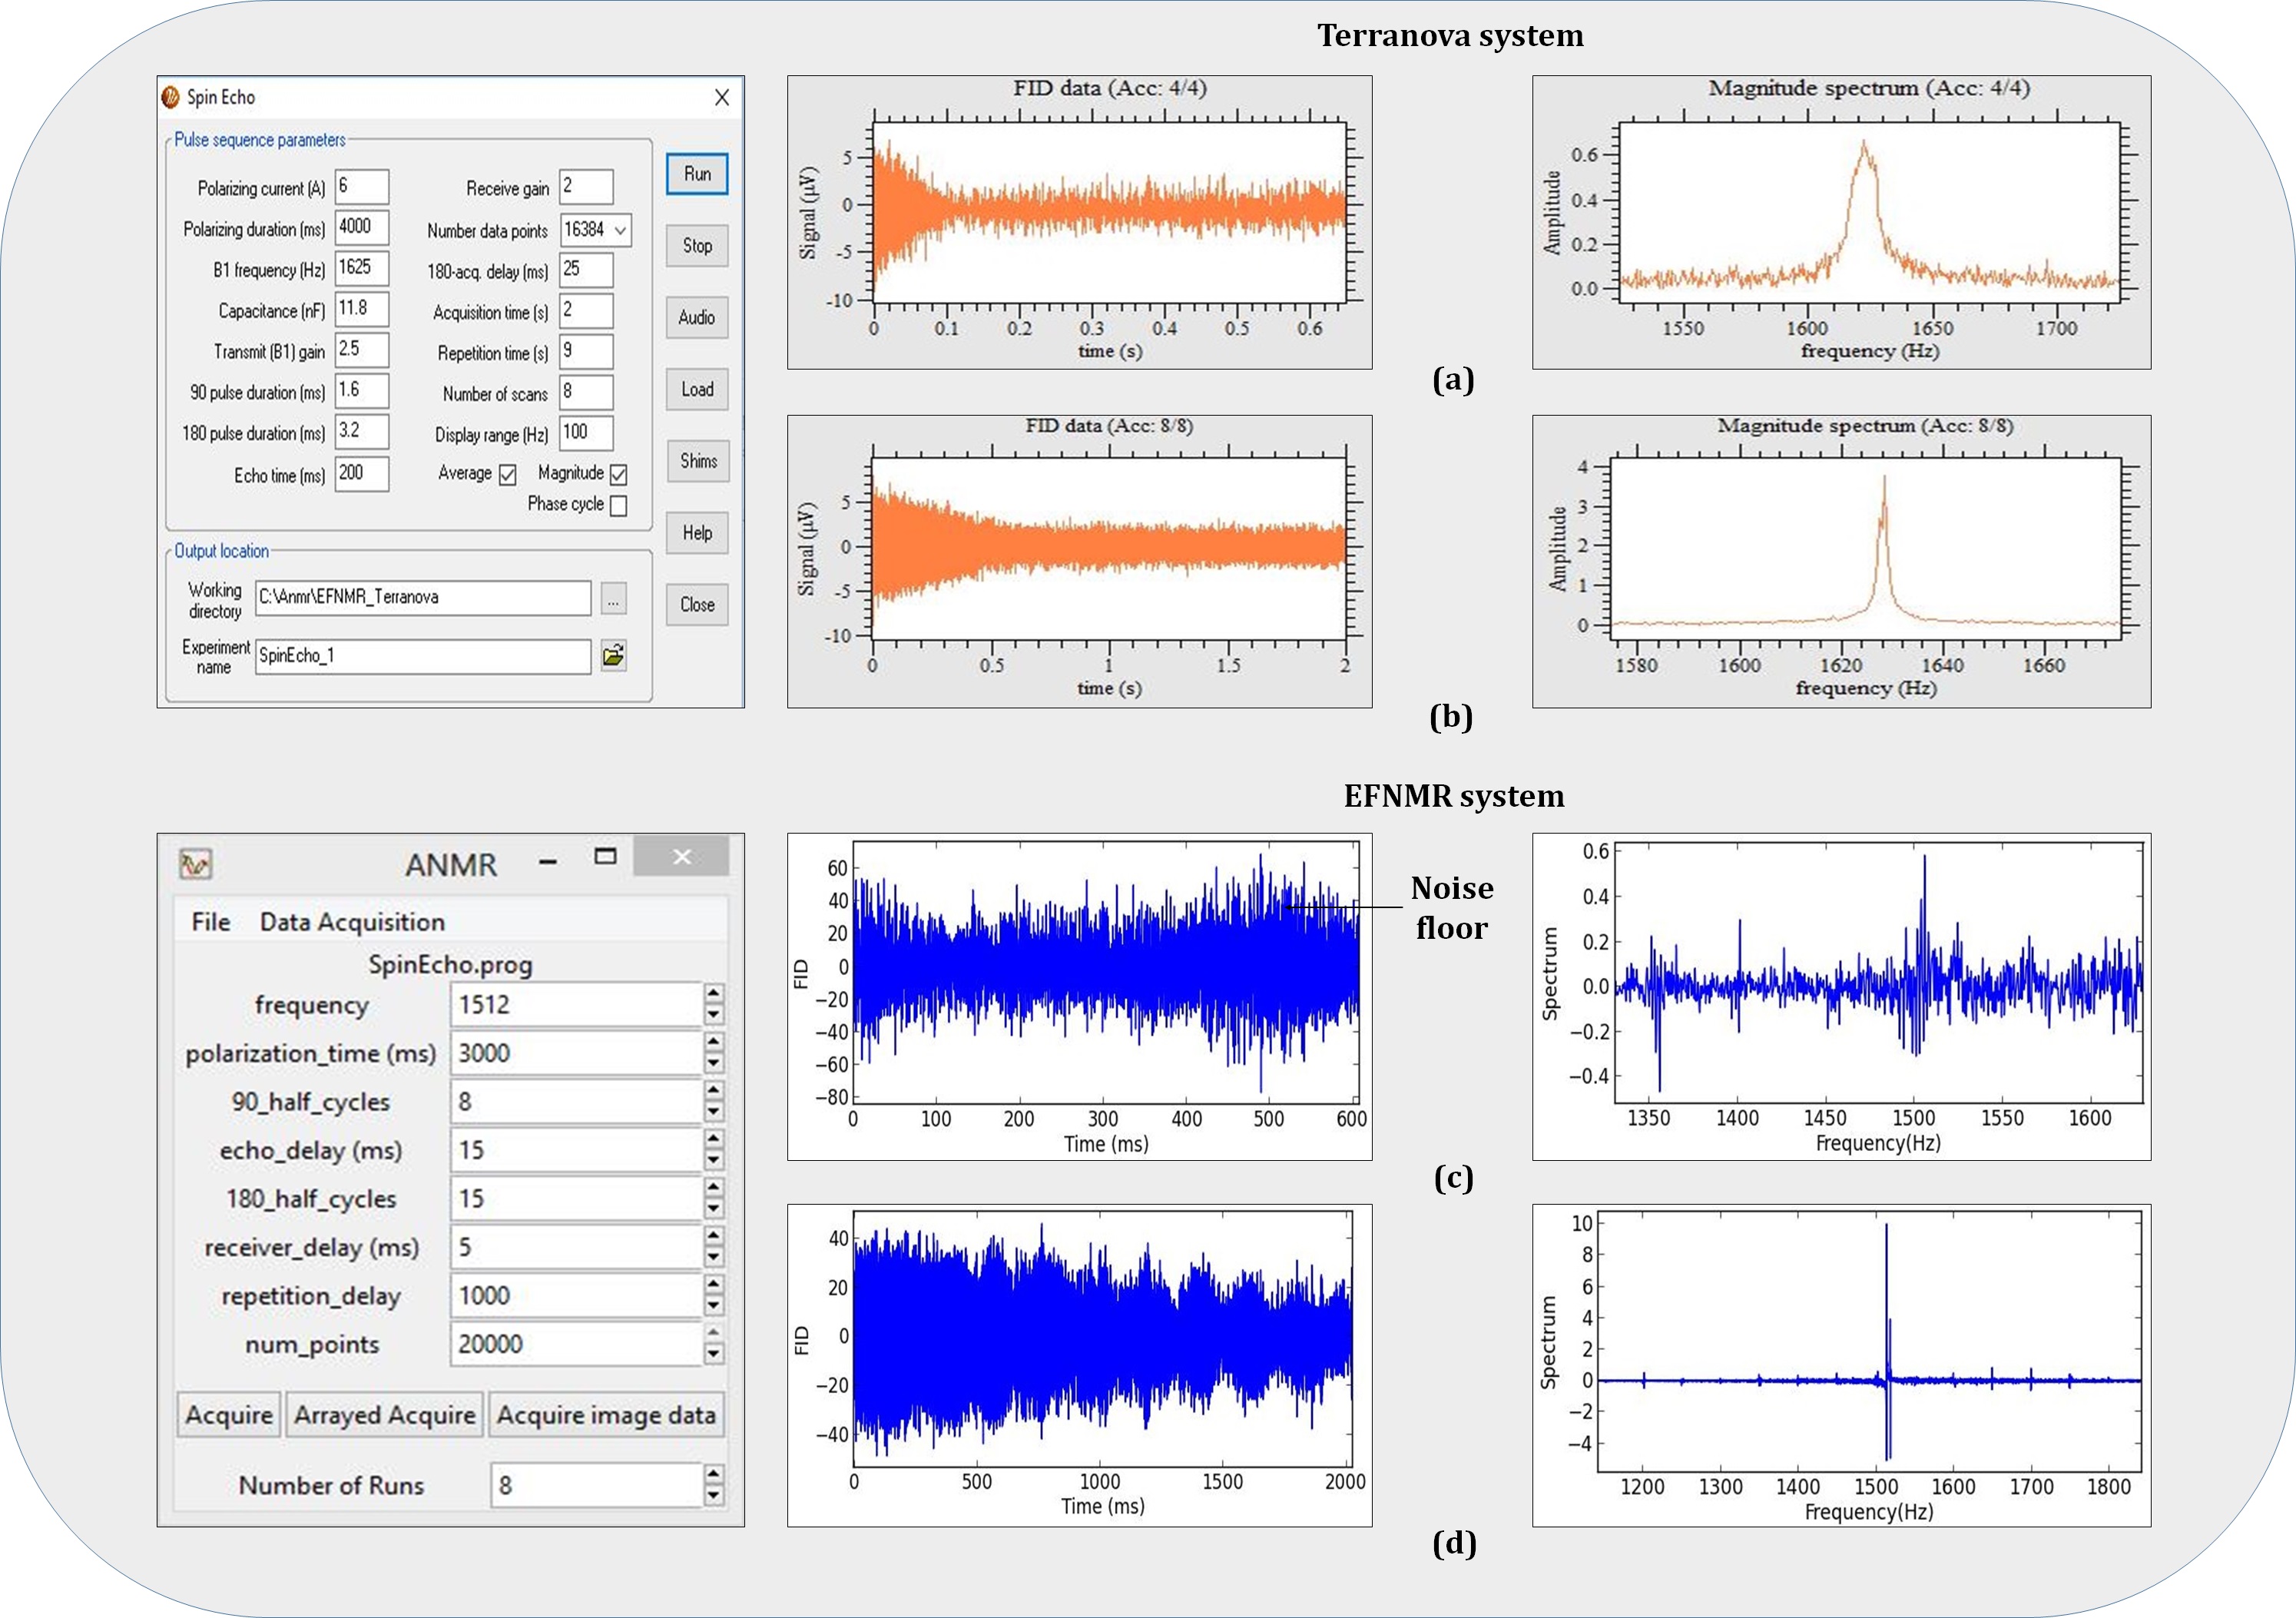
Experimental setup: The experimental coil setup of the EFNMR spectrometer has been shown in figure 2b. The experiment included obtaining an FID and its corresponding spectrum from the water sample at 1512Hz for a spin echo sequence with eight averages. The acquisition parameters are detailed in figure 3c. Small iron rods were utilized to increase B0 homogeneity. This was then replaced by inserting two shim coils to improve field homogeneity. Each experiment was repeated for two trials.
Results
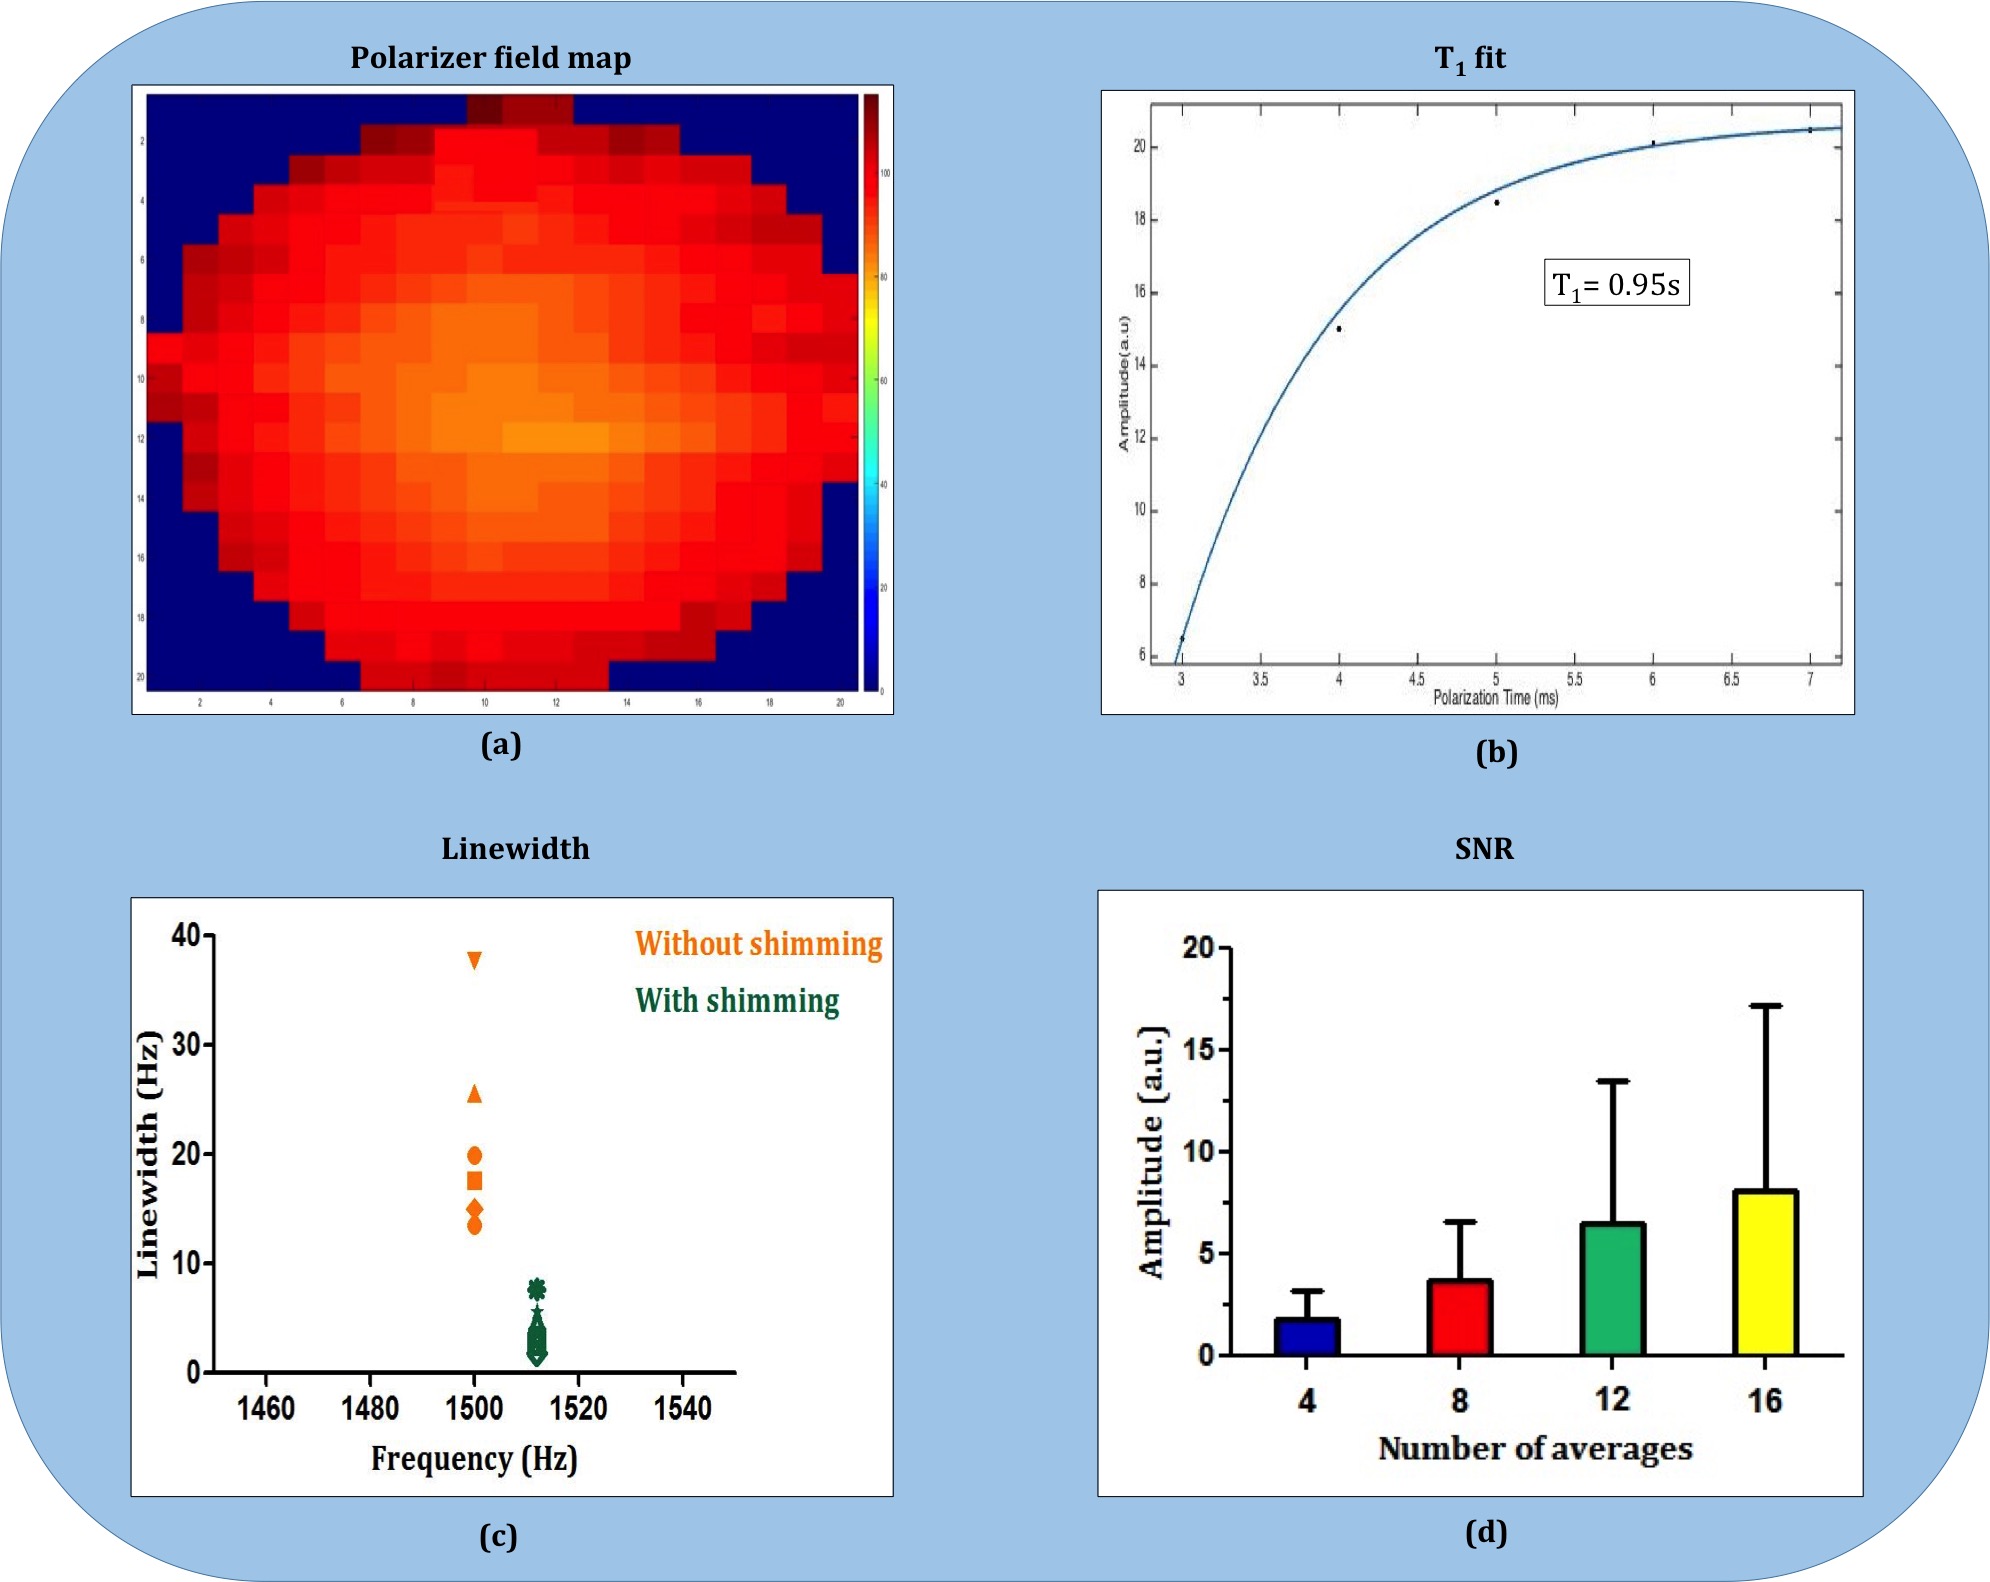
The FID and its spectrum for the water sample were observed. The FID decay time was 2000ms with amplitude of 5a.u. at 1512Hz. The line width decreased from 14.97±5.33Hz to 11.44±3.91Hz after passive shimming. The FID and spectra obtained from Terranova system and EFNMR spectrometer for spin echo sequence with and without the sample have been shown in figure 3. FID of active shimming reduced the line width from 14.97±5.33Hz to 1.78±0.88Hz as shown in figure 4d. The T1 of tap water was measured with variable polarization times from 3s to 7s resulting in the T1 of 0.95s. Enhancement of the signal intensity achieved due to longer polarization times has been shown in figure 5b.Discussion and Conclusion
It is critical to ensure that the polarizer shorting time be less than 10ms seconds in order to visualize the decay of the FID (matched with the inductance of the coil). The entire system had to be well tuned to obtain the FID as the noise at 50Hz and 1200Hz were predominant before fine-tuning. The current work involves improving the signal-to-noise ratio using active shimming. The future work is to adapt Simultaneous Transmission And Reception in full duplex mode with low RF power requirements5.Acknowledgements
- This work was supported by Vision Group on Science and Technology (VGST), Govt. of Karnataka, Karnataka Fund for strengthening infrastructure (K-FIST), GRD#333/2015.
- This research was supported by Ministry of Electronics and Information Technology, “National Mission on Indigenous MRI” 1(15)/2014-ME&HI, Department of Science and Technology (DST), grant# DST/TSG/NTS/2013/100-G and DST/VGST/KFIST/LII/GRD333 for support.
- We thank Prof. Carl Michal, Associate professor, Department of Physics and Astronomy, University of British Columbia, for his inputs to improve the system.
References
- Michal, Carl A. "A low-cost spectrometer for NMR measurements in the Earth's magnetic field." Measurement Science and Technology 21.10 (2010): 105902.
- Magritek limited. 2006. Terranova-MRI: hands on learning MRI & NMR principles, User manual. www.magritek. Com
- Callaghan PT, Eccles CD, Haskell TG, Langhorne PG, and Seymour JD. “Earth’s field NMR in Antarctica: A pulsed gradient spin echo NMR study of restricted diffusion in sea ice”, Journal of Magnetic Resonance, 133 148–54, 1998.
- https://github.com/mirc-dsi/IMRI-MIRC/tree/master/MR%20HARDWARE/DOCS/EFNMR
- Sung–Min Sohn, J. Thomas Vaughan, RusselL Lagore, Michael Garwood, Djaudat Idiyatullin, "In vivo MR imaging with simultaneous RF transmission and reception." Magnetic resonance in medicine 76.6 (2016): 1932-1938.
Figures