1731
A Tool For Rapid Power Analysis for Arbitrary Circular Surface Coil Near Arbitrary Spherical Sample at Any Frequency1Radiology, Center for Advanced Imaging Innovation and Research (CAI2R), New York, NY, United States, 2Radiology, Bernard and Irene Schwartz Center for Biomedical Imaging, New York, NY, United States
Synopsis
We present a tool to quickly estimate the noise induced by the resistance of a surface coil and the noise induced by the coil in a sphere. The tool relies on two analytical solutions, and results depend on many parameters. We show plots of the dissipated power in the sample and the coil as function of some of these parameters such as the diameter of the coil, the distance of the coil from the sphere and the wire diameter of the coil. The tool can be useful in the design process of coils, especially dense receive arrays.
Purpose
To develop a tool to quickly estimate the power dissipated in an arbitrary spherical sample and circular surface coil for evaluating the balance of sample and coil noise in MRI at any frequency.Introduction
For a given sample and coil, the proportionality between the frequency of the $$$B_1$$$ field the strength of $$$B_0$$$ results in big differences in the RF fields distribution between low-field and high-fields MRI systems. At low fields, the $$$B_1$$$ field distribution and noise levels are more dependent on the coil than the sample. In fact, at very low fields the magnetic field $$$B_1$$$ is quasi-static, and the induced electric field is very low. At higher fields, the $$$B_1$$$ fields tend to propagate in the sample more like a wave, and the electric field becomes more significant, so that in the computation of SNR the noise is more strongly related to the electric fields in the sample (resulting in sample noise dominance), while in low-field systems the coil resistance may be the only significant contributor to noise (coil noise dominance). The noise related to the coil resistance increases with frequency with $$$f^{1/4}$$$ due to variation in skin depth with frequency, while the noise related to the sample increases with $$$f$$$ 1,2. Frequency is not the only parameter which determines the balance between coil noise and sample noise. Noise is also conditioned by parameters such as the size of the sample, the size of the coil, the distance of the coil from the sample, etc. For example, Wiggins observed that due to the small coil size in a 96-element head array, the impact of coil noise resulted in a reduction of SNR deep within the sample compared to SNR of arrays with fewer, larger coils3. In this work, we utilize analytical solutions to rapidly estimate the noise induced by the resistance of the coil and the noise induced by the sample for a surface coil near a sphere. We use these methods to estimate the variation of the noise according to different parameters.Methods
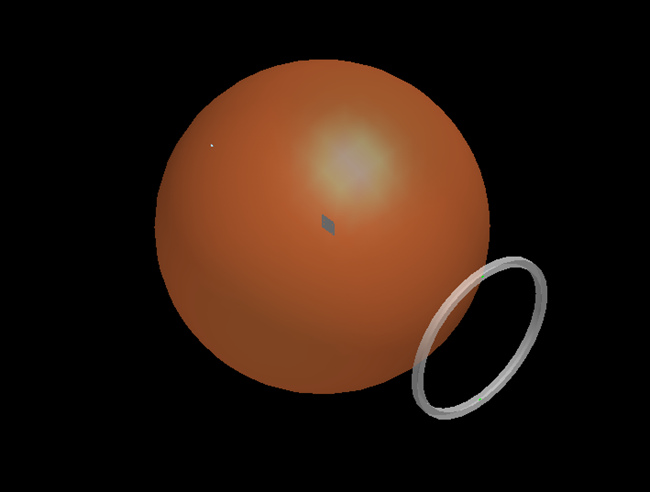
The noise induced by the sample is proportional to the square root of the power dissipated in the sample. A method to estimate the power loss in a spherical sample per unit current in a circular surface coil (Fig. 1) was provided by Keltner4. The computed power depends on the operating frequency, the radius and the dielectric properties of the sphere, the distance of the coil from the center of the sphere and the radius of the surface coil. We validated our implementation of this analytical solution with the numerical commercial software XFDTD (Remcom). The noise induced by the coil resistance is computed by estimating the resistance per unit length in the coil. Considering that for good conductors used in MRI and for frequencies in the order of MHz the skin depth is much smaller than the cross section of the coil, we estimate the resistance by approximating the effective cross-sectional of the conductor as having width equal to the perimeter and thickness equal to the skin depth. We have developed a tool to estimate the two noise contributions with the commercial software Matlab (The Mathworks), and we have computed and plotted the two contributions by varying three parameters: the diameter of the coil, the distance of the coil from the sample, and the diameter of the wire of the coil.Results and Discussion
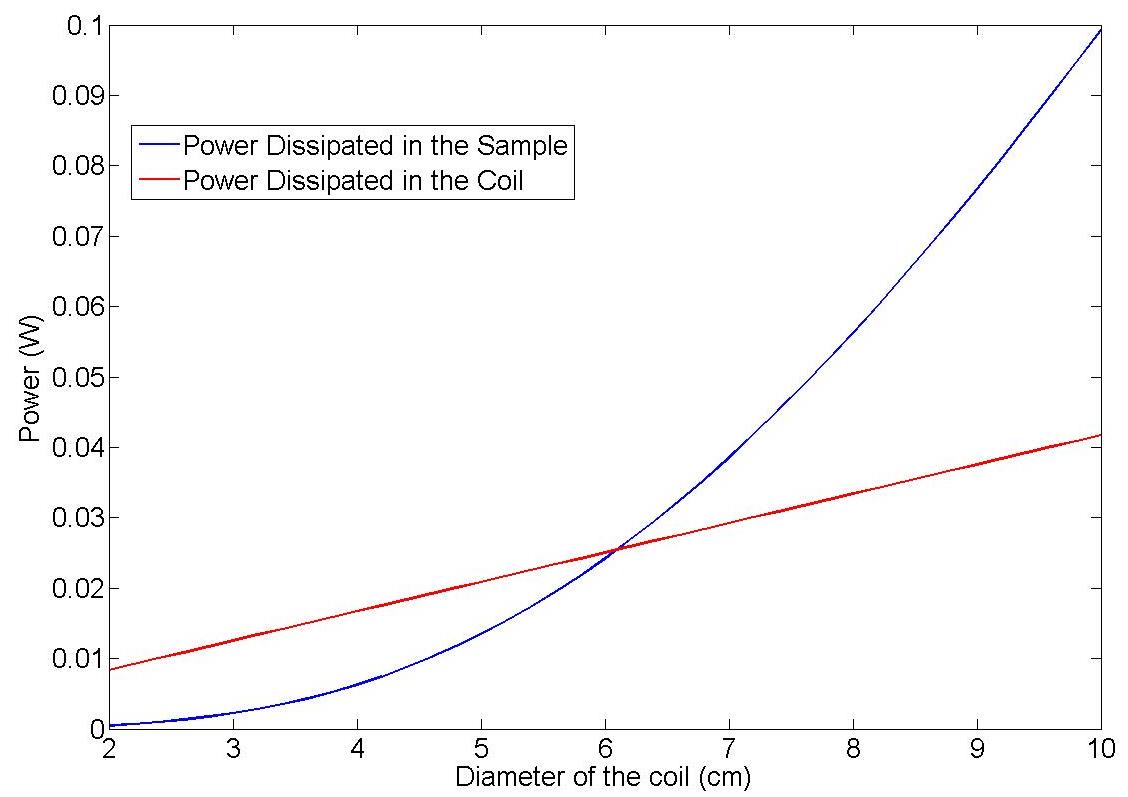
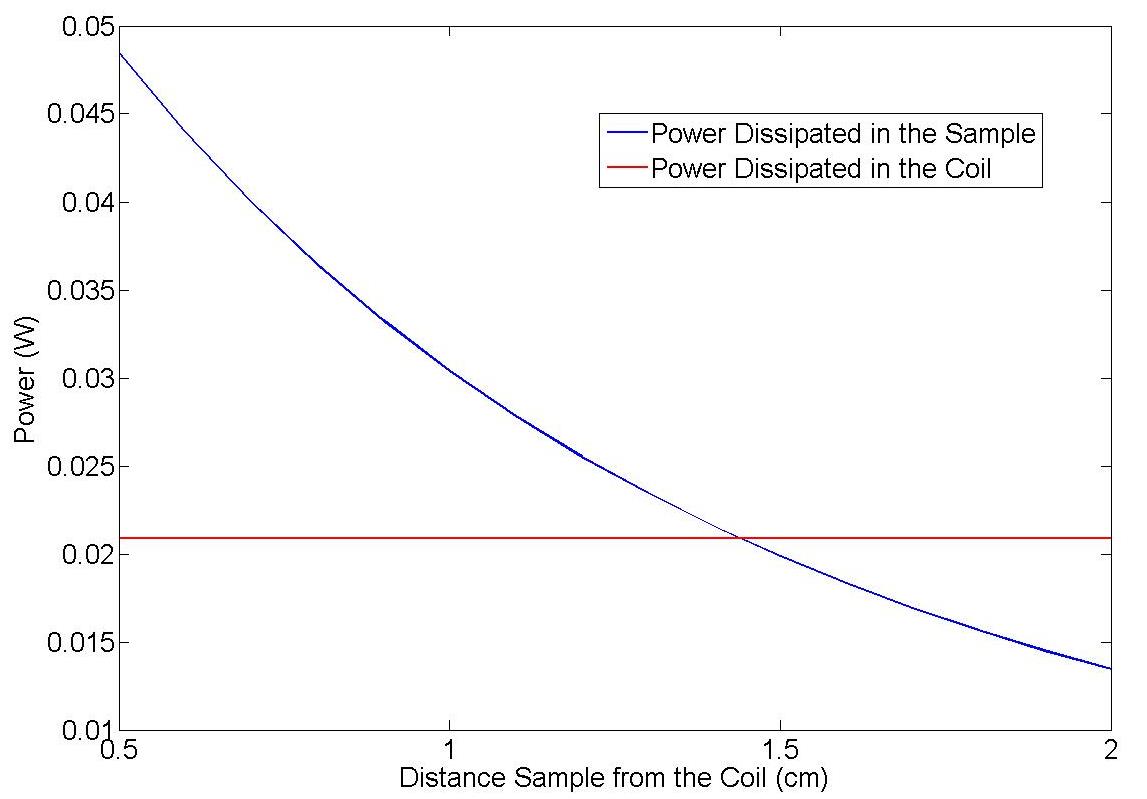
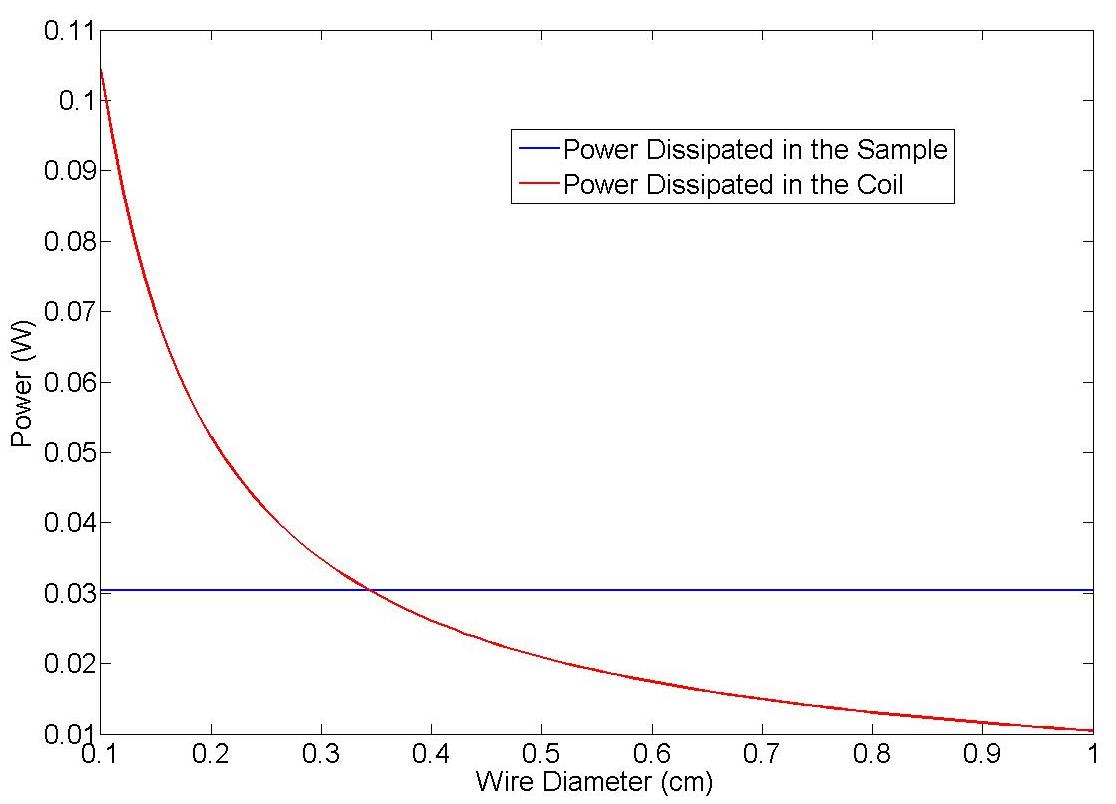
For a frequency of 64 MHz, the power dissipated in the sample and in the coil as functions of the coil diameter are shown in Fig. 2, as a function of the distance of the coil from the sample are shown in Fig. 3, and as a function of the diameter of the wire of the coil are shown in Fig. 4. In each plot many parameters need to be set, and the reported plots can change depending on the value assigned to the other parameters. The tools developed can be used in the design process of coils, including dense receive arrays. For example, the tool can be used to determine the minimum size of coil that will still allow for sample noise dominance, which affects the arrangement and the number of coils of an array of a given overall geometry (e.g., surrounding the head or covering the torso). The tool will be publicly available on the website of our institution.Acknowledgements
No acknowledgement found.References
1. Hoult DI, Richards RE. The signal-to-noise ratio of the nuclear magnetic resonance experiment. Journal of Magnetic Resonance (1969). 1976 Oct 1;24(1):71-85.
2. Myers W, Slichter D, Hatridge M, Busch S, Mößle M, McDermott R, Trabesinger A, Clarke J. Calculated signal-to-noise ratio of MRI detected with SQUIDs and Faraday detectors in fields from 10μT to 1.5 T. Journal of Magnetic Resonance. 2007 Jun 30;186(2):182-92.
3. Wiggins GC, Polimeni JR, Potthast A, Schmitt M, Alagappan V, Wald LL. 96‐Channel receive‐only head coil for 3 Tesla: design optimization and evaluation. Magnetic Resonance in Medicine. 2009 Sep 1;62(3):754-62.
4. Keltner JR, Carlson JW, Roos MS, Wong ST, Wong TL, Budinger TF. Electromagnetic fields of surface coil in vivo NMR at high frequencies. Magnetic resonance in medicine. 1991 Dec 1;22(2):467-80.
Figures