1697
A 32-Channel Array Coil for Bilateral Breast Imaging and Spectroscopy at 7T1Biomedical Engineering, Texas A&M University, College Station, TX, United States, 2Electrical and Computer Engineering, Texas A&M University, College Station, TX, United States, 3Radiology, UT Southwestern Medical Center, Dallas, TX, United States, 4Advanced Imaging Research Center, UT Southwestern Medical Center, Dallas, TX, United States, 5Philips Medical Systems, Cleveland, OH, United States, 6Internal Medicine, UT Southwestern Medical Center, Dallas, TX, United States
Synopsis
This work describes the design, construction, and performance of a 32-channel array coil for bilateral breast imaging at 7T. Imaging indicated an increase in average SNR over a T/R volume coil of 5.5 times, with a three times increase in the center and up to 20 times along the periphery. Channel noise correlations indicated well decoupled elements and highly unilaterally isolated sets of 16 elements. In combination with high field strength benefits, this array will enable high resolution accelerated breast imaging.
Introduction
Imaging and spectroscopy of the breast at 7T is of particular interest due to the improvement in spatial and spectral resolution at higher magnetic fields, and the additional use of array coils has been shown to provide the acceleration necessary for DCE studies1-7. This work describes an extension of a previously reported unilateral array design to a bilateral 32-channel receive array and modified bilateral transmit coil8-9. To the authors’ knowledge, this is the highest channel count breast coil in use at 7T.Methods
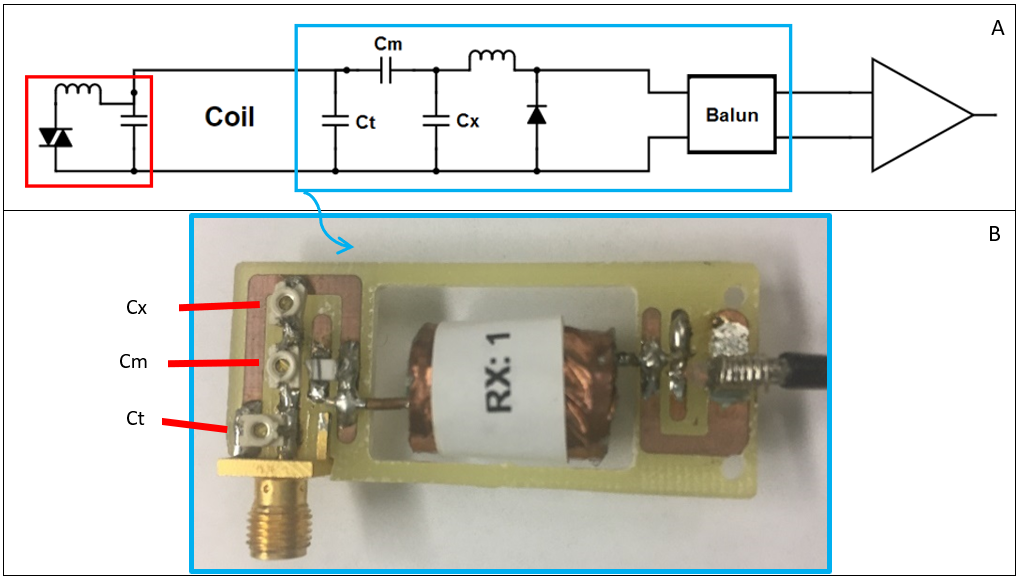
Individual elements of the 32-channel bilateral array were printed on flexible copper-clad FR-4 and mounted on a 3D printed coil former with etchings on the surface to ensure proper placement and mechanical stability of each element. The sizing and overlap of the coils on the former was based on the “soccer-ball” geometry presented by Wiggins et al. to straightforwardly achieve geometric decoupling between neighboring elements10. Each element has six symmetrically oriented breaks: four out of six breaks with fixed capacitors (Passive Plus, 1111C Series), one with a variable capacitor as part of the passive detuning network (Sprague-Goodman, SGC3100NM), and one with an SMA connector (which attaches to its corresponding detachable printed circuit board). On each detachable board, there are variable tuning and matching capacitors (Sprague-Goodman, SGC3100NM), an active detuning network, and a balun. The detachable configuration allowed for straightforward insertion of the array into the transmit coil and allowed for simplified initial tuning of the individual elements, as disconnecting the boards detunes the elements. A schematic of the coil and detachable board circuitry are shown in Fig. 1a and Fig. 1b. The transmit coil was a forced-current-excitation (FCE) driven quadrature Helmholtz-saddle bilateral configuration that was modified from previous work to accommodate the cabling and additional circuitry of the 32-channel array9,11.
S11 and Q measurements were recorded for each receive element in a “practical” configuration by actively detuning the other elements. For imaging experiments, 32-channel images of a homogenous canola oil phantom were acquired from a whole-body 7T scanner (Achieva, Philips Medical Systems) and compared to T/R images obtained from the FCE volume coil with the array detuned (sequence: THRIVE w/o fat suppression, FOV: 120 mm × 140 mm × 340 mm (AP × FH × RL), resolution: 340× 120, TR = 5 ms, TE=1.68ms). Average signal-to-noise ratios for both coil configurations were calculated by dividing the average signal throughout a defined region of interest by the standard deviation of a noise region outside the phantom. SNR maps for both coil configurations were created by normalizing the images by the standard deviation of the noise. The individual SNR maps were then used to create a SNR comparison map by dividing the coil array SNR map by the volume coil SNR map on a pixel-by-pixel basis. Finally, a 32x32 noise correlation matrix was generated in standard fashion by acquiring noise-only images from each coil with no RF excitation.
Results
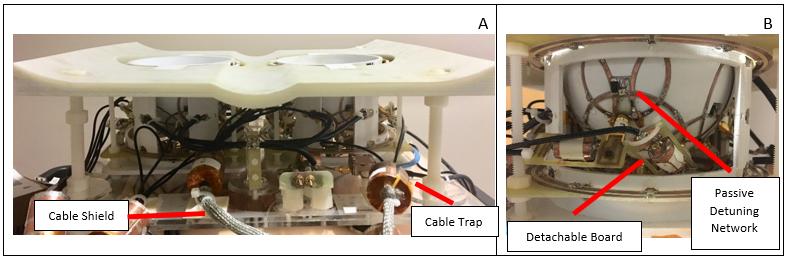
Front and side views of the bilateral 32- channel array inside the transmit coil are shown in Fig. 2a and Fig. 2b, respectively. S11 bench measurements showed matching and tuning better than -15 dB for each coil and an average Q of 46. Additionally, active detuning of all the elements was better than -18 dB.
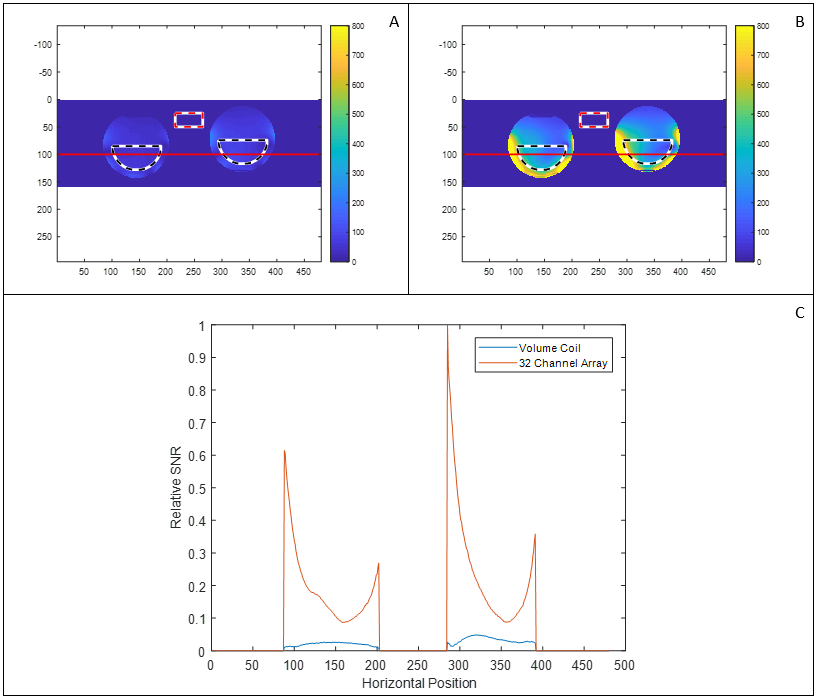
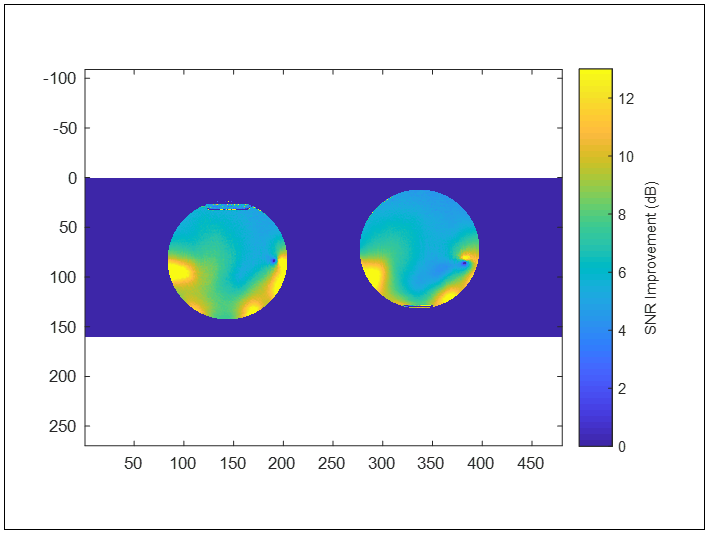
SNR maps for both coils show an average SNR of 60 for the volume coil and an average SNR of 318 for the array coil over the ROI, shown in Fig. 3a and Fig. 3b. A profile taken along the centerline of each SNR map is shown in Fig. 3c and indicates an increase in SNR throughout the phantoms when comparing the volume coil to the 32-channel array with a larger increase in SNR along the periphery near the receive coils, as expected. The comparison SNR map shown in Fig. 4 displays an increase in average SNR of 5.5 times over the signal ROI used in Fig. 3.
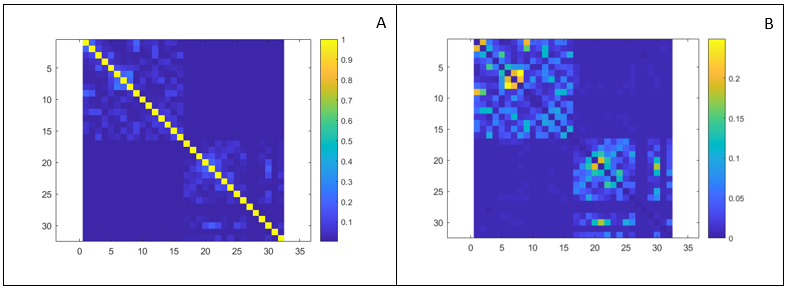
The 32x32 noise correlation matrix shown in Fig. 5 indicated minimal coupling between the receive coil elements and excellent isolation between the two sets of 16 channels. Coils 1-16 (left side of the bilateral coil) have a mean noise correlation of 3% and maximum noise correlation of 19%, while coils 17-32 (right side of the bilateral coil) have a mean noise correlation of 5% and a maximum noise correlation of 25%.
Conclusion
This work has reported the design and construction of a 32-channel receive array for breast imaging at 7T. Significant improvements in SNR using the array and minimal coupling between the receive elements were reported.Acknowledgements
The authors gratefully acknowledge funding for the project given by NIH R21 EB 016394, P41EB015908, and CPRIT RP150456.References
1. Brown R, Megorty K, Moy L, DeGregorio S, Sodickson D, et al. Sub-Millimeter Breast Imaging and Relaxivity Characterization at 7T. In Proc Intl Soc Mag Reson Med 2011;3092.
2. Dimitrov I, Douglas D, Ren J, Smith NB, Webb AG, et al. In vivo determination of human breast fat composition by 1H magnetic resonance spectroscopy at 7T. Magn Reson Med. 2012;67:20–26. doi: 10.1002/mrm.22993
3. Dimitrov I, Madhuranthakam A, Cheshkov S, Seiler S, Goudreau S, et al. BreastView: Isotropic 3D High Resolution T2-weighted Breast Imaging at 7T. In Proc Intl Soc Mag Reson Med 2013;3370.
4. Klomp DW, Dula AN, Arlinghaus LR, Italiaander M, Dortch RD, et al. Amide proton transfer imaging of the human breast at 7T: Development and reproducibility. NMR Biomed. 2013;26:1271–1277. doi: 10.1002/nbm.2947
5. Pinker K, Bogner W, Baltzer P, Trattnig S, Gruber S, et al. Clinical application of bilateral high temporal and spatial resolution dynamic contrastenhanced magnetic resonance imaging of the breast at 7T. Eur Radiol. 2014;24:913–920. doi: 10.1007/s00330-013-3075-8
6. Stehouwer BL, Klomp DW, Korteweg MA, Verkooijen HM, Luijten PR, et al. 7T versus 3T contrast-enhanced breast magnetic resonance imaging of invasive ductulolobular carcinoma: First clinical experience. Magnetic resonance imaging. 2013;31:613–617. doi:10.1016/j.mri.2012.09.005
7. Italiaander M, Voogt I, Kalleveen I, Stehouwer B, Velde T, Luijten P, Boer V, and Klomp D. Uniform bilateral breast MRI at 7T with dual transmit and 30-channel receive. In: Proceedings of the 21st Annual Meeting of ISMRM, Salt Lake City, UT, USA, 2013
8. By S, Rispoli JV, Cheshkov S, Dimitrov I, Cui J, Seiler S, et al. (2014) A 16-Channel Receive, Forced Current Excitation Dual-Transmit Coil for Breast Imaging at 7T. PLoS ONE 9(11): e113969. doi:10.1371/journal.pone.0113969
9. Cui J, Del Bosque R, Dimitrov I, Cheshkob S, McDougall MP, Malloy C, Wright S. Modified Forced Current Excitation Transmit Coil with Receive Array Insert for Bilateral Imaging at 7T. In: Proceedings of the 25th Annual Meeting of ISMRM, Honolulu, HI, USA, 2017
10. Wiggins G, Triantafyllou C, Potthast A, Reykowski A, Nittka M, Wald L. 32-channel 3 tesla receive-only phased-array head coil with soccer-ball element geometry. Magnetic Resonance in Medicine 2006;56(1):216-223.
11. Cui J, Bosshard J , Rispoli J, Dimitrov I, Cheshkov S, McDougall M, Wright S. (2015) A Switched-Mode Breast Coil for 7 T MRI Using Forced-Current Excitation. IEEE Transactions on Bio-Medical Engineering, 62(7), 1777–1783.
Figures