1692
Accurate Noise Figure Measurements for Highly Mismatched Preamplifiers1Department of Electrical Engineering, Technical University of Denmark, Kgs. Lyngby, Denmark, 2GE Healthcare, Brøndby, Denmark
Synopsis
A method reducing the uncertainty of noise figure measurements of highly mismatched preamplifiers is presented. In many cases when measuring the noise figure of preamplifiers for MRI receive arrays the uncertainty is approximately ±0.4 dB. Since the noise figure of the preamplifier is also in this range, a more accurate method is needed. Here we show an increase of 59 % in noise figure accuracy by adding an attenuator between the noise source and preamplifier.
Introduction
Characterizing the noise figure of highly mismatched preamplifiers for MRI receive arrays entails an inherent large estimated uncertainty of the experiment when using a standard 50 Ω measurement system 1. Especially when the noise figure of the preamplifier is below 1 dB the measurement uncertainty becomes dominant 2–4. This work presents a method for reducing the uncertainty of noise figure measurements when the preamplifier has an input reflection coefficient approaching unity with a noise figure below 1 dB. Further, the measurement errors from correctable error sources are measured to compare their practical significance in measuring noise figure.Methods
Correctable bias when measuring noise figure includes e.g. temperature drift of the noise source, shielding of the preamplifier to prevent pickup of spurious signals and choosing a proper measurement bandwidth. The uncertainty when measuring noise figure is caused by the non-correctable thermal noise of components in the chain of the measurement device and general calibration errors of the noise meter 1.
A
measurement uncertainty is normally given by the manufacturer of the noise
meter 5. The primary sources of uncertainty is the gain
of the preamplifier, the preamplifier’s inherent noise figure and the standing
wave ratio at the input of the preamplifier. The measured noise figure is Gaussian
distributed in the decibel scale, hence $$$F_\textrm{meas} \sim N(\mu _{\textrm{meas}},\sigma^2_{\textrm{meas}})$$$. If an attenuator is
added between the noise source and the preamplifier the standing wave ratio
seen by the noise source is decreased. The calculated noise figure of the
preamplifier in the cascaded setup is described in the decibel scale by
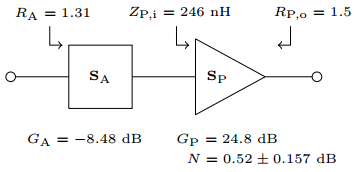
$$F_\textrm{P}=G_\textrm{A}+F_\textrm{meas},$$
where $$$G_\textrm{A} \sim N(\mu _{\textrm{A}},\sigma^2_{\textrm{A}})$$$ is the available gain of the attenuator in dB which is Gaussian distributed. Hence the preamplifier’s noise figure in the cascaded system is also described by a Gaussian distribution with mean, $$$ \mu_\textrm{P} = \mu_\textrm{meas} + \mu_\textrm{A} $$$, and variance $$$ \sigma^2_\textrm{P} = \sigma^2_\textrm{meas} + \sigma^2_\textrm{A} $$$. The uncertainty is usually described by the 95% confidence interval given by $$$ \sigma^{95\%}_\textrm{P} = 2\cdot(\sigma^2_{\textrm{meas}}+\sigma^2_{\textrm{A}})^{0.5} $$$ for the cascaded system.
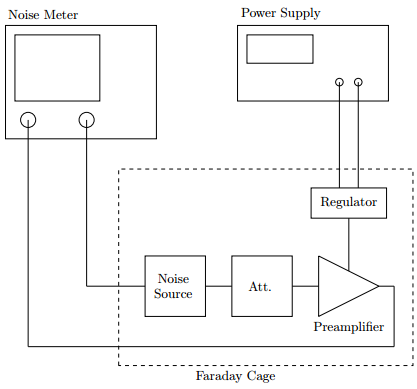
The measurement setup is seen in Figure 1. The noise figure measurements are performed on a Keysight PSA (E4440A) spectrum analyzer with noise figure extension and internal preamplifier using 256 averages. The noise source is a Keysight 346B. The S-parameters of the attenuator and preamplifier are measured using a Keysight ENA (E5062A) network analyzer calibrated using the Short-Open-Load-Through technique also using 256 averages. The external power supply is an Aim TTi EL302RT. The voltage regulator is based on an LM317 design 6. A Rohde and Schwarz CMW-Z10 faraday cage is used to shield the preamplifier from spurious signals.
Results
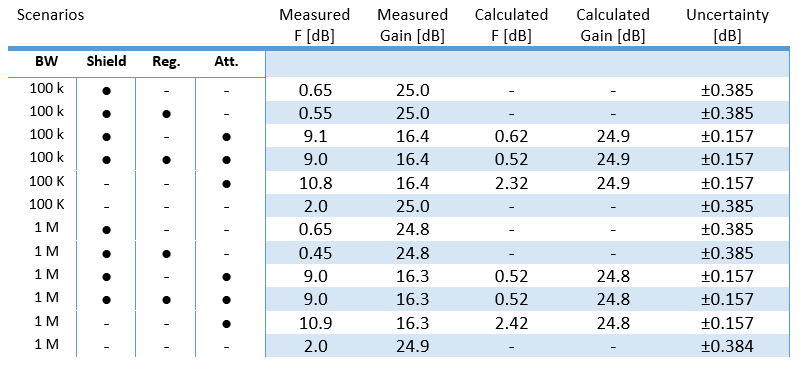
Measurements and calculations are found in Table 1 and Figure 2. Measuring without the attenuator yields an uncertainty of ±0.385 5, while the uncertainty of the uncorrected measurement with the attenuator is ±0.135. The available gain of the attenuator is measured at -8.483 ± 0.08 dB 7. Thus yielding an uncertainty of ±0.157 when the attenuator is included.Discussion
The gain of the preamplifier must be above approximately 10 dB in order to mitigate measurement uncertainty. It can be lower if an (additional) external preamplifier is used. Here, even though dropping the gain by 8.5 dB, the gain is still above the critical point. This should be representative of most MRI preamplifiers.
Adding the attenuator decreases the mismatch between the preamplifier and noise source yielding a lower uncertainty. However, the uncertainty of the available gain of the attenuator is directly added to the estimated uncertainty. Hence, the applicability of this method is void if the decrease in estimated uncertainty from decreasing the mismatch is countered by the measurement uncertainty of the gain measurement of the attenuator. Generally, if we are concerned with highly mismatched preamplifiers the presented method is preferable.
An aspect concerning the method of noise figure acquisition, which is not covered in depth here, is the fact that the noise source switches between two known noise states to calculate the noise figure. These two noise states inherently change the impedance presented at the input of the preamplifier. The method presented here also mitigates this problem due to higher isolation.
Conclusion
In This work we present a method for decreasing the uncertainty of noise figure measurements for highly mismatched preamplifiers. The described estimated uncertainty is achieved by adding a well-characterized attenuator between the preamplifier and the noise source. An example is shown, where the estimated uncertainty (95% confidence interval) is lowered by 59 % (from ±0.385 dB to ±0.157 dB) for a 32 MHz preamplifier.Acknowledgements
This work was supported in part by the Danish National Research Foundation under grant DNRF124.References
1. Noise Figure Measurement Accuracy: The Y-Factor Method, Application Note, Keysight Technologies.
2. Johansen, D. H., Sanchez-heredia, J. D., Zhurbenko, V. & Ardenkjær-larsen, J. H. Practical Aspects of Preamplifier Designs for 13C Imaging. in Proc. Intl. Soc. Mag. Reson. Med. (2017).
3. Cao, X. et al. Design of a 3T preamplifier which stability is insensitive to coil loading. J. Magn. Reson. 265, 215–223 (2016).
4. Zanche, N. De & Pruessmann, K. P. Noise figure characterization of preamplifiers at NMR frequencies. J. Magn. Reson. 210, 7–15 (2011).
5. Keysight Noise Figure Uncertainty Calculator. Available at: http://rfmw.em.keysight.com/NFUcalc. 6. LM317 3-Terminal Adjustable Regulator. Texas Instruments, SLVS044X (2016).
7. Keysight Vector Network Analyzer Uncertainty Calculator. Available at: www.keysight.com/find/na_calculator.
Figures