1688
Fitting MAP-MRI in 2 shell DWI Datasets using Model-based Extrapolation1Department of Psychological and Brain Sciences, Indiana University, Bloomington, IN, United States, 2Department of Intelligent Systems Engineering, Indiana University, Bloomington, IN, United States
Synopsis
We showed that three shells are sufficient to result in good approximations of MAP-MRI indices from numerical simulation. We used multiple compartment microstructure models to fit the two shell data and extrapolate the third shell with a higher b-value. We compared the performance of two models, NODDI and NODDI with fiber crossing (NODDIx), on the Human Connectome Project (HCP) DWI data. NODDIx showed improvement in the white matter with extrapolation but NODDI did not. Both NODDI and NODDIx failed to improve the results in the gray matter. Our approach also provides a new mechanism in validating or comparing microstructure models.
Introduction
Diffusion weighted imaging (DWI) has been a great non-invasive method for investigating brain microstructure1. Most DWI based analysis of the microstructure fall into two categories: model of the tissue to acquire tissue-specific metrics and model of the signal to compute quantitative physical properties of the diffusion2. Recently, a signal-based framework called Mean Apparent Propagator (MAP)-MRI uses a series of basis functions to fit the three-dimensional q-space signal and transform it into diffusion propagators3. The advantage of MAP-MRI is that it is essentially model-free. MAP-MRI provides richer information of microstructural features compared with DTI-derived indices. The motivation of this work is to use two-shell data to predict the third shell and use these data to derive more microstructure information in the framework of MAP-MRI. In this work, we first showed that three shells can give reasonable results as compared to 6 shells from numerical simulation. Then we proposed an extrapolation method based on NODDI4 and an extended NODDI model with fiber crossing (NODDIx)5 on the Human Connectome Project (HCP) data (3 shells). We compared the MAP-MRI indices from extrapolated results and the original ones.Methods
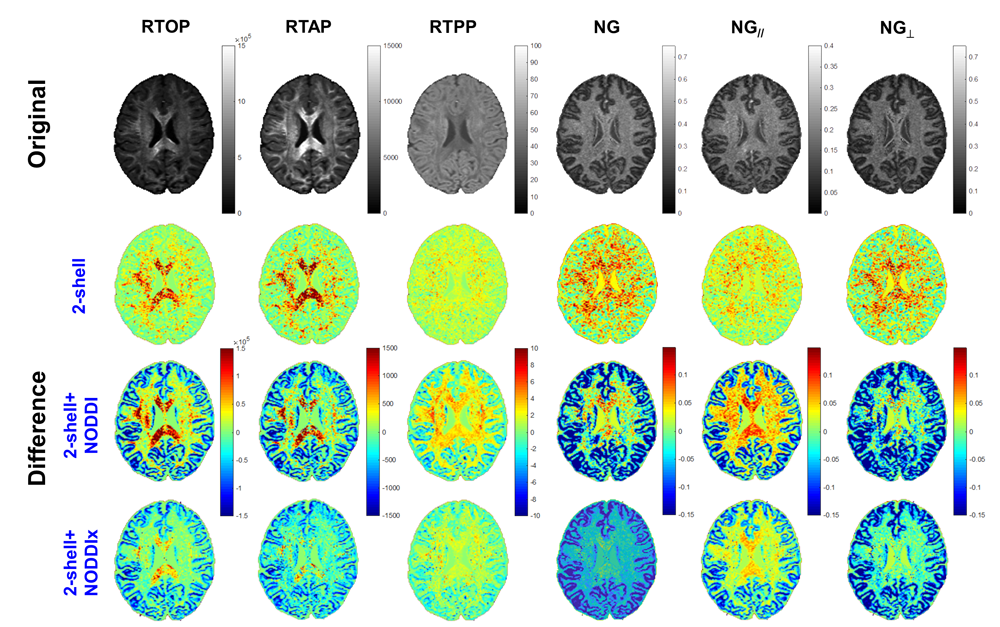
The general framework of extrapolation and MAP-MRI is illustrated in Fig. 1. Six MAP-MRI indices were computed: the return-to-origin probability (RTOP), and its projection to the diffusion tensor axis and perpendicular plane: RTAP and RTPP; the non-Gaussianity (NG) index, and the projection of NG to the diffusion tensor axis and perpendicular plane NGpar and NGper.
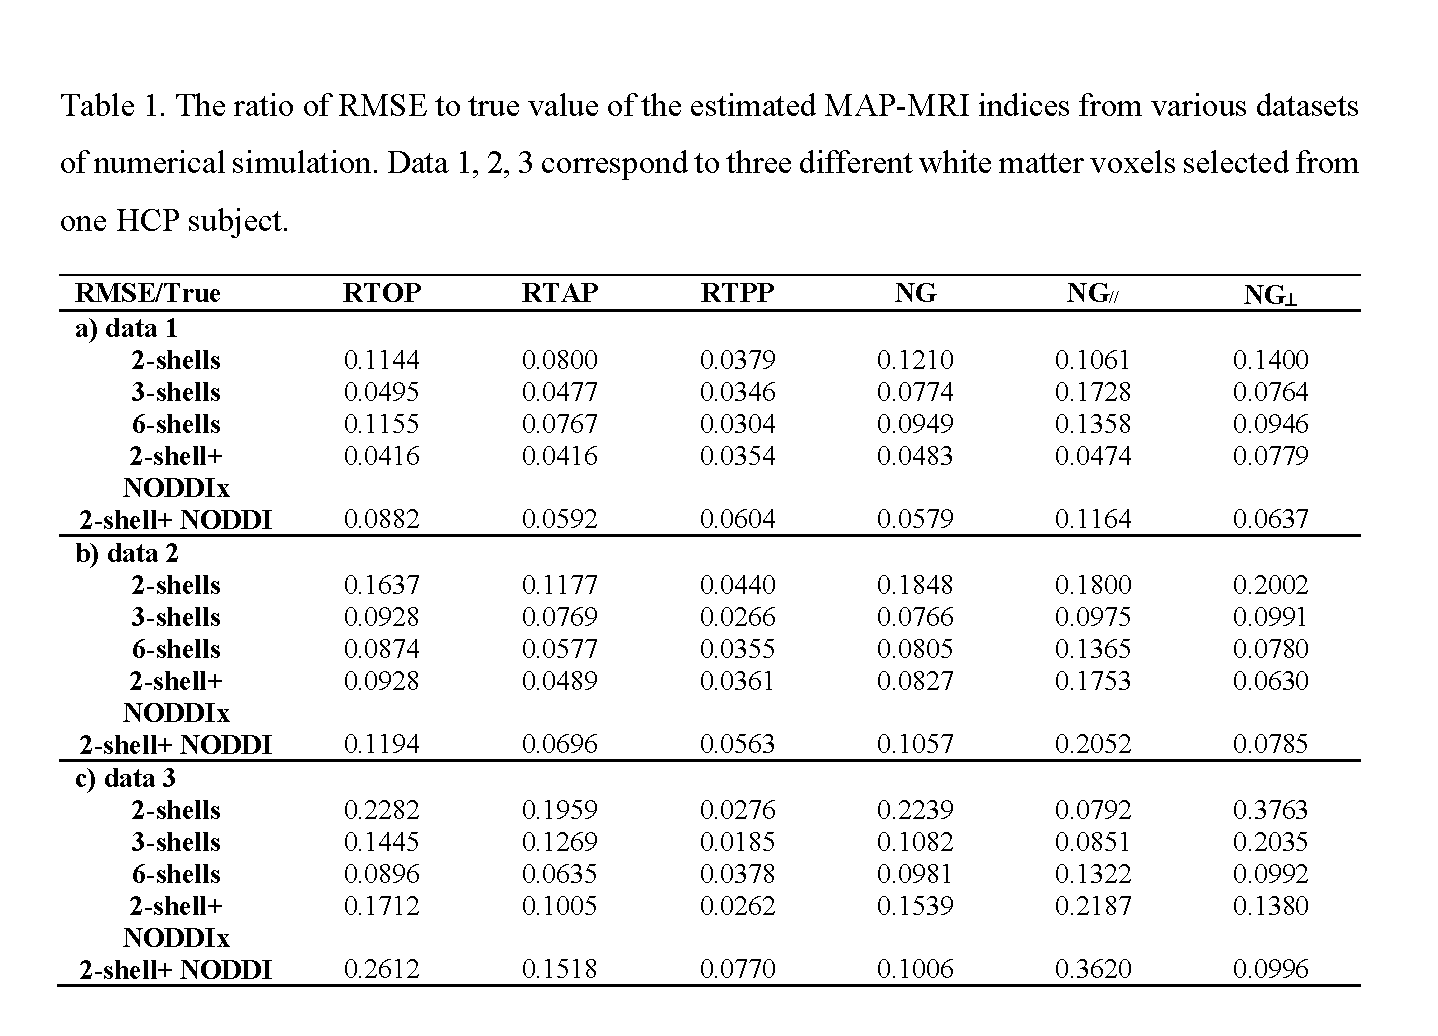
We generated the synthetic diffusion signals using the MAP-MRI framework with b-value = [1000, 2000, 3000, 4000, 5000, 6000] s/mm2, and the same b-vectors as used in the HCP protocol for each shell. We generated three sets of data (each contained 100 voxels) to represent different WM regions using the MAP coefficients and scaling factors derived from three white matter voxels of one HCP subject. The scaling factor for data 1, data 2, and data 3 were [0.0103, 0.0043, 0.0033], [0.0082, 0.0056, 0.0051], [0.0074, 0.0068, 0.0053] respectively. The SNR was set to 20. The extrapolation was performed on the two inner shell data based on NODDI and NODDIx models. The MAP-MRI indices were calculated from two shells data (b = 1000, 2000), three shells data (b = 1000, 2000, 3000), all six shell data, and the two shell data plus the extrapolated third shell (b = 3000) using NODDI and NODDIx. These datasets were denoted as 2-shell, 3-shell, 6-shell, 2-shell+ NODDI, and 2-shell+ NODDIx DWI data. Root Mean Square Error (RMSE) was computed for MAP-MRI indices with respect to the true values. To test the extrapolation on human subjects, we used DWI data of 10 subjects from the HCP dataset. The MAP-MRI indices were calculated from two shell data (b = 1000, 2000), original three shell data (b = 1000, 2000, 3000) and the two shell data plus the extrapolated third shell (b = 3000) using NODDI and NODDIx. Root Mean Square Error (RMSE) was computed by using the original 3-shell data as ground truth.
Results
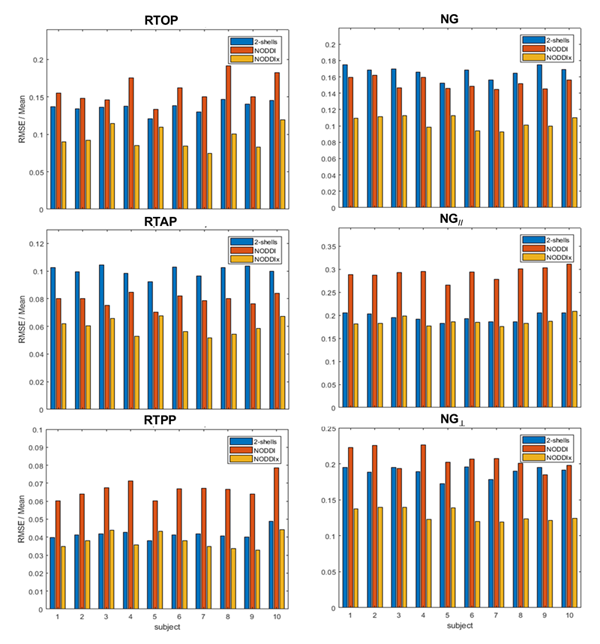
The results from the numerical simulation are summarized in Table 1. Results with 3 shells were most comparable with 6-shell results. In all cases except NGpar of the corpus callosum voxel, the results of extrapolation with NODDIx were all better than those with 2-shell data. Figure 2 shows the human results. Using two shells of the DWI data could result in moderate differences from the 3-shell data. Extrapolation using NODDI did not improve the results. In contrast, extrapolation with NODDIx showed promising improvements from two shell results in the white matter (WM) region, in which extrapolation with NODDIx is superior to two-shell data or extrapolation with NODDI for all MAP-MRI metrics. However, in the gray matter (GM) region, both extrapolation with NODDI and NODDIx yielded larger error than 2-shell data. The ratio of RMSE over mean value of MAP-MRI indices using different methods for 10 HCP subjects is shown in Fig. 3. First of all, the rank of these three methods was very consistent across subjects. Second, without surprise, 2-shell+ NODDIx scored the smallest error across all six indices for most subjects.Discussions
We have demonstrated from numerical simulation that using three shells with b-value from 1000 – 3000 s/mm2 can result in better approximation for MAP-MRI metrics than two shell data. We found that extrapolation with NODDIx improved the accuracy of the MAP-MRI metrics in the white matter while extrapolation with NODDI did not. This new technique can be applied to existing DWI data with two shells to perform MAP-MRI analysis in addition to NODDI and DKI.Acknowledgements
The authors would like to thank Evren Özarslan, PhD, for providing a data with all MAP-MRI parameters as ground truth which made the implementation of his method easier.References
1.Basser, P.J., Mattiello, J., LeBihan, D., 1994b. MR diffusion tensor spectroscopy and imaging. Biophys. J. 66, 259-267.
2.Ferizi, U. et al., 2016. Diffusion MRI microstructure models with in vivo human brain Connectom data: results from a multi-group comparison. arXiv:1604.07287 [physics.med-ph].
3.Özarslan, E. et al., 2013. Mean apparent propagator (MAP) MRI: A novel diffusion imagingmethod for mapping tissue microstructure.
4.Zhang, H. et al., 2012. NODDI: Practical in vivo neurite orientation dispersion and density imaging of the human brain. Neuroimage 61, 1000-1016.
5.Farooq, H. et al., 2016. Microstructure Imaging of Crossing (MIX) White Matter Fibers from diffusion MRI. Sci Rep, 38927.
Figures